When does TMAO fold a polymer chain and urea unfold it?
Abstract
Longstanding mechanistic questions about the role of protecting osmolyte trimethylamine N-oxide (TMAO) which favors protein folding and the denaturing osmolyte urea are addressed by studying their effects on the folding of uncharged polymer chains. Using atomistic molecular dynamics simulations, we show that 1-M TMAO and 7-M urea solutions act dramatically differently on these model polymer chains. Their behaviors are sensitive to the strength of the attractive dispersion interactions of the chain with its environment: when these dispersion interactions are high enough, TMAO suppresses the formation of extended conformations of the hydrophobic polymer as compared to water, while urea promotes formation of extended conformations. Similar trends are observed experimentally on real protein systems. Quite surprisingly, we find that both protecting and denaturing osmolytes strongly interact with the polymer, seemingly in contrast with existing explanations of the osmolyte effect on proteins. We show that what really matters for a protective osmolyte is its effective depletion as the polymer conformation changes, which leads to a negative change in the preferential binding coefficient. For TMAO, there is a much more favorable free energy of insertion of a single osmolyte near collapsed conformations of the polymer than near extended conformations. By contrast, urea is preferentially stabilized next to the extended conformation and thus has a denaturing effect.
I Introduction
Osmolytes are small cosolutes found endogenously to protect cells against osmotic stressYancey et al. (1982). However, they can have profound effects on protein stabilityWyman (1964); Tanford (1969); Timasheff (2002); Parsegian et al. (2000); Bolen and Rose (2008); Courtenay et al. (2000); Canchi and García (2013). While some of them are denaturants (e.g. urea), others like trimethylamine N-oxide (TMAO) act as protecting osmolytes in vivo: in denaturing conditions, they bias the protein structure toward the folded conformation Street et al. (2006); Wang and Bolen (1997); Yancey et al. (1982); Lin and Timasheff (1994). They are thus referred to as chemical chaperones. Hence, TMAO is used by deep-sea organisms to counteract the deleterious effect of pressure and by sharks or skates to compensate for their relatively high concentrations of the denaturing urea. Most interestingly, the protein folding propensity of TMAO has been used experimentally to study the mechanisms involved in protein misfolding diseases, including e.g. prion protein Tatzelt et al. (1996); Nandi et al. (2006), tau protein Tseng and Graves (1998); Scaramozzino et al. (2006) (Alzheimer disease) and alpha-synuclein Uversky et al. (2001) (involved in numerous neurodegenerative diseases); chemical chaperones like TMAO even appear promising as therapeutics Morello et al. (2000), even though it was recently found to be related to an increased risk of cardiovascular diseases in humans Tang et al. (2013). TMAO is active in endogenous systems for concentrations as low as 200 mM Tatzelt et al. (1996); Yancey et al. (1982). Experiments in vitro on alpha-synuclein, an intrinsically disordered protein, have given evidence that this protective effect increases with concentration. Uversky et al. (2001)
TMAO is a small amphiphile (chemical formula: (CH3)3NO) consisting of a small hydrophilic group (N+O-) and a bulky hydrophobic part (3 methyl groups). Several mechanisms have been invoked to explain the folding propensity of TMAO. In a first scenario, TMAO would enhance water structure and hydrogen-bond (HB) strength, which would indirectly affect the equilibrium between the folded and the unfolded conformations of a protein.Bennion and Daggett (2004); Sharp et al. (2001); Hunger et al. (2012) However, this mechanism has been challenged by several studies, mainly based on molecular dynamics (MD) simulations, where no significant alteration of water structure was found in aqueous solutions of TMAO Athawale et al. (2005); Cho et al. (2011); Hu et al. (2010). These results may not be surprising since TMAO can only accept 2 to 3 strong HBs at its hydrophilic head, which represents less than of its hydration water HB population Stirnemann et al. (2010).
Other studies have suggested that direct interactions, or especially the lack thereof, between TMAO and the protein backbone could cause the osmolyte effect. In particular, thermodynamic measurements have highlighted the importance of the interactions between TMAO and the protein backbone and side-chains Street et al. (2006); Wang and Bolen (1997). TMAO has favorable interactions with some protein side-chains, especially the positively charged groups that can interact with the O- of TMAO. In contrast, interactions with the protein backbone, in particular with the amide NH, are entropically unfavorable.Cho et al. (2011) If these unfavorable interactions were to dominate, TMAO would be depleted from the protein surface. It has been suggested that the resulting concentration gradient in the TMAO could lead to an osmotic pressure favoring the folded conformation with respect to the unfolded one. Cho et al. (2011) Recently, Garcia and co-workers have combined Canchi et al. (2012) computer simulation with the experimental osmotic pressure measurements and have suggested a mechanism where there is preferential exclusion of TMAO from protein surfaces due to repulsive self-interaction in the solvation shell. Others have argued that osmotic pressure itself cannot explain this phenomenon, and that “water mediated interactions” between the osmolyte and the protein could also play a role.Hu et al. (2010)
However, a clear unifying scenario has not yet emerged from the study of the effect of TMAO on proteins. One of the reasons might be the presence of amino acids with different chemical properties which might complicate the role of TMAO as a structure enhancer. Thus instead of struggling with different amino acids, a successful strategy can be to use a simple polymeric chain whose hydrophobicity can be tuned. There have already been studies of the action of TMAO on purely hydrophobic chainsAthawale et al. (2005), but even for such a simple system a consensus has not yet been achieved. A good illustration of the lack of consensus is the opposite conclusions reached in two different investigations. Based on simulations of a small hydrophobic solutes and of hydrophobic chains, one of these studies suggested that TMAO has a negligible effect on the hydrophobic interactions.Athawale et al. (2005) In contrast other studies suggest that TMAO destroys hydrophobic interactions Paul and Patey (2007).
To investigate the molecular mechanism of TMAO’s role as a protective osmolyte, it is interesting to compare it with the effect of urea (chemical formula: (NH2)2CO) solutions that lead to the opposite behavior — unfolding of the protein. For example Pettitt and co-workersKokubo et al. (2011) have recently explored the conformational preferences of decaalanine in TMAO and urea solutions using free energy perturbation techniques. Their analysis, based on the decomposition of the transfer free energy, suggests the differences in the behavior of peptide in the two different solutions arises mainly from differences in the relative importances of van der Waals and electrostatic interactions: urea denaturation is dominated by van der Waals attractions whereas TMAO exterts its effect by causing unfavorable electrostatic interactions. In this contribution we extend our previous work on urea Zangi et al. (2009) by using similar systems and methodologies and apply it to contrast the respective role of a denaturing osmolyte (urea) and a protective osmolyte (TMAO) on uncharged chains in water. We focus on the mechanisms by which these two osmolytes produce opposite actions on the conformations of this Lennard-Jones chain. Following most of the previous simulation studies, we used concentrations higher than that found in vivo to enhance the osmolyte influence on protein stability. Hence we chose a concentration of 7 M for urea (consistent with Ref. Zangi et al. (2009)) and a concentration of 1 M for TMAO. Both concentrations are widely used to study the effects of the respective osmolytes in vitro and in silico. Our study shows that while acting on the same chain, TMAO stabilizes the collapsed conformations of the chain while urea destabilizes the collapsed conformations, and the simulations later allow us to offer a molecular explanation to these different behaviors. The paper is organized as follows: the simulation model and methods are described in section II, results are presented in section III, and some conclusions are presented in section IV.
II Simulation model and methods
System and forcefields Our system consists of a 32-bead polymer solvated in various aqueous solutions. The polymer is uncharged and the beads only interacts with their environment via Lennard-Jones (LJ) potentials. While the bead radius is fixed (=0.4 nm) the hydrophobic character of the chain can be tuned by varying the energy parameter . Following a previous study,Zangi et al. (2009) four values were employed ( kJ/mol) even if most of the current work was performed on the kJ/mol polymer. Among the chain, 1-4 interactions were removed; parameters for the 1-2 (bonds) and 1-3 (angles) interactions can be found elsewhere.Zangi et al. (2009) For water molecules, we used the SPC/E modelBerendsen et al. (1987), while urea interacts through the OPLS/AA forcefield Duffy et al. (1993) and TMAO through the forcefield developed by Kast et al’sKast et al. (2003). The geometric combining rules were used in the cross interactions for and arithmetic combination rules were used for . Three systems were simulated. The system of pure aquous solution was composed of the polymer solvated by 4092 water molecules. The system of 1 M TMAO solution was composed of the 32-bead polymeric chain, 79 TMAO molecules and 4013 water molecules. On the other hand, the system of 7 M urea solution was composed of the 32-bead polymeric chain, 500 urea molecules and 2727 water molecules. The box size was close to nm3 in all cases. We have also repeated our simulation for TMAO at kJ/mol using a different forcefield (called herein the “osmotic model”) recently proposed by Garcia and coworkersCanchi et al. (2012) and we found it to follow the same qualitative trends (c.f. the Appendix).
Equilibrium simulations All simulations were performed using Gromacs 4.5.4 software Hess et al. (2008). In a bid to sample different polymer conformations in different osmolyte solutions, unrestrained equilibrium MD simulations of the polymer chain were performed in pure water, 1 M TMAO and 7 M urea solutions. In order to avoid any bias, an extended configuration of the polymeric chain was used as an initial configuration in pure water and in the aqueous solution of 1 M TMAO while a collapsed configuration of the polymer was used as an initial configuration for the simulation in aqueous solution of 7 M urea. The initial extended configuration was an all-trans configuration of the polymer while the collapsed configuration was picked from the simulation of the polymer in water. Each of the systems was first energy-minimized using a steepest-descent algorithm and then subjected to 100 ns of production run in NPT ensemble. The Nose-Hoover thermostat was used for maintaining the average temperature at 300 K and the Parinello-Rahman barostat was used for maintaining the average pressure at 1 bar. For all three aqueous solutions, unrestrained simulations were repeated for the four values of the LJ energy parameter () for the polymer beads.
Potentials of mean-force We determined the free energy landscape (or potential of mean force [PMF]) of the 32-bead LJ chains along one or several collective reaction coordinates in different solutions by performing umbrella sampling simulations. We chose as reaction coordinate the polymer radius of gyration in pure water, 1 M TMAO and 7 M urea. We employed the PLUMED extension of GromacsBonomi et al. (2009). The value of ranged from 0.4 nm to 1.2 nm at a spacing of 0.05 nm between adjacent windows. Restraining harmonic force constants of 7000 kJ/mol/nm2 were used in the umbrella potential in all positions to ensure a Gaussian distribution of the reaction coordinate around each desired value of the reaction coordinate. Finally, we used the Weighted Histogram Analysis Method (WHAM). Kumar et al. (1992); A.Grossfield to generate unbiased histograms and corresponding free energies. As described later we also compute the joint probability distribiution of and the end-to-end distance and the corresponding potential of mean force as a function of these two variables.
Preferential interaction We employed two parameters to measure the affinity of the cosolvent (urea or TMAO) for the polymer. First, the local-bulk partition coefficient was calculated, where asCourtenay et al. (2000)
| (1) |
Here is the average number of molecules of type X bound to polymer and is the total number of molecules of type X in the system (where stands for the cosolvent (urea or TMAO) and stands for water). is intensive and reflects the affinity of the cosolvent for the polymer regardless of the exposed surface area of the polymer. The other parameter is the experimentally-relevant preferential binding coefficient,Wyman (1964); Tanford (1969); Courtenay et al. (2000); Shukla et al. (2009); Canchi et al. (2012)
| (2) |
which is extensive (i.e., it depends on the size of the hydration shell). To determine the dependence on the proximal cut-off distance for the counting of molecules around the polymer, we computed the value of both quantities and as a function of distance from the polymer (i.e., by examining the explicit distance dependance of and ), which is defined as the shortest distance between the central atom of the solvent molecule (O for water, N for TMAO and C for urea) and any polymer bead. Additional simulations were performed as follows. We froze 5 representative configurations of the the polymer either in the collapsed or the extended state for each osmolyte solution, and then propagated each of these simulations for 15 ns (total simulation length of 75 ns for each polymer configuration). In each case, both and were averaged over this ensemble of trajectories, and standard deviations were obtained via block averaging.
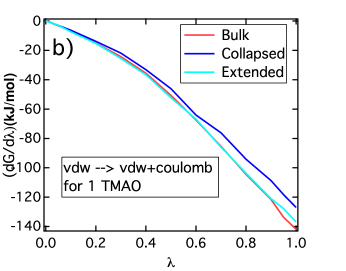
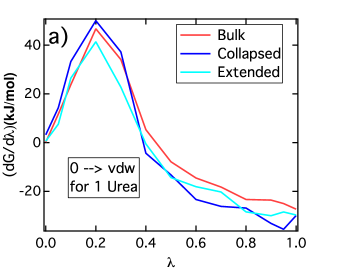
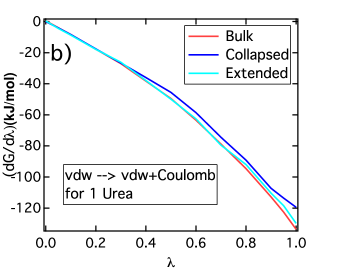
Finally, we used the Free Energy Perturbation (FEP) technique to compute the transfer free-energy (chemical potential) for inserting a single TMAO (or urea or water molecule) from bulk solution into the first solvation shell of particular conformations of polymer in 1 M TMAO (or 7 M urea) where the polymer conformation was fixed in either a collapsed or an extended conformation. For these calculations the initial configurations were taken from a representative snapshot of the prior umbrella sampling windows and the TMAO (or urea or water) molecule was grown in presence of other TMAO (or urea or water) molecules in solution. The interactions of the molecule being inserted were slowly turned on in two stages: in the first stage only the van der Waals interactions were turned on, and in the second stage the electrostatic interactions were turned on. Thermodynamic integration gives these two contributions to the transfer free energy. The difference between the free energy for the insertion proximate to the polymer and the insertion in bulk gives the required transfer free energies. Finally, since the choice of the position near the polymer where the osmolyte and solvent molecules is grown is arbitrary, we repeated such calculations at several positions in each case: 5 sites for TMAO and urea and 3 sites for water near each of collapsed and extended conformations and 2 sites of each of them in bulk media. They were finally averaged and the standard deviations were estimated.
III Results and discussion
III.1 Osmolyte effect on folding equilibria
We first verify that the effects of TMAO and urea on an uncharged Lennard-Jones polymer chain are those observed in protein systems, i.e. that they act respectively as protective and denaturing osmolytes. Towards this end, a reasonable approach is to follow the time-evolution of an order parameter describing the polymer conformation, like its radius of gyration which will allow us to distinguish between the collapsed and extended configurations. Such profiles are shown for a polymer with a bead interaction parameter kJ/mol in Figure 1. For these unrestrained simulations, the initial configurations in each system (water, 1 M TMAO and 7 M urea) were chosen anticipating the effect of this aqueous solution on the polymer conformational equilibrium. Thus, simulations were started from an unfolded, state in water and TMAO solutions ( Å), and started from a collapsed configuration ( Å) in the urea solution. Each of these simulations were then propagated for 100 ns.
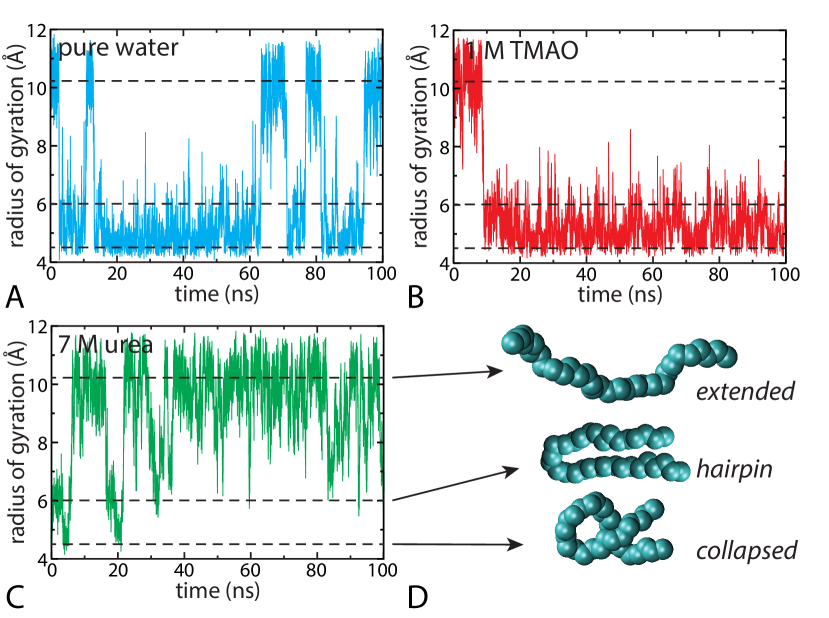
Figure 1 shows that the polymeric chain behaves very differently in the three environments. In water (Figure 1A), the initially-extended polymer quickly collapses and then fluctuates between the collapsed and the extended configurations. In the TMAO solution (Figure 1B), the polymer collapses and remains compact for the whole 100-ns timescale: the extended configuration sampled in pure water is not observed in TMAO on the time scale of the simulation. In contrast, the polymer in urea unfolds, (Figure 1C) but very occasionally revisits more compact states like the hairpin at nm, and very rarely visits the most compact states seen in water.
We thus see that for =1.0 kJ/mol, TMAO and urea act respectively as protective and a denaturing osmolytes with respect to the hydrophobic chain. This was already observed for ureaZangi et al. (2009) albeit for a different water model (TIP4PJorgensen et al. (1983)). It is remarkable that these osmolytes have similar effects on the hydrophobic chain as they do on real proteins. In the following, we aim to better understand this interesting behavior.
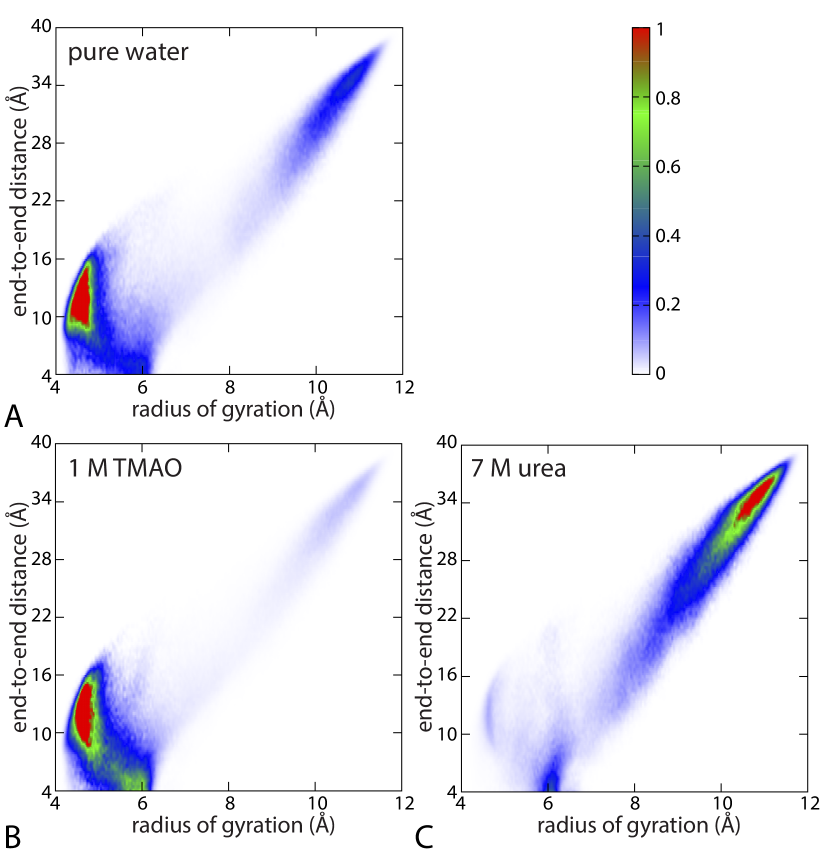
The semi-compact hairpin configuration of the chain ( nm) observed in the urea solutionZangi et al. (2009) (see Figure 1C) and to some extent in water and TMAO solution (Figure 1A and Figure 1B) can be better understood by considering a two dimensional collective coordinate consisting of the radius of gyration and the end-to-end distance of the chain. Figure 2 shows the joint probability of finding a polymer (=1.0 kJ/mol) with end-to-end distance and radius of gyration , for each of the systems shown in in Figure 1. To avoid possible biases due to limited sampling in unperturbed simulations, the probability distribution of is first recovered from the PMF obtained via umbrella-sampling simulations. In each window, we later estimate the conditional probability of finding given . The joint probability is finally recovered using the relation
| (3) |
The distributions shown in Figure 2 confirm our previous findings: in urea the extended configurations are significantly more populated than in water whereas in TMAO they are essentially absent. Moreover, the hairpin state observed at nm and small in the 2D plots, although more prominent in urea solution, also appear in TMAO solution and in pure water. In contrast, the collapsed state around nm corresponds to higher , showing that in the two order parameters are largely decoupled in this region of the distribution. Unfolded configurations correspond to high values of both and and give rise to distributions elongated along the diagonal in the 2D plots and only urea has a strong peak there.
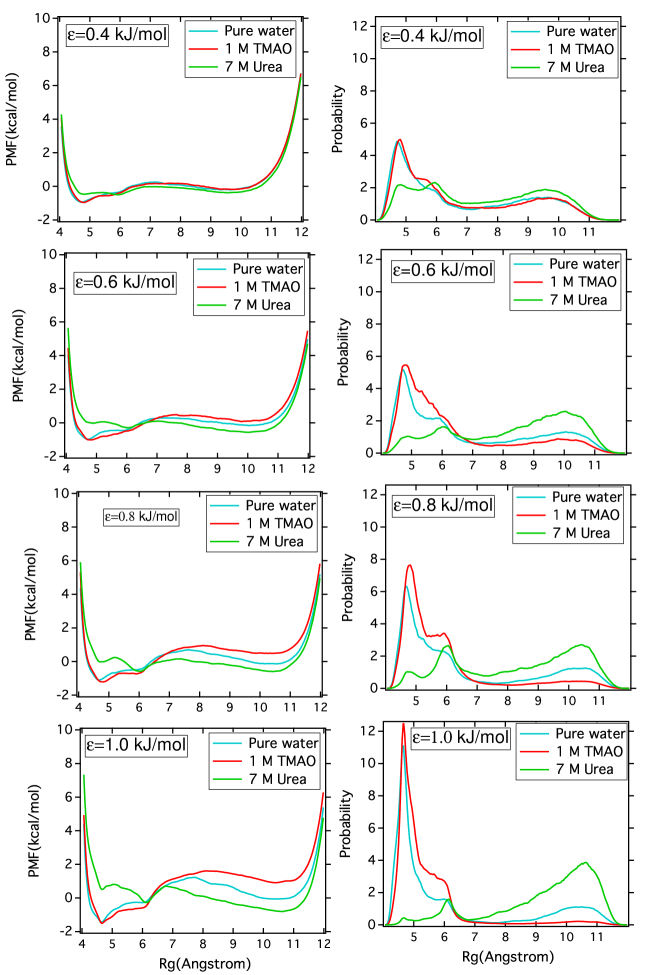
The potentials of mean force as a function of the polymer radius of gyration , obtained via umbrella sampling, corresponding probability distributions (for =1.0 kJ/mol) and for the three aqueous solutions are shown in Figure 3A and B respectively (and in the Figure 6 for other values of ). These correspond to the projections of the joint-probability distribution onto the radius of gyration axis. These provide a more reliable and quantitative description of the polymer conformational equilibrium than simulations based on unrestrained MD trajectories (Figure 1) because those would require much longer runs (as later illustrated by the free-energy barriers of 2 to 4 kcal/mol between states).
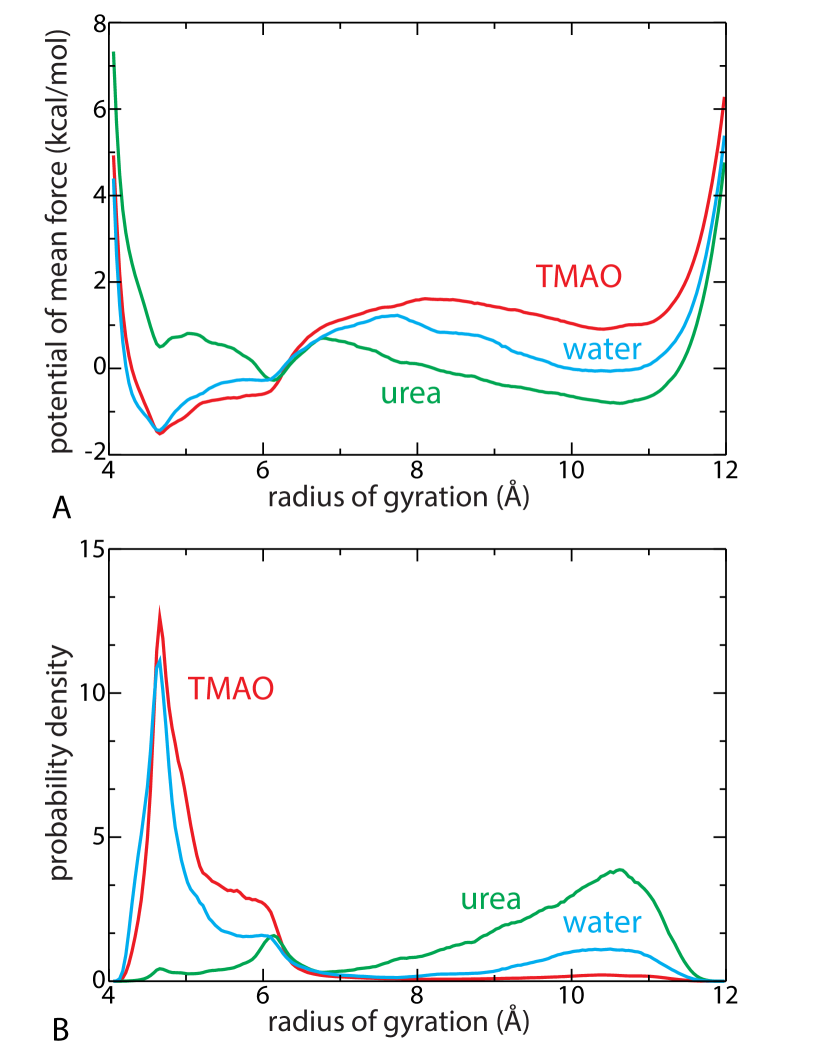
As can be seen in Figure 3, the unfolded state in TMAO solution gets destabilized with respect to pure water, whereas the collapsed state is not dramatically affected. Quite remarkably, the unfolded state is almost totally suppressed for TMAO and its collapsed state is more compact for this case of kJ/mol.
In previous molecular dynamics simulations of a similar system, Athawale et al. (2005) it was found that that TMAO has little affect on the conformational equilibrium of a hydrophobic polymer chain. In that study a lower polymer bead parameter of kJ/mol was used than in our simulations. It is therefore of importance to determine the effect of smaller on the behavior of TMAO, as was done earlier for urea solutionsZangi et al. (2009). In the Appendix and Figure 6 that as the hydrophobicity of the the chain is increased or equivalently as is decreased the chain responds differently to TMAO. effect of 1 M TMAO solution is thus very sensitive to the value of . We find that the protecting role of TMAO is very weak when the chain is strongly hydrophobic (low values of 0.4 and 0.6 kJ/mol), in agreement with the conclusions of the previous study.Athawale et al. (2005) However TMAO’s protecting role becomes much more prominent for larger values 0.8 and 1.0 kJ/mol.
As previously suggested using a different water model Zangi et al. (2009), the response of the polymer to urea on decreasing is radically different. The trend is clearly opposite to that found in water or in TMAO solution: the unfolded state gets stabilized while the collapsed state population progressively disappears, and a significant fraction of the population is found in the hairpin state. Urea therefore exhibits a typical denaturing effect. In strong contrast with TMAO and in agreement with a previous studyZangi et al. (2009), we show in the Figure 6 that urea readily denatures hydrophobic polymers (e.g. 0.4 kJ/mol) yet its denaturing effect becomes more prominent as increases.
To assess the robustness of our results, we also repeated our simulations kJ/mol using a different water modelJorgensen et al. (1983) and found very similar results (see Appendix and Figure 8 ). Although the force-field we have employed for TMAO has been widely employed in the past and clearly behaves as a protective osmolyte, Cho et al. (2011); Hu et al. (2010); Kokubo et al. (2011) it has recently been criticized because it underestimates osmotic pressure at high solute concentrations.Canchi et al. (2012) We have repeated our simulations at 1 M using Garcia et al’s modified “osmotic”) version of this force-field.Canchi et al. (2012) As shown in Figure 7, its effect on the polymer chain nonetheless differs very little from what we observed using the aforementioned forcefield.
Our simulations show that TMAO acts as a protective osmolyte and urea as a denaturant on the polymer chain for kJ/mol. TMAO thus acts on this chain similarly to the way it acts on many proteins as found experimentally Bolen and Rose (2008), showing that its effect extends to purely uncharged polymer chains of moderate hydrophobicity. TMAO’s ability to act as a protecting osmolyte depends on the properties of the polymer it is acting on as is shown by its sensitivity to the value of the polymer-bead : TMAO seems to have little effect on strongly hydrophobic chains. Urea, on the other hand still denatures them. In the following, we aim to better understand the effect of both osmolytes on the polymer chain with kJ/mol.
III.2 Molecular Mechanism of Osmolyte-induced (un)folding
III.2.1 Interpretation based on preferential binding and chemical potential of osmolytes
It has been suggested in the literature that denaturants exhibit preferential interaction with protein surfaces while protective osmolytes are preferentially excluded from the surfaceTimasheff (2002); Parsegian et al. (2000); Bolen and Rose (2008); Courtenay et al. (2000); Canchi and García (2013) because of unfavorable interactions Bolen and Rose (2008); Canchi and García (2013). Therefore such behavior should be observed in both the local-bulk partition coefficient (Eq. 1) and the preferential binding coefficient (Eq. 2).
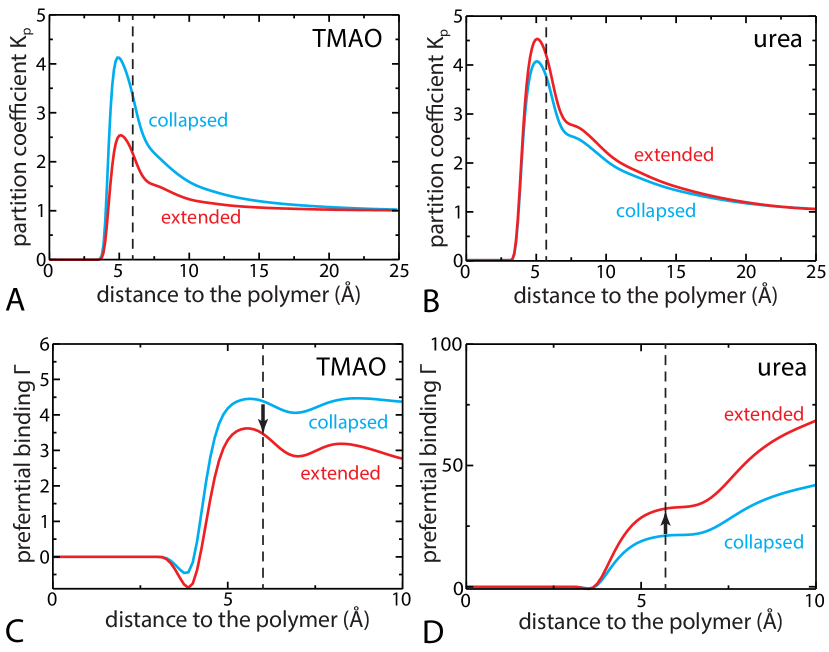
In Figure 4A-B we compare the dependence of on polymer conformation as a function of distance from polymer in both TMAO and urea solutions. If the local domain is defined as the polymer’s first solvation shell, then the representatives values for (and later ) should be taken near Å (dashed line), which corresponds to the the first minima of the radial distribution functions between the polymer and cosolvent molecules (urea or TMAO). As expected, urea molecules accumulate next to both collapsed and extended states of the polymer, leading to (Figure 4B). is little sensitive to the polymer conformation but it is always slightly higher in the extended state. The local-bulk partition coefficient of TMAO is also greater than 1 (Figure 4A), implying that TMAO also binds to the polymer surface. This result contradicts the popular view that protective osmolytes are believed to be preferentially excluded from the protein surfaceTimasheff (2002); Parsegian et al. (2000); Bolen and Rose (2008); Courtenay et al. (2000); Canchi and García (2013). However, this should not be surprising since TMAO is mostly hydrophobic and thus might be better accommodated in the polymer hydration shell than in bulk solution. But a key observation is that displays significant conformation-dependence: it is higher near a collapsed configuration than near an extended configuration. Therefore, TMAO strongly interacts with the polymer () but there is an effective depletion next to extended conformations of polymer relative to collapsed conformations.
Although the local-bulk partition coefficient provides a better description of the preferential interaction because of its intensive nature, it is not directly connected to experimental observables. In contrast, the preferential binding coefficient can be measured experimentally, e.g. using the vapor-pressure osmometry technique Courtenay et al. (2000). The effect of preferential binding on a conformational equilibrium between the folded and the unfolded configurations (with an equilibrium constant ) is usually understood in terms of the thermodynamic calculation first introduced by Wyman and Tanford Wyman (1964); Tanford (1969), which leads to
| (4) |
where is the activity of the cosolvent in the binary solution. According to Eq. 4, an increase in the concentration of the cosolvent would lead to the biomolecule unfolding if , and in contrast would favor the folded state over the unfolded one if .
In Figure 4C-D we show the average preferential binding coefficients for both collapsed and extended conformations in TMAO and urea solutions. As already discussed above, one should consider the values at the distance corresponding to the polymer first solvation shell. Not surprisingly, in all cases is positive, which is equivalent to (Figure 4A-B). Similarly, the trends in the difference between the extended and collapsed configurations follow that of : is negative for TMAO, which stabilizes the folded state over the unfolded one, while the positive for urea clearly corresponds to its denaturing effect. Our results are therefore in agreement with the current consensus on the osmolyte effectTimasheff (2002); Parsegian et al. (2000); Bolen and Rose (2008); Courtenay et al. (2000); Canchi and García (2013) summarized by Eq.4.
The main difference between our work and previous studies on proteins is that the sign of is different from that of for TMAO (they have the same sign for urea). This surprising observation can be understood if we consider the relationship between and . Indeed combining Eqs. 1 and 2 with the hypothesis that the bulk domain is large with respect to the local domain (i.e., ), leads to
| (5) |
Therefore will depend on both and (note that these two terms are not independent of each other). In experimental studies of proteins, it was found that is proportional to the solvent surface accessible area Courtenay et al. (2000). Since is also proportional to , is expected to be the same whether the protein is folded or not. This may not be surprising given that the nature of the exposed groups is the same in the folded and the unfolded state. However for our polymer, is very much conformation-dependent, while is only marginally higher in the extended state. This therefore provides an explanation for why is negative while TMAO always accumulates in the hydration shell (). Finally, it is interesting to note that simulations of decaalanine have found to be positive for TMAOKokubo et al. (2011) even though it was observed to behave as a protective osmolyte.
III.2.2 Conformation-dependence of the osmolyte chemical potentials in the polymer first solvation shell
To obtain a better understanding of how TMAO can preferentially bind to the polymer surface, yet still behave as a protective osmolyte favoring the polymer collapsed state, we investigate the free-energy changes (chemical potential) associated with the insertion of a single osmolyte or water molecule next to different conformations (both collapsed and extended) of the polymer. These chemical potentials were determined from thermodynamic integration (see Methods, Appendix and Figures 9 and 10). Insertion of a TMAO and a water molecule in the 1 M TMAO solution (or urea and water in the 7 M urea solution) was considered in three different cases: in the bulk, i.e. far from the polymer; in the first hydration shell of the polymer frozen in a collapsed configuration; and in the first hydration shell of polymer frozen in an extended configuration.
Table 1 lists the results of thermodynamic integration; namely, the van der Waals and electrostatic contributions to the chemical potentials of urea and TMAO in the different cases. In all cases insertion of a osmolyte molecule is more favorable next to the polymer than it is in the bulk: this is in agreement with the preferential binding values discussed above. However, the chemical potentials of TMAO and urea, relative to bulk values follow opposite trends as far as the conformation-dependence is concerned. An inserted single TMAO molecule is more stable (has lower free energy) next to the collapsed conformation of polymer than next to the extended. Its free-energy is lower by 0.8 kcal/mol per TMAO molecule. This is mainly due to the more favorable free energy contribution from the van der Waals interaction, which overcomes the slight destabilization in the electrostatic contribution in the collapsed conformation due to less exposure to water or other TMAO molecules in the collapsed state than in the extended state. Given the importance of the van der Waals term for this (mostly) hydrophobic molecule, the total free-energy change is dominated by this contribution. In urea, however, the van der Waals term is small and does not totally compensate the electrostatic contribution. Therefore the insertion of a urea molecule is more favorable next to the extended state.
| System | |||||
|---|---|---|---|---|---|
| TMAO | |||||
| bulk | +1.99(0.02) | –13.97(0.02) | –11.97(0.01) | 0 | – |
| collapsed | –0.52(0.36) | –13.08(0.22) | –13.60(0.27) | –1.63 | 6.2(0.2) |
| extended | +1.04(0.45) | –13.80(0.08) | –12.76(0.38) | –0.79 | 6.3(0.6) |
| urea | |||||
| bulk | –0.17(0.04) | –13.27(0.05) | –13.44(0.09) | 0 | – |
| collapsed | –1.33(0.71) | –12.45(0.53) | —13.78(0.20) | –0.33 | 28.6(0.3) |
| extended | –0.99(0.29) | –12.91(0.23) | –13.90(0.15) | –0.46 | 41.9(0.8) |
The observed differences and respective contributions of van der Waals and electrostatic free-energy, which drive the preferential interaction with one state or another, suggest a mostly enthalpic origin to this behavior. This is confirmed by considering the distributions of both van der Waals and electrostatic energy distributions for single osmolyte molecule in the hydration shell of the polymer, either in a collapsed or in an extended conformation (see Appendix and Table III). The observed trends are similar to that found from the FEP study — TMAO interacts preferentially with the polymer collapsed state because of the van der Waals contribution, leading to a difference of 0.2 kcal/mol as compared to the extended state and 0.5 kcal/mol with respect to the bulk phase. In contrast, a slight stabilization of urea in the extended polymer hydration shell with respect to the collapsed state is found ( 0.2 kcal/mol) and appears to be driven by the electrostatic contribution. In both cases, a significant stabilization is found as compared to the bulk phase ( 1.5 kcal/mol).
III.2.3 A free-energy based model for action of protecting and denaturing osmolyte
The discussion in the previous paragraphs have focussed on only the contributions of the chemical potential of osmolyte (TMAO or urea) to the free-energy difference between the polymer collapsed and the extended states. We now try to build a free energy-based thermodynamic model based on the above FEP data, with the goal of validating it against the net PMF profiles of the polymer in the respective solutions (as previously discussed in Figure 3). The net free-energy change for going from a collapsed to an extended configuration can be expressed as
| (6) | |||||
where (respectively ) is the average number of solvent molecules of type (water or osmolyte ) in the first hydration shell of the polymer in a collapsed (respect. extended) configuration, and (respect. ) their associated chemical potentials. We assume here that the chemical potentials of molecules beyond the first hydration shell are similar for both polymer configurations.
To evaluate Eq. 6, we must separately determine three individual contributions:
(a) The first term of the equation corresponds to the free-energy difference between the collapsed and extended states of the polymer itself in gas phase. It was obtained by repeating our simulations in the gas phase and by performing umbrella sampling calculations to estimate the free-energy difference between the collapsed and the extended state in the absence of solvent, which was found to be kcal/mol in favor of the collapsed conformation.
(b) To calculate the second term, which describes water’s contribution to the total free energy difference, we repeated our FEP calculations for water as well using the same method as detailed above for the osmolyte molecules. Results are reported in Table 2. In all cases (bulk, TMAO or urea solutions), the difference in chemical potential between inserting a water molecule next to the collapsed or next to the extended state is very small, and slightly negative with respect to bulk. At the same time, the hydration number is significantly increasing because of a larger surface area in the extended state. Both the changes in chemical potential and that of the number of molecules contribute to the total free-energy difference between the collapsed and the extended state due to water molecules. A detailed analysis discussed in the Appendix and Table 4 shows that in all cases, the dominant contributions logically arise from .
| System | |||
|---|---|---|---|
| pure water | |||
| collapsed | –0.17(0.04) | 73.8 | |
| extended | –0.15(0.02) | 111.3 | |
| TMAO | |||
| collapsed | –0.08(0.05) | 66.9 | |
| extended | –0.11(0.04) | 106.6 | |
| urea | |||
| collapsed | –0.13(0.14) | 33.0 | |
| extended | –0.17(0.31) | 43.5 |
(c) The third term describes contribution of osmolyte molecules (TMAO or urea) to the net free energy difference. The chemical potentials in each configuration were already discussed and are given in Table 1, which also contains the total number of osmolyte molecules in the polymer first hydration shell. Similarly to water, we can define and . For urea, both the and bring a negative contribution to the solvent-induced free-energy difference, which therefore favors the extended state. For TMAO, the two terms bring opposite contributions (Appendix and Table 4). While favors the extended conformation, it is the dominant contribution of the large that leads to a positive , stabilizing the collapsed state relative to the extended one.
Figure 5 represents these three different individual contributions schematically. In pure water, the water contribution favors the extended state, as shown above. However, it does not totally compensate the polymer contribution (this will depend on the value of ), so that the folded state is still the most stable in this case, as calculated independently with our umbrella sampling simulations (Figure 3). In the TMAO solution, the water contribution is only slightly perturbed with respect to the pure water case, but TMAO molecules will bring a contribution favoring the collapsed state, in agreement with our earlier estimation based on PMF calculations (Figure 3). Finally in the urea solution, the urea contribution stabilizes the extended conformation greatly so that the overall free-energy difference becomes favorable towards extended conformations, as we have observed.
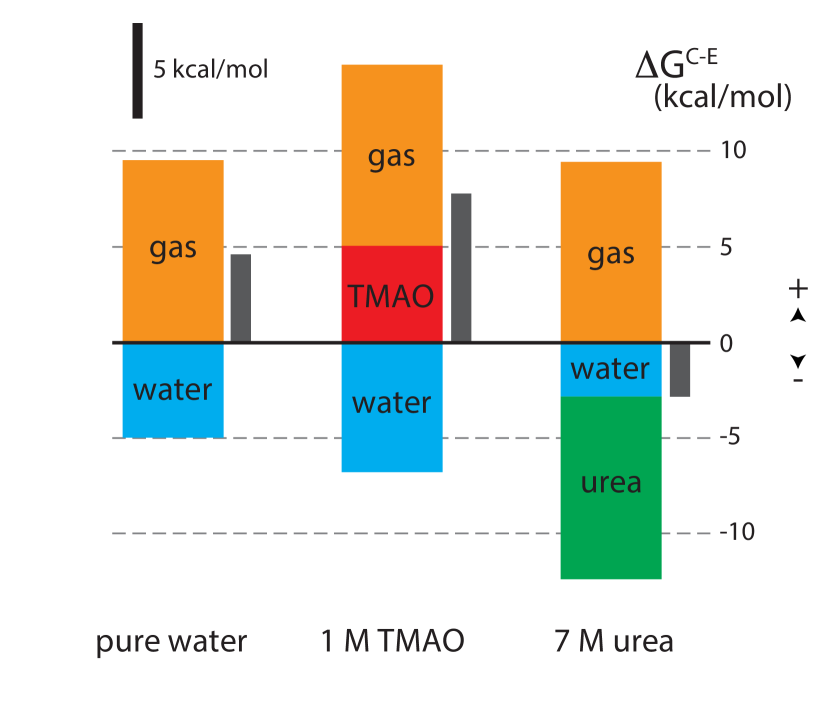
The semi-quantitative agreement that is observed in all three cases with the free-energy differences calculated from umbrella sampling simulations further validates the current approach. Note however that for TMAO and urea solutions, we systematically overestimate the respective stabilization. A possible explanation for this discrepancy is that we consider only a few sites for insertion of a osmolyte or a water molecule in the hydration shell. However, the fact that the trend is correctly and self-consistently predicted and also that the energy distributions exhibit exactly the same behavior makes us confident in this approach. Finally, the decomposition presented in the Appendix in terms of the respective contributions of and also suggests that an osmolyte’s behavior cannot be predicted from the sign of alone, as detailed in the Appendix.111Indeed the main contribution (which is equal to ) can overcome that of if the relative variations of the hydration number when going from collapsed to extended conformations are larger than that of the associated chemical potentials, even if the osmolyte molecules are more stable around the collapsed conformations.
IV Conclusions
In this paper, we considered the effect of osmolytes (TMAO and urea) on a simple polymer, consisting of a short Lennard-Jones chain similar to an alkane or lipid chain in aqueous solutions of the two osmolytes. This model is reminiscent of the model used in our previous paperZangi et al. (2009) directed at understanding urea denaturation of hydrophobic collapse.
Here we determined the free energy landscapes of the hydrophobic polymer as a function of its radius of gyration. We show that 1 M TMAO and 7 M urea act dramatically differently on model polymer chains and their behaviors are sensitive to the strength of the attractive dispersion interactions of the chain with its environment: when these dispersion interactions are high enough, TMAO suppresses the formation of extended conformations of the hydrophobic polymer as compared to water, while urea promotes formation of extended conformations. Quite surprisingly, we find that both protecting and denaturing osmolytes strongly interact with the polymer (with both having a preferential binding constant greater than zero), in contrast with existing explanations of the osmolyte effect. An extensive free energy analysis suggests that protective osmolytes are not necessarily excluded from the polymer surface. What really matters is the effective depletion of the osmolyte as the polymer conformation changes, in agreement with the current consensus on the osmolyte effectTimasheff (2002); Parsegian et al. (2000); Bolen and Rose (2008); Courtenay et al. (2000); Canchi and García (2013). Indeed for TMAO, it is the much more favorable free energy of insertion of a single osmolyte near the collapsed configurations of the polymer than near the extended configurations that dictates its propensity to drive the system towards the collapsed conformation, and therefore to lead to its protective effect. This appears to be driven by van der Waals interactions. In contrast, urea is preferentially stabilized next to the extended conformation because the smaller van der Waals contributions do not compensate the electrostatic contribution, suggesting this as an explanation of its denaturing effect.
A thermodynamic model taking into account the different contributions (gas-phase, water and osmolyte) to the polymer conformational equilibrium was developed. In the aqueous solution of urea, the free energy contribution coming from urea and water easily cooperates to shift the polymer towards extended conformations of the polymer. In the aqueous solution of TMAO, TMAO’s free energy contribution favors the collapsed conformation and it is able to overcome the water’s free energy contribution which favors the extended conformation: overall, the equilibrium is shifted towards the collapsed conformation.
We believe that this simple thermodynamic model provides an interesting perspective for explaining the role of protecting and denaturing osmolytes on simple macromolecules. Although the model is very simple, it provides fresh insights on the action of various osmolytes. Manipulation of simple polymers at the single molecule level has been recently achievedLi and Walker (2011) and we believe that the effect of osmolytes such as urea or TMAO on the polymer conformational equilibrium could be probed by such techniques. From a simulation perspective, it will be interesting in the future to extend our free-energy based approach to systems of increasing complexity like charged polymers, real peptides or proteins to shed light on the role of osmolytes on macromolecular conformations.
V Acknowledgments
This work was supported by grants from the National Institutes of Health [NIH-GM4330 (to B.J.B.)] and by the National Science Foundation through [via Grant No. NSF-CHE-0910943]. We gratefully acknowledge the computational support of the Computational Center for Nanotechnology Innovations (CCNI) at Rensselaer Polytechnic Institute (RPI).This work used the Extreme Science and Engineering Discovery Environment (XSEDE), which is supported by National Science Foundation grant number OCI-1053575.
Appendix A Effect of the polymer bead parameter on the polymer conformational equilibrium
To investigate how variations of the polymer bead parameter affect its behavior in the various solutions we repeated our simulations using 3 other values of (0.4, 0.6 and 0.8 kJ/mol). Note that the lower the value of this energy parameter the more hydrophobic is the chain. Results are presented in Figure 6.
In pure water the unfolded state gets stabilized relative to the collapsed state as decreases (that is gets less positive) as decreases. When changing the parameter, there is a competition between two opposite effects: first, as decreases this will decrease the interaction between beads and water molecules, therebye increasing the hydrophobic character of the chain and driving the polymer towards toward collapsed configurations. However at the same time, the intramolecular interactions will decrease, which would favor more extended states. Our results suggest that this later contribution dominates. In 1 M TMAO solution we observe that the protective effect is very sensitive to variations in : indeed the protecting role evidenced above at 1 kJ/mol is moderate to almost nonexistent when the chain is really hydrophobic (low values of 0.4 and 0.6 kJ/mol), in agreement with a previous studyAthawale et al. (2005): the osmolyte effect becomes more prominent only for 0.8 and 1.0 kJ/mol. In strong contrast with TMAO and in agreement with a previous studyZangi et al. (2009), urea still readily denatures hydrophobic polymers at small kJ/mol) yet its denaturing effect becomes more prominent as increases.
Appendix B Effect of a different forcefield for TMAO on the free energy profile
The force-field we have employed throughout our entire study for TMAO (known as ’Kast model’)Kast et al. (2003) has also been recently modified by Garcia and coworkers Canchi et al. (2012) and a new forcefield, termed the ’osmotic model’ has also been proposed by them. We repeated our umbrella sampling simulations for free energy profile at 1 M using this modified version of this force-field. As shown in the Figure 7, its effect on the polymer chain is similar to that obtained from the original ’Kast model’ of TMAO .
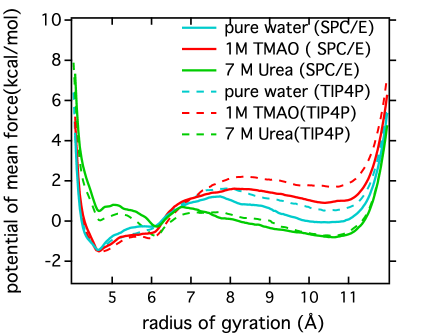
Appendix C Effect of a different water model on the free energy profile
All the results reported in the main article were obtained using the SPC/E water modelBerendsen et al. (1987). However, for the purpose of testing the robustness of our results with respect to the different water models, we have repeated our computation of free energy profiles using a different water model, namely TIP4P waterJorgensen et al. (1983), mainly because it was used in our previous work on ureaZangi et al. (2009). Figure 8 compares the effect of the two different water models on the free energy profiles of the polymeric chain ( kJ/mol) in different osmolyte solutions. The common trend prevalent in all free energy profiles corresponding to TIP4P water model is that the free energy barrier for the transformation from the compact to the extended state in pure water and in 1 M TMAO are respectively higher for TIP4P water then for SPC/E water. For 7 M urea , the extent of free energy of stabilization is negligibly more favorable in SPC/E water than in TIP4P water. But, interestingly, the relative free energy difference of the chain in going from pure water to 1 M TMAO solution or 7 M urea solution is almost the same for both SPC/E and TIP4P water models.
Appendix D Thermodynamic integration
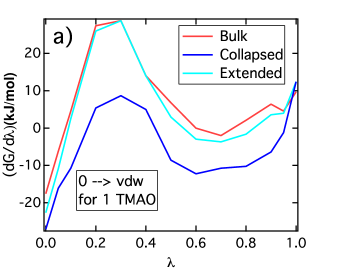
As detailed in the Methods section, we performed free-energy perturbation calculations to estimate the cost of inserting water or cosolvent molecules at different positions in the polymer hydration shell, or in the bulk. The interactions of the molecule being inserted were slowly turned on in two stages: in the first stage only the van der Waals interactions were turned on, and in the second stage the electrostatic interactions were turned on. Thermodynamic integration thus yields two contributions to the transfer free energy. In Figure 9, we present results of thermodynamic integration for the two stages and compare insertion of a single TMAO at a given position in the bulk, in the hydration shell of the polymer in a collapsed configuration, and in the hydration shell of the polymer in an extended configuration. The thermodynamic data confirms that van der Walls contribution to the free energy of inserting a single TMAO is more favorable near a collapsed conformation than near an extended conformation, and it more than compensates the favorable electrostatic contribution near an extended conformation than that near the collapsed conformation. In Figure 10, we present the same data for inserting a single urea molecule in the urea solution, where the reverse trend is observed: the more favorable electrostatic contribution to the free energy of inserting a single urea near the extended conformation overcomes the favorable van der Waals contribution to free energy of inserting a single urea near the collapsed conformation.
Appendix E Energy distribution in the polymer first hydration shell
Table III provides details on the respective net average energies and the individual van der Waals and electrostatic contributions to these energies for a single cosolute molecules (TMAO and urea). The observed trends in the average energy analysis are consistent with that found from the FEP study — TMAO interacts preferentially with the polymer collapsed state because of the favorable LJ contribution. In contrast, a slight stabilization of urea in the extended polymer hydration shell with respect to the collapsed state is found to be driven by the electrostatic contribution.
| System | ||||
|---|---|---|---|---|
| TMAO | ||||
| bulk | –3.824(2.22) | –29.510(4.71) | –33.334(3.82) | 0 |
| collapsed | –5.853(2.62) | –27.985(4.90) | –33.838(3.93) | –0.504 |
| extended | –5.404(2.41) | –28.231(4.83) | –33.635(3.89) | –0.301 |
| urea | ||||
| bulk | –5.079(2.55) | –28.234(5.16) | –33.313(4.21) | 0 |
| collapsed | –8.451(2.54) | –26.329(4.90) | –34.780(3.98) | –1.467 |
| extended | –8.002(2.61) | –26.993(4.89) | –34.995(3.99) | –1.682 |
Appendix F Decomposition of the solvent contributions to polymer collapse
In the pure solvent as well as in a mixture of water and a cosolute (TMAO or urea), the contribution of the species to the free-energy difference between the collapsed and the extended state can be expressed as
| (7) |
where (respectively ) is the number of solvent molecules of type in the first hydration shell of the polymer in a collapsed (respect. extended) configuration, and (respect. ) their associated chemical potentials. We can define the relative changes for both quantities as and . Substituting and in Eq. 7 leads after simplification to
| (8) |
The first term on the right hand side of Eq. 8 represents the contribution of the change in chemical potential, for a fixed number of molecules in the hydration shell; the second term represents the contribution of the change in the hydration number for a fixed chemical potential. The last one is a second-order term, whose contribution is expected to be minor.
| Case | ||||
|---|---|---|---|---|
| TMAO | +5.2 | –0.2 | +0.10 | +5.1 |
| urea | -3.5 | –4.5 | –1.6 | -9.6 |
| water (bulk) | +0.8 | –6.2 | +0.4 | –5.0 |
| water (TMAO) | –2.4 | –3.1 | -1.4 | –6.9 |
| water (urea) | –1.1 | –1.4 | –0.4 | –2.9 |
The different free-energy contributions for each solvent type is given in Table 4. In all cases, the chemical potential of a water or cosolute (TMAO and urea) molecule in the hydration shell is lower than in bulk, so that is negative. This represents the main contribution to the free-energy difference induced by water (in all solutions) and urea, showing that the large change in the hydration number is responsible for the increased solvent-induced stability of the unfolded state over the collapsed one. The situation is markedly different for TMAO. The large change in when going from collapsed to extended is bringing a large contribution, which is positive and not totally compensated by the term (the term brings an additional positive contribution). Therefore the total free-energy difference is positive, in strong contrast with what is observed for urea and water.
The above decomposition also suggests that an osmolyte’s behavior cannot be predicted from the sign of alone. Indeed the main contribution (which is equal to ) can overcome that of if the following criteria are met: (i) the stabilization in the polymer hydration shell with respect to the bulk is large, but the variation between the collapsed and the extended state is small ( and ) ; (ii) the osmolyte can accumulate in the hydration shell, i.e. is largely positive. In other words, this situation can arise if the relative variations of the hydration number when going from collapsed to extended conformations are larger than that of the associated chemical potentials, even if the cosolute molecules are more stable around the collapsed conformations.
References
- Yancey et al. (1982) P. H. Yancey, M. E. Clark, S. C. Hand, R. D. Bowlus, and G. N. Somero, Science 217, 1214 (1982).
- Wyman (1964) J. Wyman, Adv. Protein Chem. 19, 223 (1964).
- Tanford (1969) C. Tanford, J. Mol. Biol. 39, 539 (1969).
- Timasheff (2002) S. N. Timasheff, Proc. Natl. Acad. Sci. USA 99, 9721 (2002).
- Parsegian et al. (2000) V. A. Parsegian, R. P. Rand, and D. C. Rau, Proc. Natl. Acad. Sci. USA 97, 3987 (2000).
- Bolen and Rose (2008) D. Bolen and G. Rose, Annu. Rev. Biochem. 77, 339 (2008).
- Courtenay et al. (2000) E. S. Courtenay, M. W. Capp, C. F. Anderson, and M. T. Record, Jr, Biochemistry 39, 4455 (2000).
- Canchi and García (2013) D. R. Canchi and A. E. García, Annu. Rev. Phys. Chem. 64, 273 (2013).
- Street et al. (2006) T. O. Street, D. W. Bolen, and G. D. Rose, Proc. Natl. Acad. Sci. USA 103, 13997 (2006).
- Wang and Bolen (1997) A. J. Wang and D. W. Bolen, Biochemistry 36, 9101 (1997).
- Lin and Timasheff (1994) T. Y. Lin and S. N. Timasheff, Biochemistry 33, 12695 (1994).
- Tatzelt et al. (1996) J. Tatzelt, S. Prusiner, and W. Welch, EMBO J. 15, 6363 (1996).
- Nandi et al. (2006) P. K. Nandi, A. Bera, and P.-Y. Sizaret, J. Mol. Biol. 362, 810 (2006).
- Tseng and Graves (1998) H. C. Tseng and D. J. Graves, Biochem. Biophys. Res. Comm. 250, 726 (1998).
- Scaramozzino et al. (2006) F. Scaramozzino, D. W. Peterson, P. Farmer, J. T. Gerig, D. J. Graves, and J. Lew, Biochemistry 45, 3684 (2006).
- Uversky et al. (2001) V. N. Uversky, J. Li, and A. L. Fink, FEBS Lett. 509, 31 (2001).
- Morello et al. (2000) J. P. Morello, U. E. Petaja-Repo, D. G. Bichet, and M. Bouvier, Trends Pharmacol. Sci. 21, 466 (2000).
- Tang et al. (2013) W. H. W. Tang, Z. Wang, B. S. Levison, R. A. Koeth, E. B. Britt, X. Fu, Y. Wu, and S. L. Hazen, N. Engl. J. Med. 368, 1575 (2013).
- Bennion and Daggett (2004) B. J. Bennion and V. Daggett, Proc. Natl. Acad. Sci. USA 101, 6433 (2004).
- Sharp et al. (2001) K. A. Sharp, B. Madan, E. Manas, and J. M. Vanderkooi, J. Chem. Phys. 114, 1791 (2001).
- Hunger et al. (2012) J. Hunger, K.-J. Tielrooij, R. Buchner, M. Bonn, and H. J. Bakker, J. Phys. Chem. B 116, 4783 (2012).
- Athawale et al. (2005) M. V. Athawale, J. S. Dordick, and S. Garde, Biophys. J. 89, 858 (2005).
- Cho et al. (2011) S. S. Cho, G. Reddy, J. E. Straub, and D. Thirumalai, J. Phys. Chem. B 115, 13401 (2011).
- Hu et al. (2010) C. Y. Hu, G. C. Lynch, H. Kokubo, and B. M. Pettitt, Proteins 78, 695 (2010).
- Stirnemann et al. (2010) G. Stirnemann, J. T. Hynes, and D. Laage, J. Phys. Chem. B 114, 3052 (2010).
- Canchi et al. (2012) D. R. Canchi, P. Jayasimha, D. C. Rau, G. I. Makhatadze, and A. E. Garcia, J. Phys. Chem. B 116, 12095 (2012).
- Paul and Patey (2007) S. Paul and G. N. Patey, J. Phys. Chem. B 111, 7932 (2007).
- Kokubo et al. (2011) H. Kokubo, C. Hu, and B. M. Pettitt, J. Am. Chem. Soc. 133, 1849 (2011).
- Zangi et al. (2009) R. Zangi, R. Zhou, and B. J. Berne, J. Am. Chem. Soc. 131, 1535 (2009).
- Berendsen et al. (1987) H. J. C. Berendsen, J. R. Grigera, and T. P. Straatsma, J. Phys. Chem. 91, 6269 (1987).
- Duffy et al. (1993) E. M. Duffy, D. Severance, and W. L. Jorgensen, lsr. J. Chem. 33, 323 (1993).
- Kast et al. (2003) K. M. Kast, J. Brickman, S. M. Kast, and R. S. Berry, J. Phys. Chem. A 107, 5342 (2003).
- Hess et al. (2008) B. Hess, C. Kutzner, D. Van der Spoel, and E. Lindahl, J. Chem. Theory Comput. 4, 435 (2008).
- Bonomi et al. (2009) M. Bonomi, D. Branduardi, G. Bussi, C. Camilloni, and M. Parrinello, Comp. Phys. Comm. 180, 1961 (2009).
- Kumar et al. (1992) S. Kumar, D. Bouzida, R. H. Swendsen, P. A. Kollman, and J. M. Rosenberg, J. Comput. Chem. 13, 1011 (1992).
- (36) A.Grossfield, “Wham: the weighted histogram analysis method, version 2.0,” http://membrane.urmc.rochester.edu/content/wham.
- Shukla et al. (2009) D. Shukla, C. Shinde, and B. L. Trout, J. Phys. Chem. B 113, 12546 (2009).
- Jorgensen et al. (1983) W. Jorgensen, J. Chandrasekhar, J. Madura, R. Impey, and M. Klein, J.Chem.Phys. 79, 926 (1983).
- Note (1) Indeed the main contribution (which is equal to ) can overcome that of if the relative variations of the hydration number when going from collapsed to extended conformations are larger than that of the associated chemical potentials, even if the osmolyte molecules are more stable around the collapsed conformations.
- Li and Walker (2011) I. T. S. Li and G. C. Walker, Proc. Natl. Acad. Sci. USA 108, 16527 (2011).