Metals in the IGM approaching the re-ionization epoch: results from X-shooter at the VLT††thanks: Based on observations collected at the European Southern Observatory Very Large Telescope, Cerro Paranal, Chile – Programs 069.A-0529, 079.A-0226, 084.A-0390, 084.A-0550, 085.A-0299, 086.A-0162, 087.A-0607 and 268.A-5767
Abstract
We present the results of observations taken with the X-shooter spectrograph devoted to the study of quasars at . This paper focuses on the properties of metals at high redshift traced, in particular, by the C iv doublet absorption systems. Six objects were observed with resolutions and 34 km s-1 in the visual, and 37.5 and 53.5 km s-1 in the near-infrared. We detected 102 C iv lines in the range: of which 27 are above . Thanks to the characteristics of resolution and spectral coverage of X-shooter, we could also detect 25 Si iv doublets associated with the C iv at . The column density distribution function of the C iv line sample is observed to evolve in redshift for , with respect to the normalization defined by low redshift () C iv lines. This behaviour is reflected in the redshift evolution of the C iv cosmic mass density, , of lines with column density in the range C iv, which is consistent with a drop of a factor of for . Considering only the stronger C iv lines (C iv), gently rises by a factor of between and with a possible flattening towards . The increase is well fitted by a power law: . An insight into the properties of the C iv absorbers and their evolution with redshift is obtained by comparing the observed column densities of associated C iv, Si iv and C ii absorptions with the output of a set of CLOUDY photo-ionization models. As already claimed by cosmological simulations, we find that C iv is a good tracer of the metallicity in the low density intergalactic medium gas at while at it arises in gas with over-density .
keywords:
galaxies: abundances - intergalactic medium - quasars: absorption lines - cosmology: observations1 Introduction
The properties of stars, galaxies and quasars in the local and early Universe can be investigated through their impact on the intergalactic medium (IGM). In particular, the radiation emitted and the metals ejected from these objects re-ionized and polluted the IGM. As a consequence, the detailed understanding of these mechanisms has the potential to significantly constrain models for the formation and evolution of galaxies and quasars, and the re-ionization history of the Universe. The IGM is mainly studied through the absorption signature it leaves in the spectra of bright high-redshift sources, quasars and gamma-ray bursts. The highest redshift quasars have been detected mainly by the Sloan Digital Sky Survey (SDSS) at (e.g. Fan et al., 2001), corresponding to billion years after the big bang. This sample of objects has been used to investigate several topics, in particular the ionization and chemical status of the IGM at these high redshifts (see Fan, Carilli, Keating, 2006, for a review).
The same high- quasars can be used to put an indirect constraint on the epoch of re-ionization by investigating the redshift evolution of metal abundances traced by ionic absorption lines. The investigation of the regime beyond is essential since in this redshift range the comoving star formation rate density appears to decline with redshift (e.g. Mannucci et al., 2007; Gonzàlez et al., 2010). If a similar behaviour is observed for the mass density of metals in the IGM, then a scenario where winds from in situ star-forming galaxies pollute the IGM with metals would be favoured. On the other hand, if the mass density of metals is observed to remain constant, this would point to an epoch of very early enrichment of the IGM, presumably by massive stars (e.g. PopIII stars) in mini-haloes (M M⊙; e.g. Choudhury et al., 2008), when shallow potential wells allow winds to distribute metals over large comoving volumes, thus producing a quite uniform metallicity distribution (e.g. Madau et al., 2001). These same massive stars could have been the main sources of ionizing photons allowing for an earlier reionization epoch.
Recent estimates of the evolution with redshift of the C iv cosmic mass density (see definition in Section 5.2, D’Odorico et al., 2010; Cooksey et al., 2012) show a decrease of the C iv content from redshift to 3, and then a flat behaviour in the range and a possible downturn at . Searching for intergalactic C iv absorption lines at becomes challenging because the C iv doublet moves into the near-infrared spectral region, absorption line spectroscopy is much more difficult in this regime because of increased detector noise, OH emission from the sky and more severe telluric absorption.
The first results at were based on low/intermediate resolution QSO spectra and a few detections of C iv absorptions indicating a possible decrease of the value of (Ryan-Weber et al., 2009) and a significant decline of the C iv column density distribution function (CDDF; Becker et al., 2009). In a recent work, Simcoe et al. (2011, hereafter Simcoe11) claim the presence of a downturn in the C iv abundance at by a factor of 4.1 relative to its value at . The result is based on the spectra (at resolution km s-1) of seven quasars obtained with the new spectrograph FIRE (Simcoe et al., 2010) at the Magellan telescope, coupled with six observations of northern objects taken from the literature, of which four (see Ryan-Weber et al., 2009) have three times lower resolution and lower signal-to-noise ratio than the FIRE sample. The northern sample shows only one C iv absorption system, while almost doubling the surveyed redshift path, the effect is a decrease of the value of , which however could be due to the lower quality of those spectra.
In this work, we present the spectra obtained in a guaranteed time observation (GTO) programme (PI: V. D’Odorico) carried out with the X-shooter spectrograph at the European Southern Observatory (ESO) Very Large Telescope (VLT) between 2010 January and 2011 June. The scientific aim of this project was to observe the brightest (J) quasars known with and observable from Paranal to derive constraints both on the abundance of neutral hydrogen and on the abundance of metals at high redshift. Here the results on the metal lines are reported, the H i abundance will be the topic of a forthcoming paper. The X-shooter spectrograph (Vernet et al., 2011), with its high sensitivity, extended spectral coverage (from 3000 Å to 2.5 m) and intermediate resolution, appeared to be the ideal instrument to allow significant steps forward in this research field. Seven objects satisfy the chosen selection criteria. However, only four of them were observed due to bad weather downtime. Luckily, two of the objects we could not observe are present in the ESO X-shooter archive and we have retrieved and analysed their spectra.
Preliminary results on a sample of three objects (J1306+0356, J0818+1722, J1509-1749) were reported in D’Odorico et al. (2011, hereafter Paper I). Here, we describe the whole sample and carry out a more detailed analysis.
| QSO | SNR @ | SNR @ | |||||||
|---|---|---|---|---|---|---|---|---|---|
| (s) | (s) | (9000 Å) | (10350 Å) | ||||||
| J0818+17221 | 6.002 | 18.54 | 85 | 24 | 6.646 | ||||
| J0836+00542 | 5.810 | 17.9 | 8160 | 8400 | 65 | 10 | 6.371 | ||
| J1030+05242 | 6.308 | 18.87 | 26860 | 26000 | 125 | 7 | 7.091 | ||
| J1306+03562 | 6.016 | 18.77 | 55 | 12 | 6.666 | ||||
| J1319+09503 | 6.13 | 18.8 | 95 | 15 | 6.831 | ||||
| J1509-17494 | 6.118 | 18.78 | 50 | 8 | 6.814 |
(1) Fan et al. (2006); (2) Fan et al. (2001); (3) Mortlock et al. (2009); (4) Willott et al (2007)
The rest of the paper is organized as follows. Data reduction and analysis are presented in § 2. In § 3 the spectra of each object in the sample are described in details. § 4 is dedicated to the C iv lines statistics: CDDF and cosmic mass density. The results are discussed in § 6. Throughout this paper, we assume , and .
2 Observations and data reduction
The spectra were acquired with a binning of two pixels in the dispersion direction and adopting two sets of slit apertures for the blue, visual (VIS) and near-infra red (NIR) arms respectively: 1.0/0.9/0.9 and 0.8/0.7/0.6 arcsec depending on the seeing conditions at the moment of the observations. The journal of observations is reported in Table 1.
All the raw frames were reduced with the public release of the X-shooter pipeline (Goldoni et al, 2006). The pipeline reduction proceeds along the following steps. Pixels in the 2D frames are first mapped to wavelength space using calibration frames. Sky emission lines are subtracted before any re-sampling using the method developed by Kelson (2003). The different orders of the echelle spectrum are then extracted, rectified, wavelength calibrated and merged, with a weighted average used in the overlapping regions. The final product is a 1D, background-subtracted spectrum and the corresponding error file. The spectra are rebinned to 0.3 (narrow slit) or 0.4 Å (broad slit) in the VIS and to 0.6 Å in the NIR arm, following the prescription of the pipeline manual.
We followed the standard procedure with the exception of the extraction of the 1D spectrum from the 2D merged spectrum which was carried out with the EXTRACT/LONG command in MIDAS reduction package (using a predefined aperture). The extraction within MIDAS results in a better signal-to-noise ratio at least for those objects which are faint and whose spectrum is strongly absorbed in the Ly forest region. The instrument response curve was obtained reducing with the specific pipeline recipe the standard flux stars observed the same night of the scientific observations. Each extracted frame was then flux calibrated by dividing for the response curve. Finally, the set of 1D spectra obtained for each object was added with a weighted sum to obtain the final spectrum.
The continuum level in the region red-wards of the Ly emission was determined interpolating with a spline polynomial of third degree the portions of the spectrum free from absorption lines. The same approach cannot be applied to the heavily absorbed Ly forest. The continuum in this spectral range was obtained by extrapolating the power law which fits the red region cleaned from the intrinsic emission lines.
Finally, the VIS and NIR spectra were corrected for telluric absorption dividing by the normalized spectrum of standard spectroscopic stars observed with the same instrumental set-up as the quasars in our sample, using the command telluric in IRAF.
2.1 Identification of metal absorptions
Metal absorptions red-wards of the Ly emission have been identified mainly by eye. First, we looked for the most common ion doublets and multiplets (e.g. C iv, Mg ii, Fe ii and Si iv) and fitted them to confirm their nature and determine a precise redshift. Then, the lines without an identification were processed with automatic routines which try to associate those lines with the identified systems or with known ions on the basis of their wavelength ratios.
In the VIS region of the spectrum, the section inspected for metals extends from the observed wavelength of the Ly emission to Å, while in the NIR spectra it goes from this wavelength to m, with the known gaps due to atmospheric absorption. At m telluric lines are severely affecting the spectrum preventing the detection of other absorption lines. The redshift range of the C iv and Si iv forests reported in Table 1 goes from the Ly emission km s-1, to avoid blending with Ly lines, to the C iv and Si iv emission respectively km s-1, to avoid proximity effects.
The analysis of high resolution spectra (full width at half-maximum km s-1) shows that metal lines are characterized by Doppler velocity widths of the order of km s-1 (e.g. Tescari et al., 2011), which are not resolved in the X-shooter spectra. In spite of this, we have fitted the detected metal lines (in particular, C iv and Si iv) with Voigt profiles using the context LYMAN of the MIDAS reduction package (Fontana & Ballester, 1995). None of the fitted doublets shows saturation (the strength ratio in the doublet would not be preserved in that case), so we are confident that we are not underestimating their true column densities.
For comparison with previous works, we have also computed the rest frame equivalent widths, , of C iv and Si iv doublets by direct summation of the continuum-normalized flux of the spectral pixels. The errors on were computed as the square root of the quadratic sum of the flux standard deviations. The sums have been performed over the velocity range extending between the two pixels at which the normalized profile returned to unity. In the case of blending with other transitions, we report either a lower or an upper limit to the equivalent width depending on whether only part of the line profile is blended with a nearby absorption or the considered line falls within other strong absorptions (e.g. telluric line). In the case of complex velocity profiles if components are blended, we measured the total equivalent width. Tables 4-9 report the equivalent width and the measured column density of all the C iv and Si iv lines detected in our spectra.
The level of completeness of our sample was computed by generating a set of mock C iv absorption doublets with column densities in the range and random redshifts in the interval covered by the observed spectra.Doppler parameters were derived randomly from a list of measured Doppler parameters for the X-shooter observed C iv sample. The correct velocity profiles for the lines were obtained with the procedure COMPUTE/LYMAN in MIDAS, and the lines were then superposed to the observed spectra and detected by eye. Our X-shooter spectra result to be complete to almost 100 per cent for C iv doublets with N(CIV) for the whole inspected redshift range. Considering the redshift range , the sample is complete to above 95 per cent for N(CIV) and 13.4, and at 85 per cent for N(CIV). Above , the completeness decreases significantly with C iv lines with column density in log equal to 13.5 detected 85 per cent of the time, 13.4 detected 70 per cent of the time and 13.3 in 60 per cent of the cases.
3 Notes on individual objects
In this section, all the objects in the sample are briefly introduced. We report also on the objects already described in Paper I, since some variations occurred with the improvement of the reduction pipeline and the optimisation of our procedure.
In the following, all the reported signal to noise ratios (SNR) are per resolution element. The resolution in the VIS arm is and 11000 for the 0.9 and 0.7 arcsec slits, respectively; while in the NIR arm it is and 8000 for the 0.9 and 0.6 arcsec slits. The redshift of absorption systems is reported with the number of significant digits (in general four or five), in the case of systems with a complex velocity structure the average redshift is reported with three decimal digits.
3.1 SDSS J0818+1722
This object, which has the best SNR in our sample, was already discussed in Paper I.
The VIS portion of the spectrum outside the Ly forest is the richest in absorption lines; having a large SNR () we could subtract quite well the telluric features revealing the presence of many absorption systems. In the NIR portion of the spectrum, the SNR lower to in the band, to increase again to in the and bands.

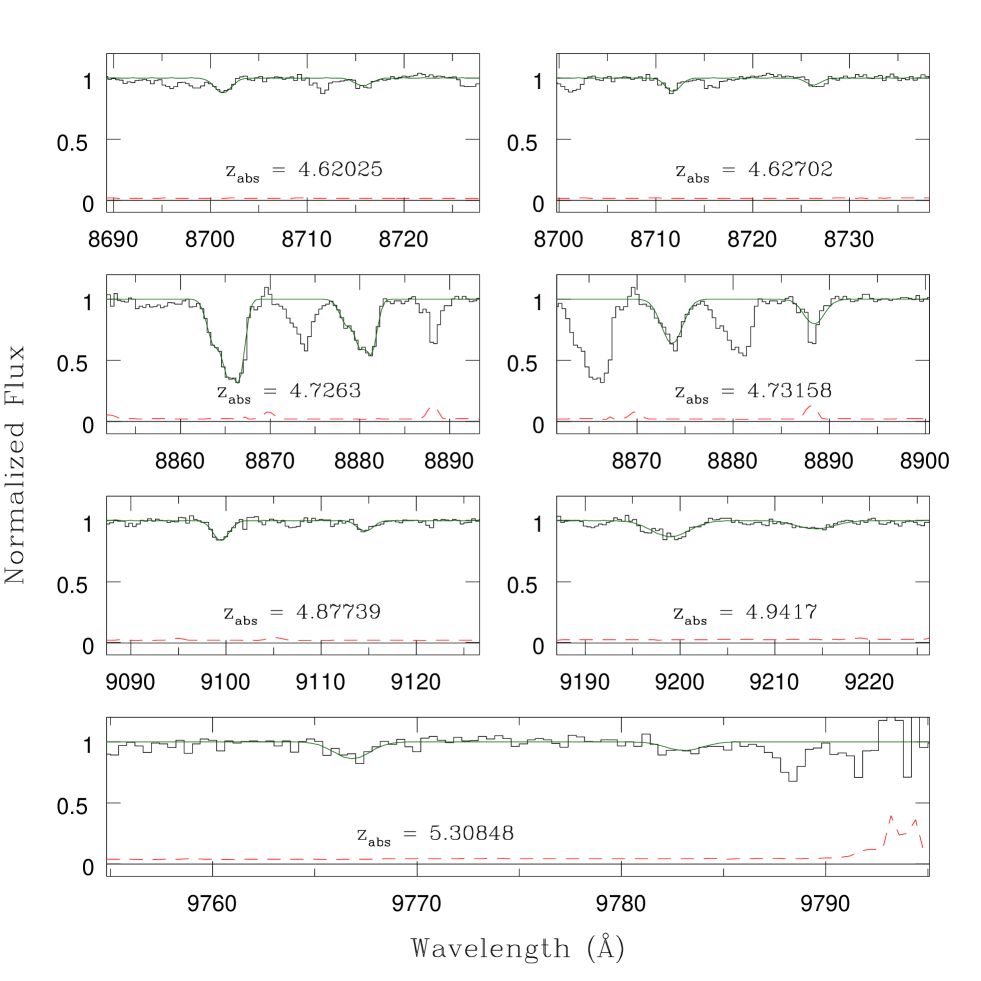
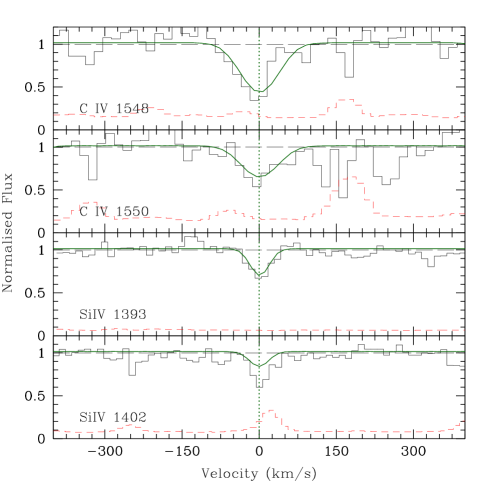
We detected C iv doublets at , 4.49800, 4.50838, 4.52305, 4.62025, 4.62702, 4.7263 (complex, detected also by Simcoe11), 4.73158, 4.87739, and 4.9417, together with marginal detections (below our limit) at , 4.57733. Those absorption systems are shown in Figs 1 and 2. The Å C iv line at , reported in Simcoe11, was identified as the Si iv 1393 Å transition associated with the C iv system at (see below).
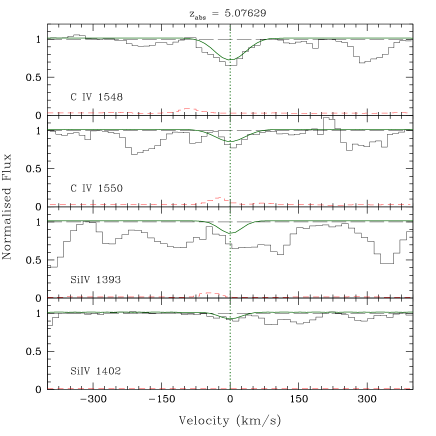
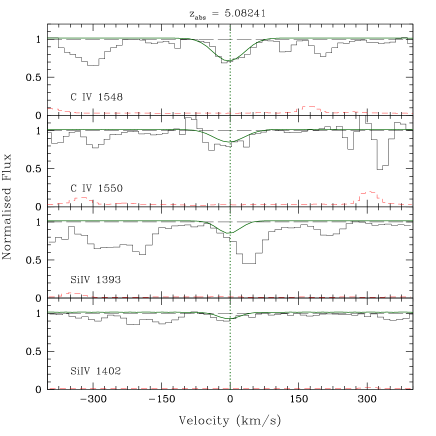
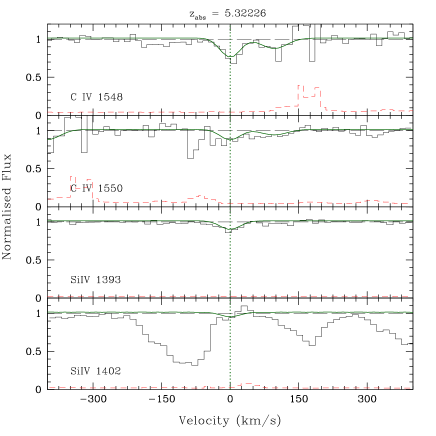
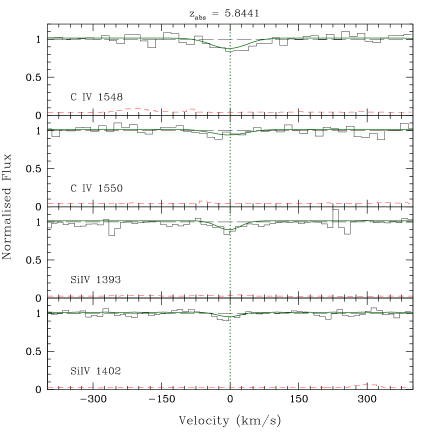
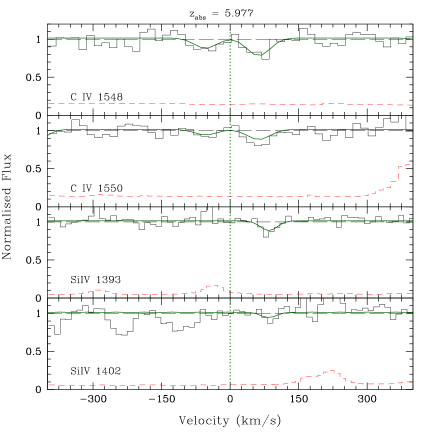
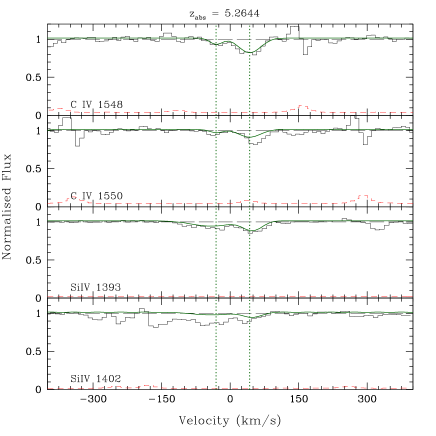
At , possible C iv doublets with associated Si iv lines were detected at , 5.07630, 5.08238, 5.32226 and 5.8441, with a marginal detection without Si iv at . Those C iv systems are shown in Figs 3 and 4.
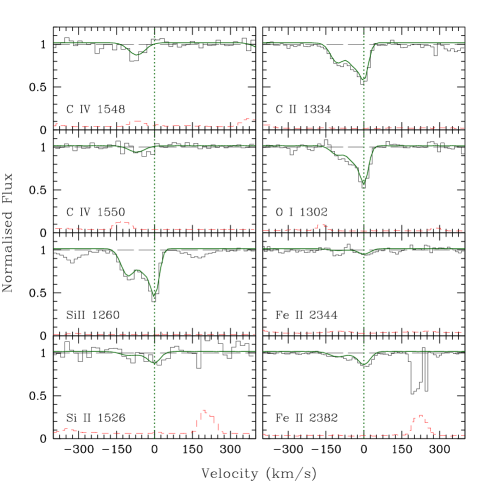
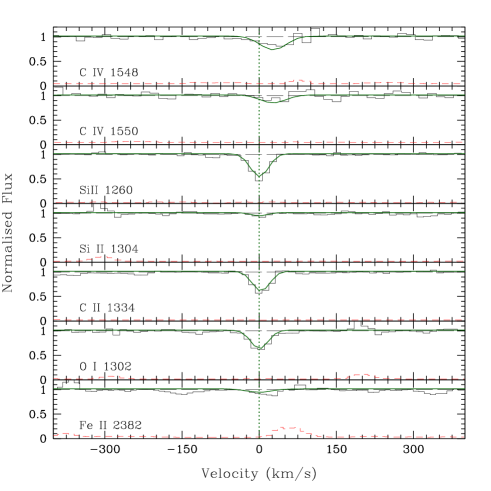
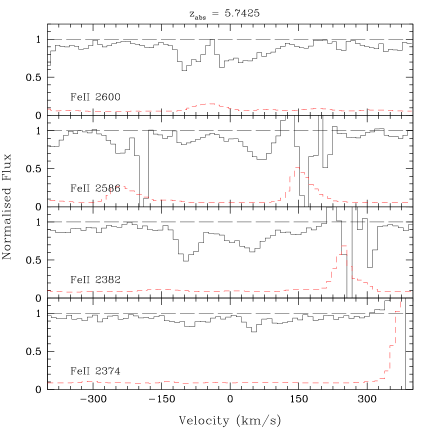
The spectrum of J0818+1722 is characterized by the presence of the only systems at low-ionization above detected in our sample, at , 5.791 and 5.87644. For the system at (see Fig. 3) it was possible to put an upper limit to the column density of Zn ii Zn ii, implying a ratio [Zn/Fe] . The latter two systems show also absorption due to O i (see Figs 5 and 6; for all the detected transitions) they were discussed in the work by Becker et al. (2011). The presence of the C iv doublet associated with the system at was reported by Ryan-Weber et al. (2009), however both lines fall on skylines (see Fig. 5) and in our spectrum they are below detection. Also the C iv at is very uncertain (see Fig. 6).
3.2 SDSS J0836+0054
This quasar, discovered in the SDSS (Fan et al., 2001), has the lowest redshift, , and is the brightest of the sample.
In the past, it was studied with the Keck both at low and high resolution with ESI, Hires and NIRSPEC (Pettini et al., 2003; Becker et al., 2006, 2009), with GNIRS@Gemini (Jiang et al., 2007) and with ISAAC@VLT (Ryan-Weber et al., 2009). Due to very good seeing conditions during the observations, we could observe this object at a higher resolution than the others in the sample: and 8000 in the VIS and NIR arm, respectively. The X-shooter spectrum has an SNR in the range Å, decreasing to in the band and increasing again to SNR in the and bands.
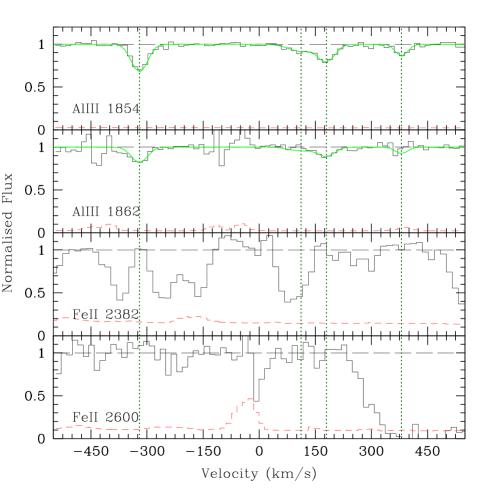
We identify a previously unknown Mg ii system at with associated Fe ii 2600 and 2586 Å, and we confirm the Mg ii system reported by Jiang et al. (2007) at detecting also the associated Al iii doublet and Fe ii 2600 and 2382 Å features. Those absorption systems are plotted in Fig. 27 (Appendix B).
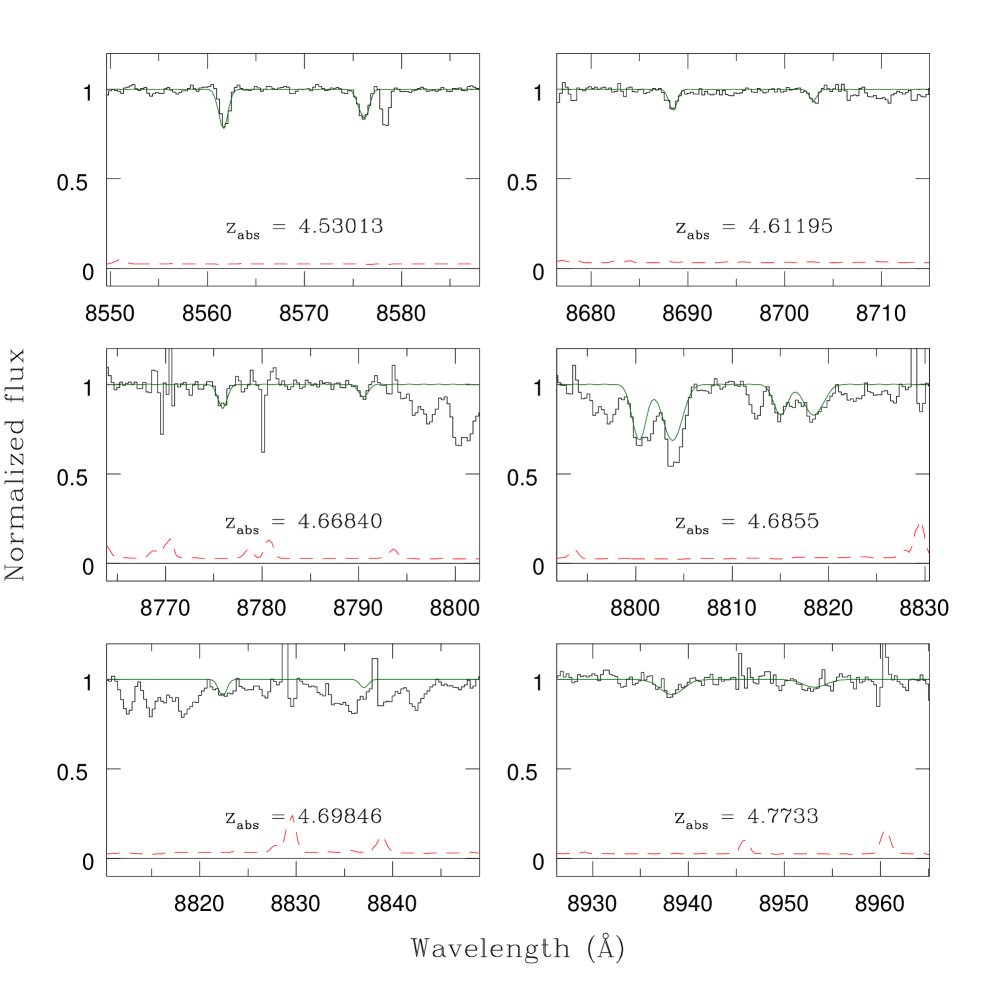
As for the C iv doublets, a new entry with respect to Pettini et al. (2003, from now on Pettini03) is found at . We also improved the fit of the system at and 4.68651 deblending the C iv lines from the Al iii doublet at . More C iv detections are present at , 4.66840, 4.69846, and 4.7733. All those C iv systems are shown in Fig. 7. The system in Pettini03 at is not confirmed in our spectrum, the line identified as C iv 1548 Å is in fact Si iv 1393 Å at (see below) and the C iv 1550 Å line is probably an artefact of a badly subtracted sky line.
The complex system at detected by both Pettini03 and Simcoe11 is confirmed by our data. In our spectrum, we detect also the associated Si iv doublet (see Fig. 8), and a complex velocity structure extending for km s-1.
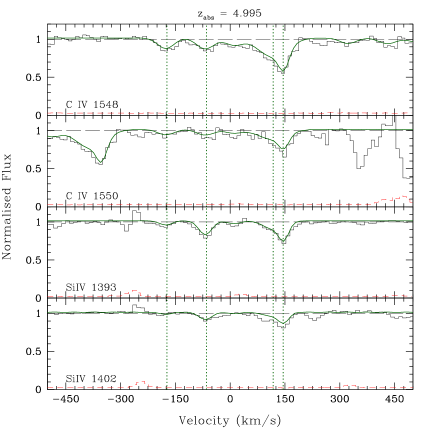
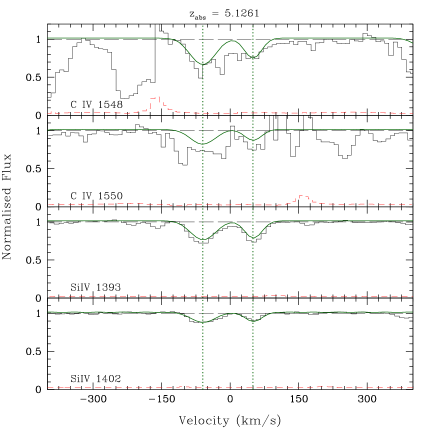
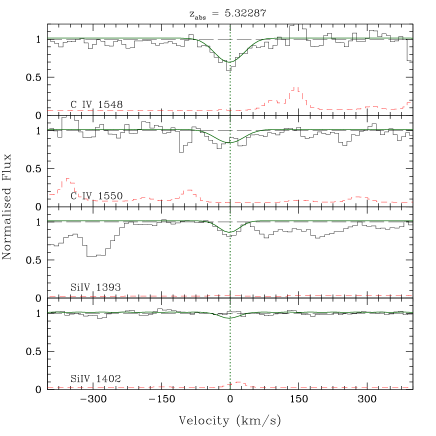
In this work, we claim the detection of two new C iv systems at in the spectrum of J0836+0054 (see Fig. 8). A strong Si iv at with two velocity components is observed in the VIS region of the spectrum, unfortunately the associated C iv absorption falls in a region badly contaminated by telluric lines. We partially corrected for them, but the column density resulting from the fit can be considered only as an upper limit. A marginal C iv detection strengthened by the presence of the associated Si iv 1393 Å line is observed at .
3.3 SDSS J1030+0524
This object has been thoroughly studied in the past being the highest redshift quasar observable from the Southern hemisphere before the recent discovery of the QSO ULAS J1120+0641 at (Mortlock et al., 2011).
Pettini03, by using spectra obtained with ESI at the Keck telescope, detected a strong C iv system at ; Ryan-Weber et al. (2006) identified two C iv doublets at , and 5.829 in the ISAAC spectrum, which are the main contributors to their measurement of (see also Ryan-Weber et al., 2009).
No low ionization systems were detected at both in the low (Jiang et al., 2007; Kurk et al., 2007) and high (Becker et al., 2006) resolution spectra of this object.
The X-shooter spectrum has an SNR in the region between the Ly emission and Å decreasing to in the band and increasing again to in the and bands.
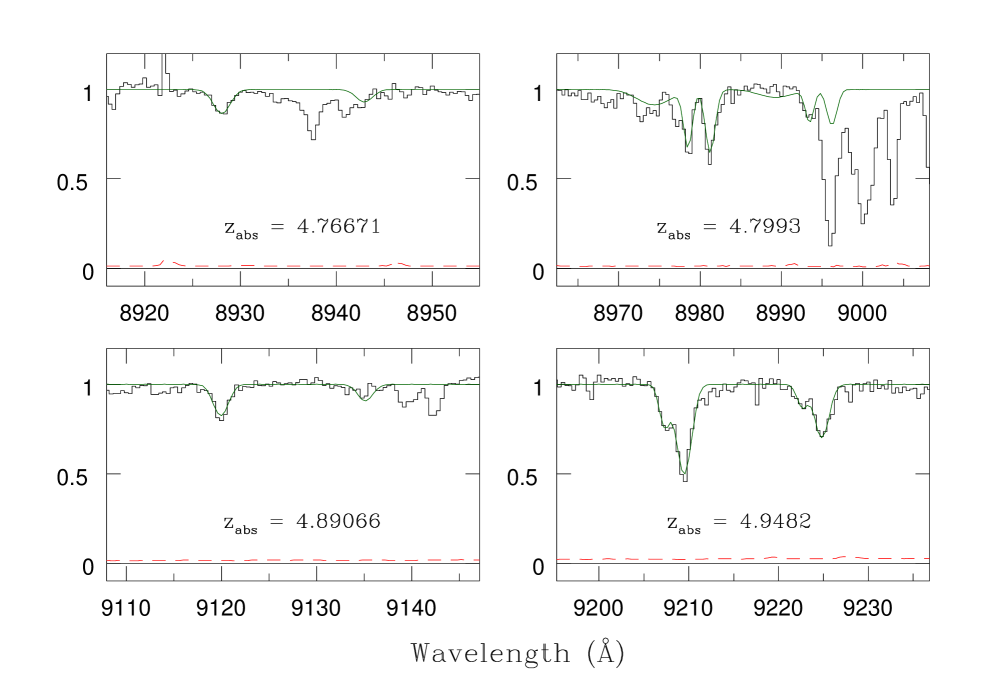
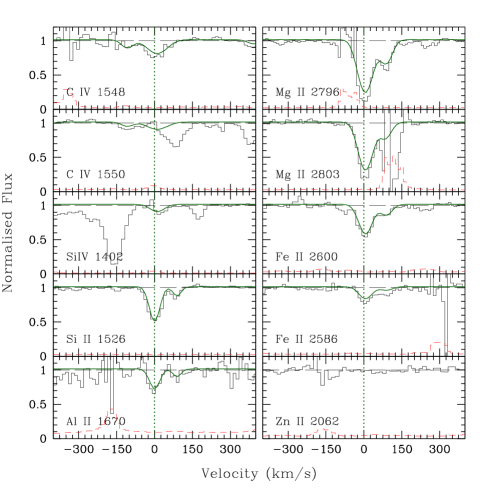
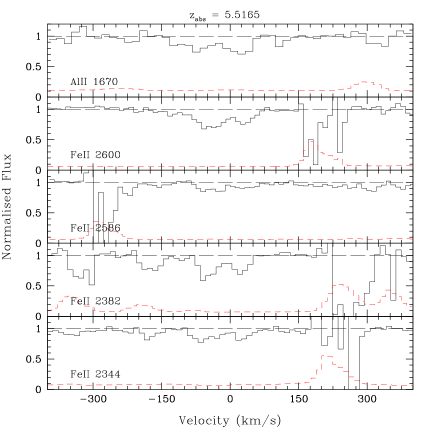
By deblending two complex velocity profiles in the visible region of the spectrum, we identified two possible new C iv doublets at (but see Section 4.1) and 4.799 (complex). Another, C iv doublet was identified at (but see Section 4.1). We confirm the presence of the C iv system at detected by Pettini03, with which we associate also the Mg ii doublet in the NIR region of the spectrum. Si ii 1526 and Al ii 1670, whose presence is claimed by Simcoe11, are not detected in our spectrum: in particular, the former if present would be blended with the Si iv 1393 at . The strong C iv lines at this redshift are clearly detected in our spectrum. This system shows associated low ionization lines: Al ii 1670 and several transitions due to Fe ii (, 2382, 2586, 2600 Å) in the NIR portion of the spectrum.
The previously identified C iv doublet at is present also in our spectrum, but no other associated line has been detected (Si iv is blended with strong telluric lines, but it was detected in the HIRES spectrum by Becker et al. (2009)). Recently, Díaz et al. (2011) have claimed the association between this C iv absorption system and a Ly emitter at , lying at a projected distance of 79 physical kpc from the line of sight. This is the highest redshift galaxy-absorber pair detected to-date, supporting the idea that galaxy-wide outflows were already in place at the end of the epoch of re-ionization.
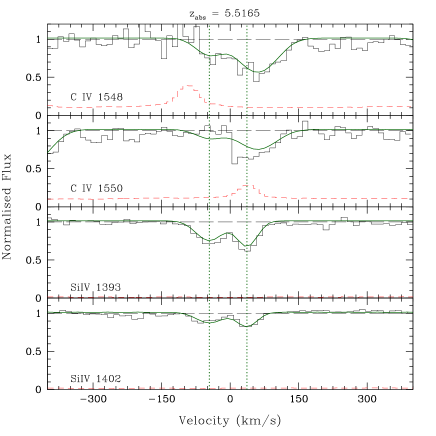
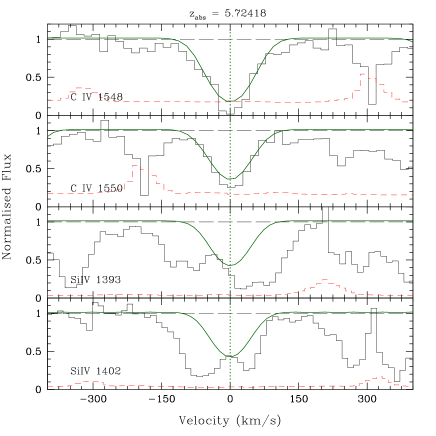
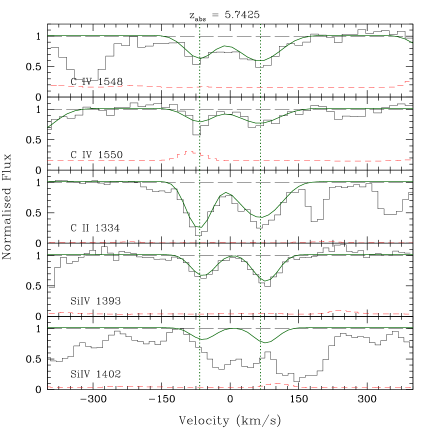
A weak C iv doublet (below ) is detected at , its nature is confirmed by the presence of the associated transitions due to C ii 1334, Si iv 1393 and Fe ii 2374, 2382, 2586, 2600 Å. We tentatively identify a C iv doublet at with possible associated Si iv doublet (but slightly shifted in redshift). All the C iv doublets in the spectrum of J1030+0524 are shown in Fig. 9 and 10.
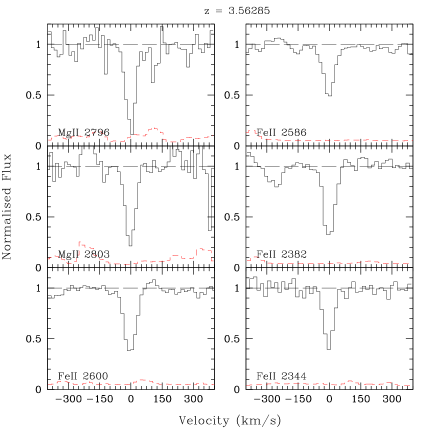
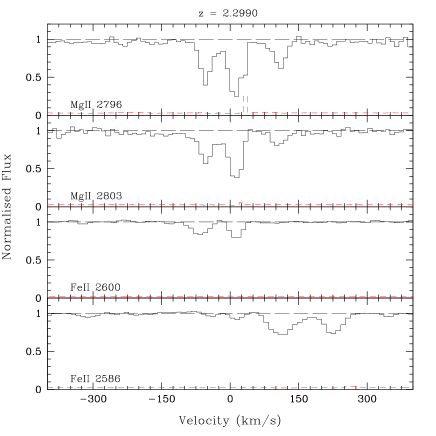
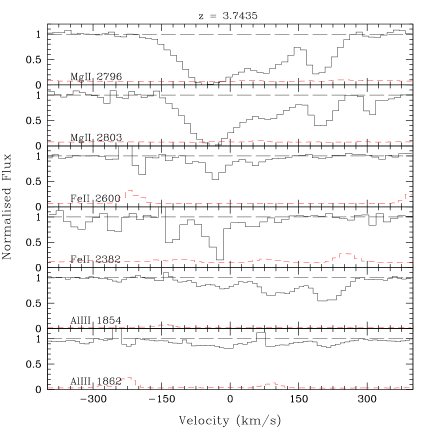
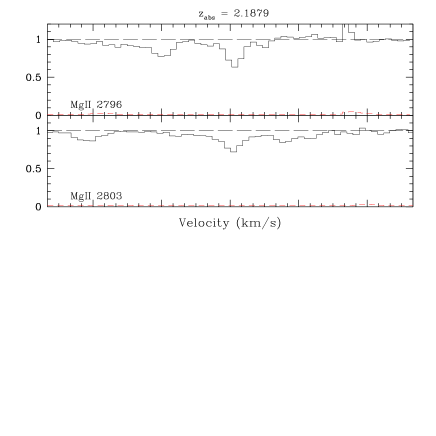
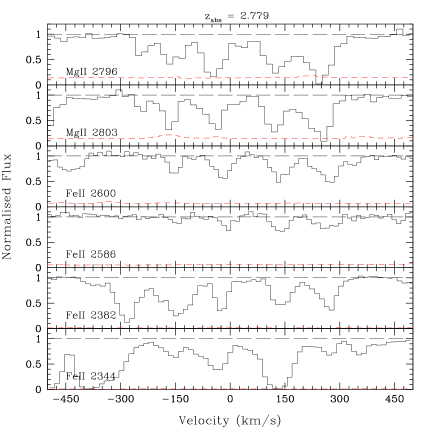
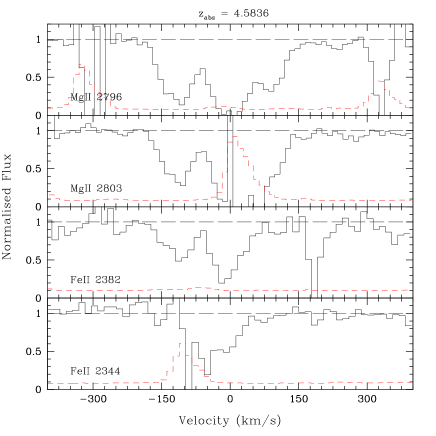
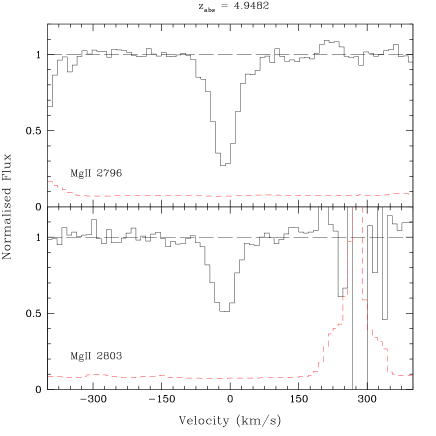
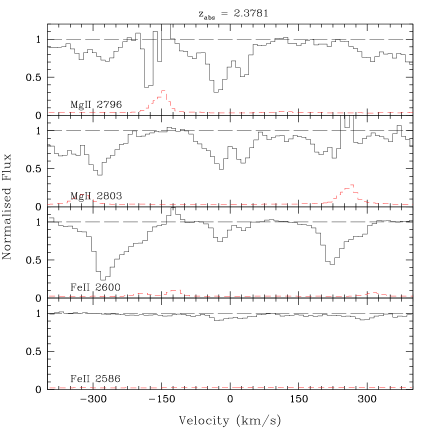
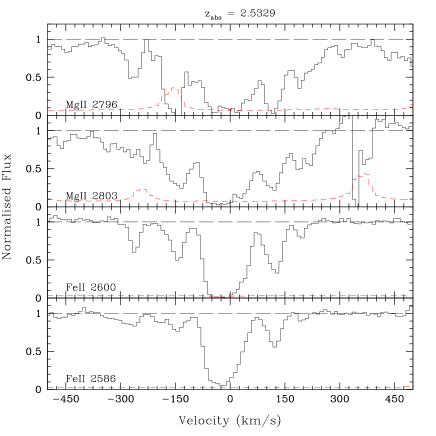
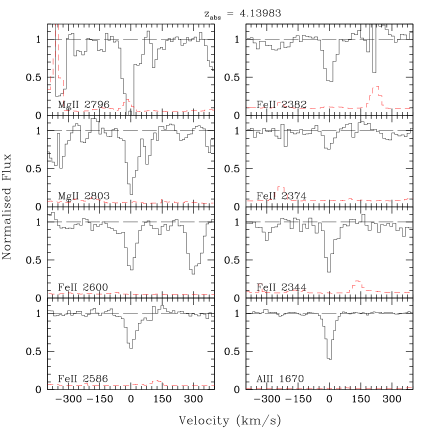
The C iv at detected by Ryan-Weber et al. (2006) was a misidentification: it is a strong, complex Mg ii doublet at showing also several associated Fe ii transitions (, 2382, 2586, 2600 Å). Another strong Mg ii doublet is present at with associated Fe ii 2344 and 2382 Å lines. A weak Mg ii doublet was detected at . All Mg ii systems are plotted in Figs 28 and 29 (Appendix B).
3.4 SDSS J1306+0356
This object was observed during the commissioning of X-shooter. The VIS portion of the spectrum was discussed in Paper I, while the NIR portion of the spectrum had an SNR too low to be used.
Here we present new observations taken from the ESO VLT archive which improves significantly the SNR of the spectrum. Furthermore, these new observations were obtained with a narrow slit increasing the resolution to and 8000 in the VIS and NIR arm, respectively. SNR goes from to 50 in the region between Ly emission and 9300 Å, decreasing to in the center of the band to increase again to and 40 in the and bands, respectively.
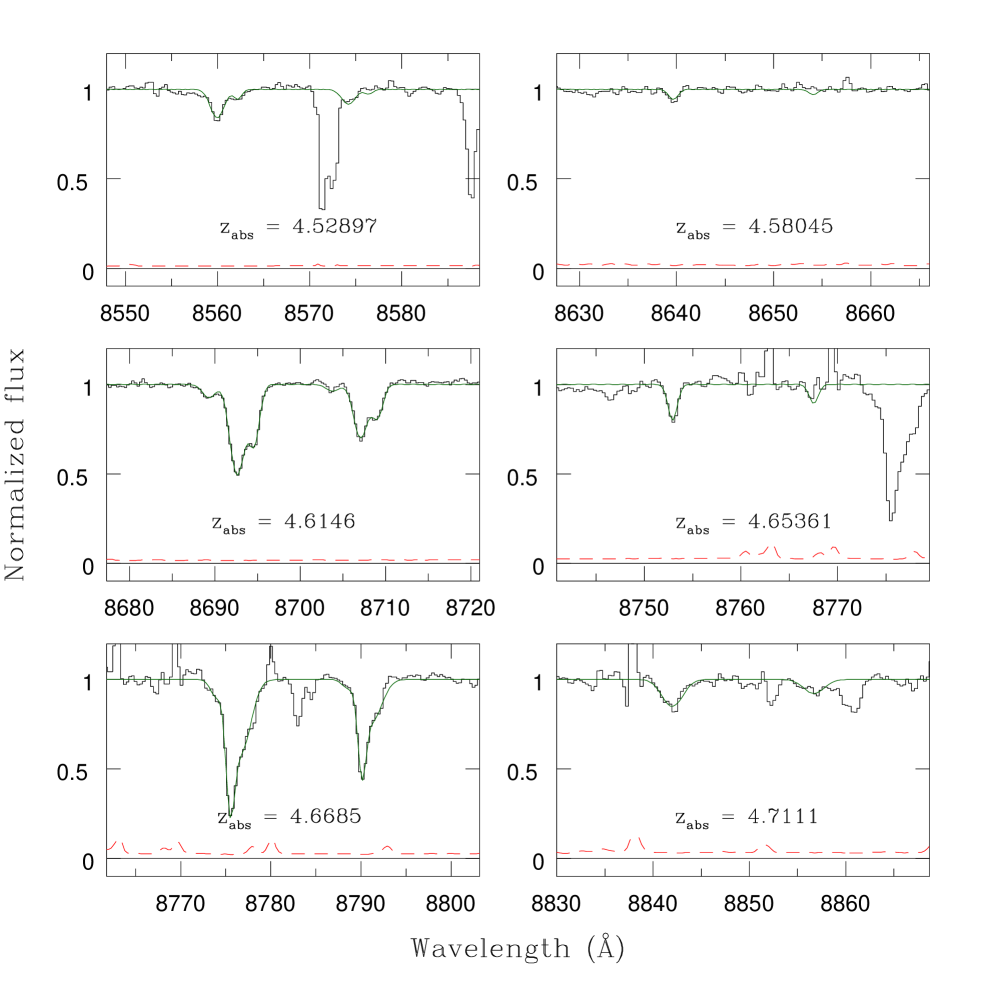
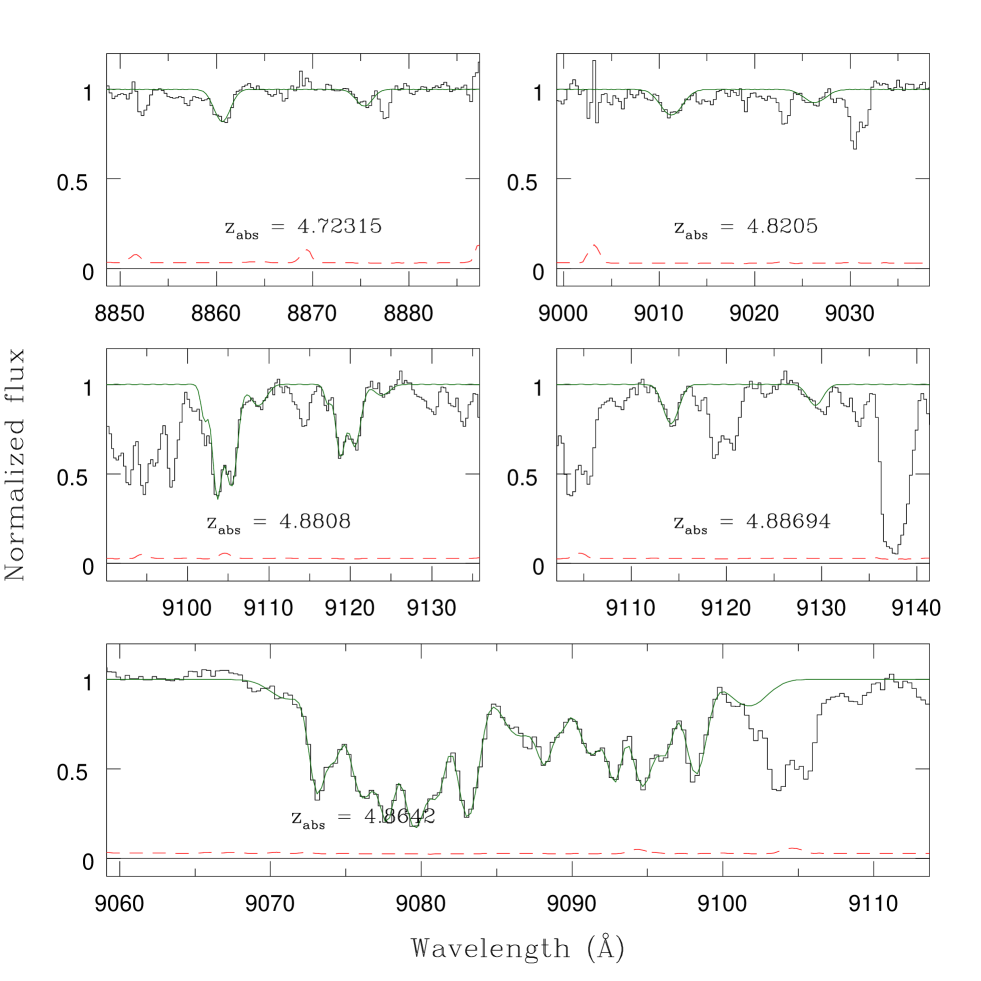
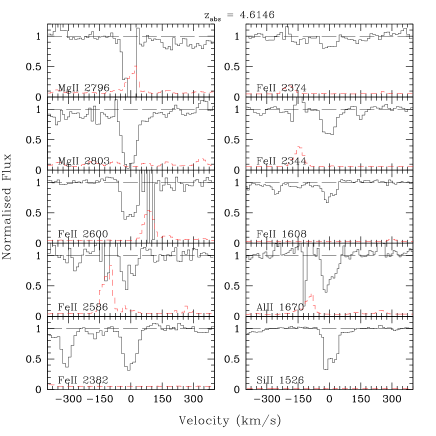
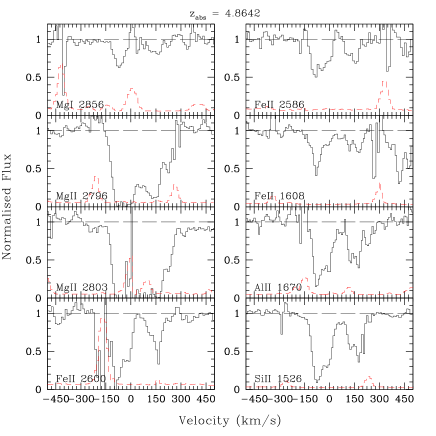
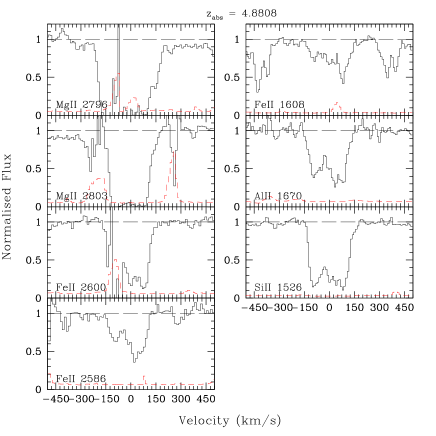
The stronger systems at , 4.668, 4.8642 (complex system, extending over more than 600 km s-1) and 4.8808 were confirmed also by Simcoe11. We report new detections at , 4.65361, 4.7111, 4.72315, 4.82048 (but see Section 4.2), 4.88694 plus a marginal detection at . All the identified C iv systems are shown in Figs 11 and 12.
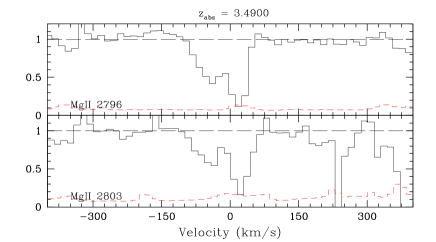
Three new Mg ii systems were identified at (with associated Fe ii 2586, 2600 Å lines), 3.4900 and 4.13983 (with associated Fe ii 2344, 2374, 2382, 2586, 2600 Å and Al ii lines), and the system at (Jiang et al., 2007; Kurk et al., 2007) is confirmed. Furthermore, we detected the low-ionization lines (Mg ii; Fe ii 1608, 2344, 2374, 2382, 2586, 2600 Å; Al ii and Si ii 1526 Å) associated with the strong C iv systems at , 4.8642 and 4.8808 (see Fig. 31 in Appendix B).
3.5 ULAS J1319+0950
This QSO at was the most recently discovered of the sample (Mortlock et al., 2009). We obtained observations from the X-shooter archive at a resolution of and 8000 in the VIS and NIR arms, respectively. This is the only intermediate-resolution spectrum of this object obtained up to now,together with the FIRE spectrum in Simcoe11.
The SNR varies between and 65 from the Ly emission to 9300 Å, decreasing to in the centre of the band. It increases again to SNR and 40 in the and band, respectively.
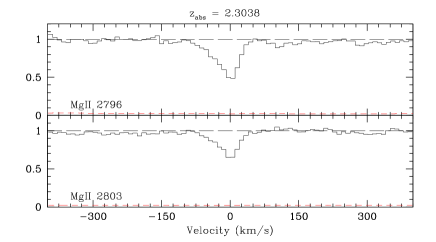
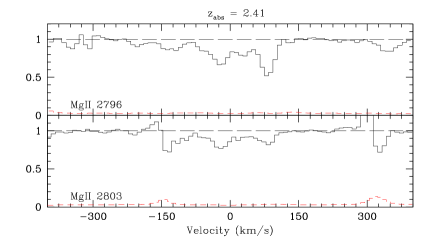
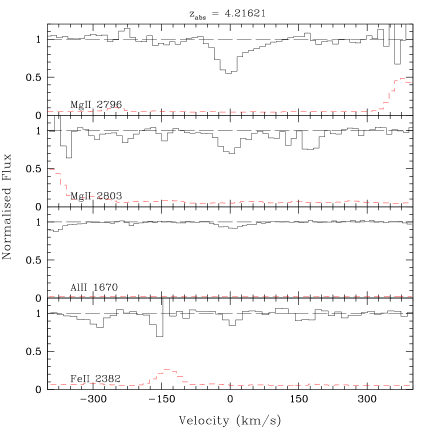
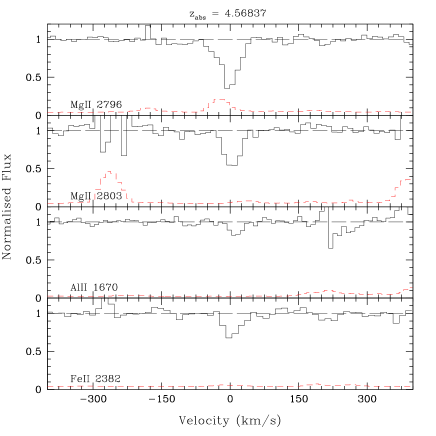
Four new Mg ii systems were detected at , 2.41 (complex system), 4.21621 (with Al ii and Fe ii 2382 Å), 4.56837 (with Al ii and Fe ii 2382 Å) and 4.662 (complex, associated with a C iv doublet). All Mg ii systems are shown in Fig. 32 (Appendix B).
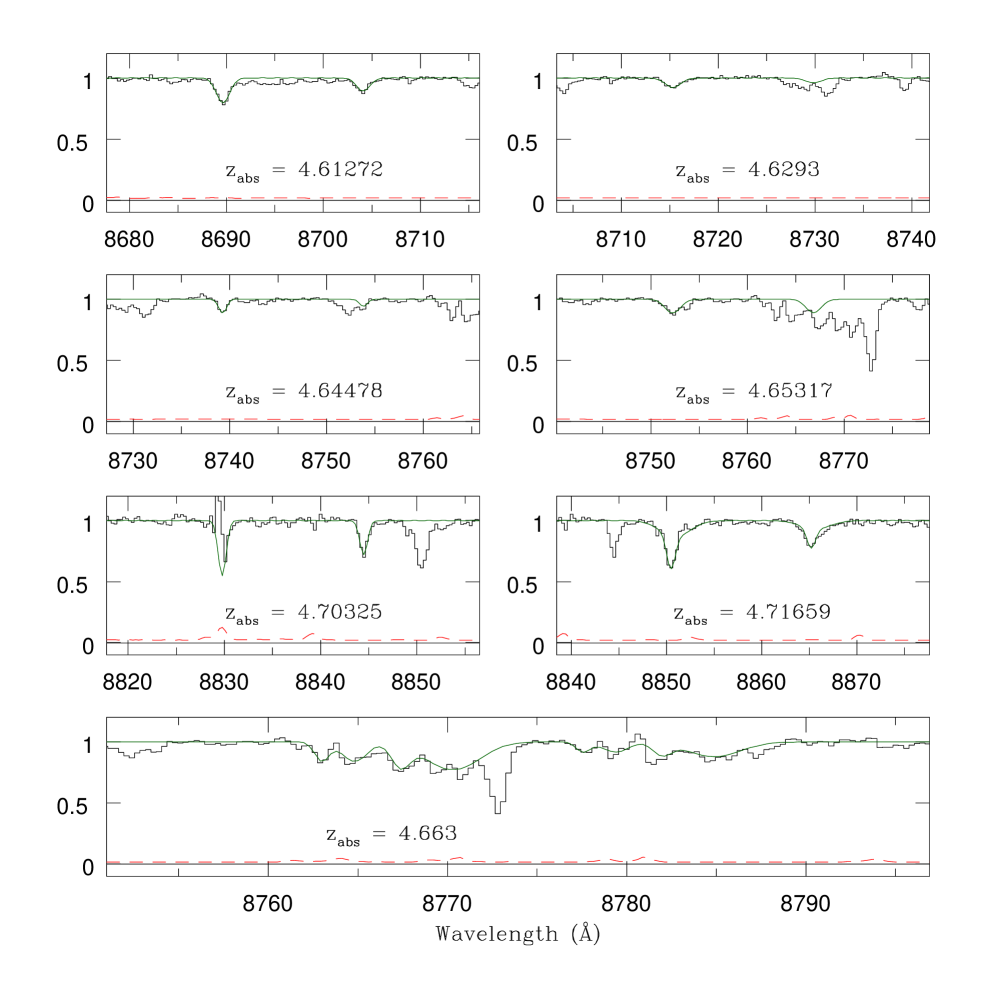
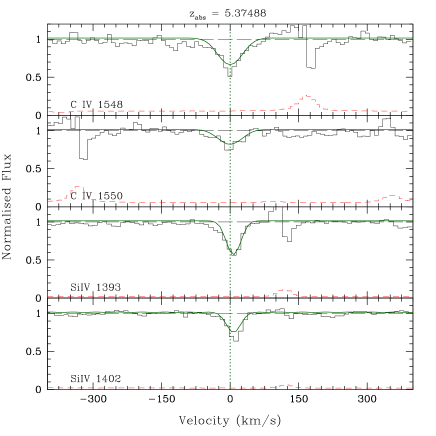
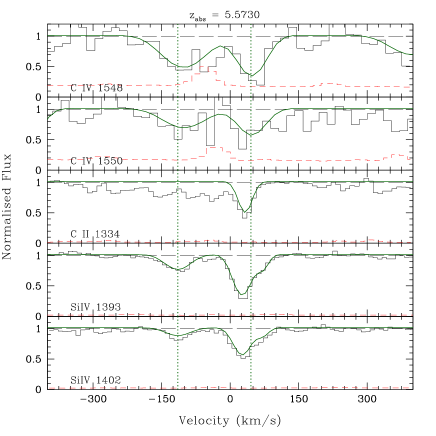
Several new C iv doublets were detected in the VIS portion of the spectrum where the SNR is maximum: at , 4.65317, 4.662 (complex system), 4.70325 and 4.7169, and also marginal detections at and 4.64478. Above , we report three detections confirmed by the presence of the associated Si iv doublet: , 5.37488 and 5.5730 (with the possible detection of C ii 1334 Å). Those three systems are shown in Fig. 14.
3.6 CFHQS J1509-1749
A preliminary spectrum of this object was already presented in Paper I.
The VIS spectrum has an SNR in the region between the Ly emission and Å, decreasing to in the middle of the band. The SNR increases again to in the band and to in the band.
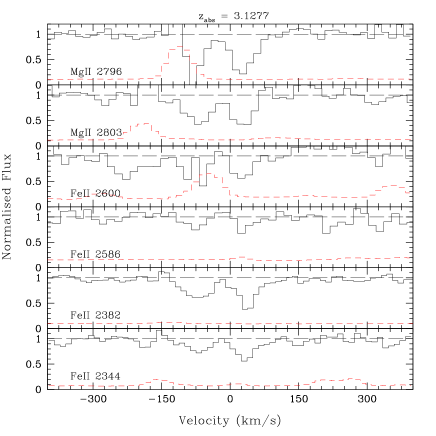
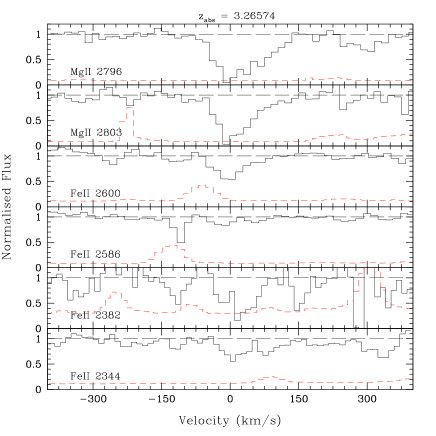
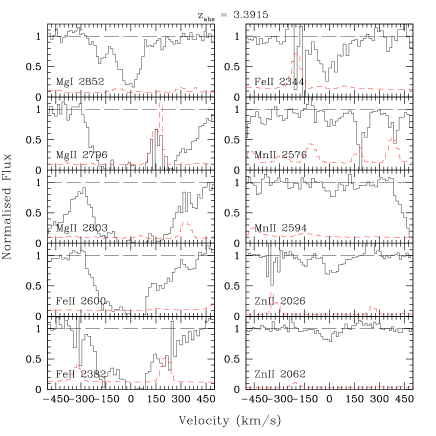
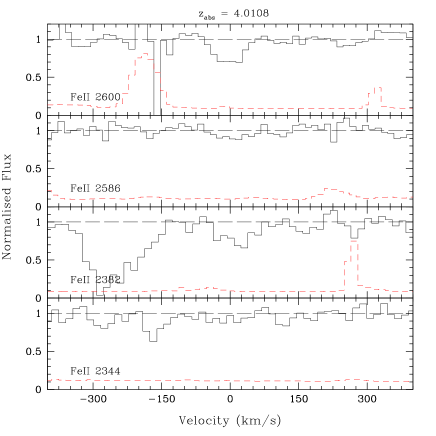
We detected three Mg ii systems with associated Fe ii 2344, 2382, 2586, 2600 Å transitions at , 3.26574 and 4.0108 (in this case Mg ii is blended with telluric lines). The saturated Mg ii doublet at presents associated ionic transitions due to Mg i, Mn ii, Fe ii 2344, 2382, 2600 Å and Zn ii 2026 and 2062 Å. The plots of these absorption systems are shown in Fig. 33 (Appendix B).
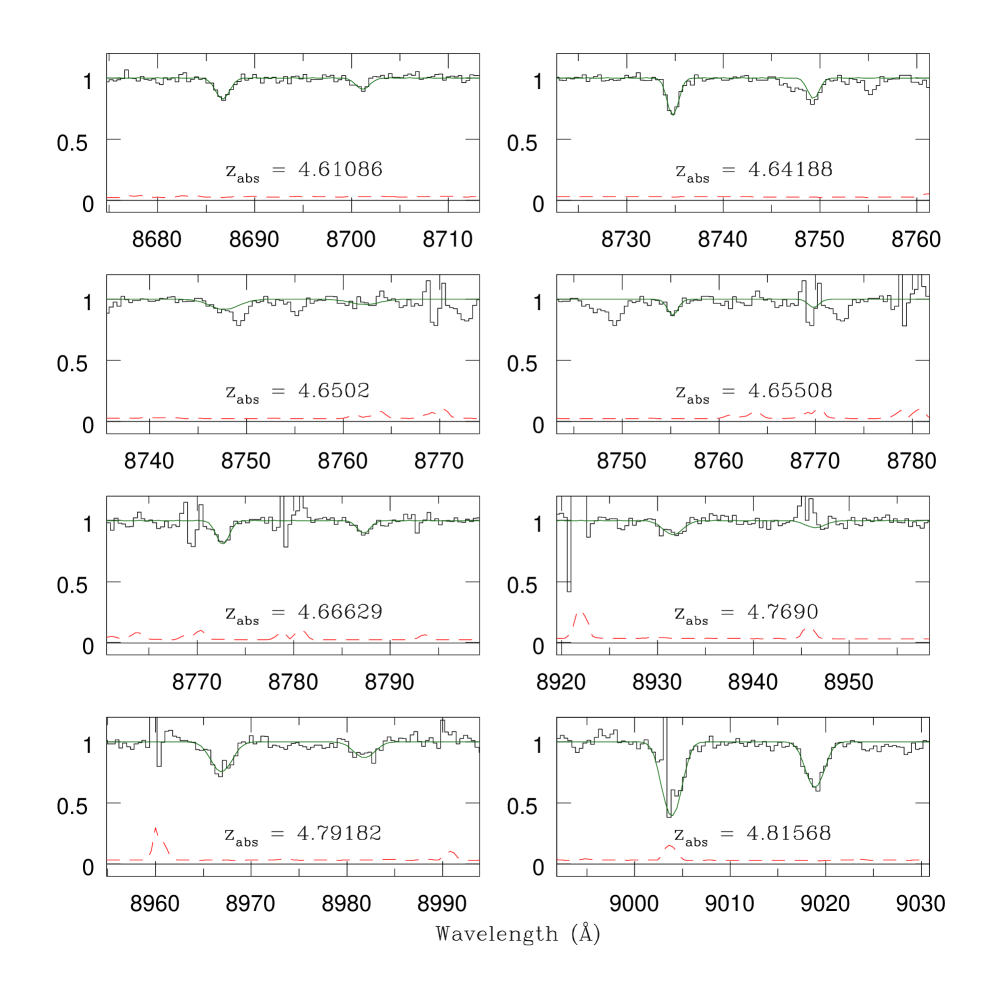
Eight C iv doublets have been identified at , 4.64188, 4.6501, 4.65508, 4.66629, 4.7690, 4.79182 and 4.81568. All C iv doublets are shown in Fig. 15.
We propose also an alternative identification for the C iv doublets at , 4.6501 and 4.66629. After the identification of a weak Al iii doublet at , we realized that the lines identified as C iv could also be part of a complex Al iii system at , where the first two velocity components happen to have the separation and the column density ratio of a C iv doublet. The system is plotted in Fig. 16. The absence of Fe ii transitions could be an argument in favour of the C iv nature of the lines; however there are no other pieces of strong evidence to make us prefer one or the other identification. This alternative identification of the three C iv doublets does not affect the computation of since the lines all have C iv.
At , the presence of the C iv system at claimed by Simcoe11 is confirmed in our NIR spectrum and is reinforced by the detection of the associated Si iv doublet. The system is shown in Fig. 17.
4 UVES spectra
In this section, we briefly report on the analysis of the high resolution spectra of SDSS J1030+0524, SDSS J1306+0356 and SDSS J1044-0125 obtained with the UV and Visual Echelle Spectrograph (UVES, Dekker et al., 2000) at the ESO VLT telescope. They were all observed by our group but the data have not been published before. The journal of observations is reported in Table 2.
The individual spectra were reduced and wavelength calibrated by using the UVES pipeline (Ballester et al., 2000). Wavelengths were then corrected to the vacuum heliocentric reference system. Fast rotators stars observed the same nights as the QSO were also reduced in order to identify telluric absorptions in QSO spectra. The final spectrum is computed as a weighted mean of the single frames. The SNR is in general quite low for all spectra, however the higher resolution allowed us to exclude the presence of some of the weakest systems detected in the X-shooter spectra.
| QSO | |||||
|---|---|---|---|---|---|
| (s) | (Å) | ||||
| J1030+0524 | 6.308 | 18.87 | 15300 | 7940 | |
| 22600 | 814 | ||||
| J1306+0356 | 6.016 | 18.77 | 12219 | 7940 | |
| 6300 | 804 | ||||
| 4277 | 814 | ||||
| 9900 | 826 | ||||
| 28500 | 860 | ||||
| J1044-0125 | 5.7824 | 18.31 | 5400 | 7940 | |
| 30270 | 860 |
4.1 SDSS J1030+0524
We used all the seven spectra existing in the UVES archive, obtained in six consecutive nights at the end of April and beginning of 2002 May. Only the red arm was used for these observations at central wavelengths and 8140 Å, with slit width of 1 arcsec, and binning of .
We looked for metals in the region Å, outside the Ly forest and common to the two settings. The SNR varies from 20 to 5 in the reddest part of the spectrum.
Inspection of the high-resolution spectrum of J1030+0524 did not confirm the presence of two systems detected in the X-shooter spectrum: the C iv doublets at and .
4.2 SDSS J1306+0356
We used two sets of UVES spectra available in the archive, obtained in 2002 and 2007. All the spectra were recorded with binning of and slit width of 1 arcsec. Six spectra are from 2002 with a total exposure time of 8.6h, and central wavelengths , 8140, 8260, 8040 Å. Ten spectra are from 2007 with a total exposure time of 7.9 h recorded at central wavelength 8600 Å. In the final spectrum, the region outside the Ly forest ranges between 8430 and 10000 Å. For the analysis, we used the average spectra of both sets of data for Å, with SNR varying from to 10 in the interval Å, respectively. For 9550 Å, only the average of the 2002 observations was used with SNR varying between 8 and 5 for the reddest wavelengths, because the spectra taken in 2007 have very poor quality with SNR .
The presence of the C iv doublet at , detected in the X-shooter spectrum, was not confirmed in this spectrum.
4.3 SDSS J1044-0125
This quasar was excluded from the sample collected with the X-shooter spectrograph because it is a BAL object.
In the UVES archive there are six spectra obtained in March and April of 2002 with the red arm at central wavelength Å, with slit width of 1 arcsec and binning of .
The final spectrum covers the ranges and Å, even though the flux is not zero at Å. The quality of the final spectrum is quite poor with an SNR of the order of 10.
A single feature is observed which was identified as C ii 1334 Å at . No other associated transitions were detected in the UVES spectrum.
Songaila & Cowie (2002) claimed the detection of the Fe ii 1608 Å line at the same redshift in the ESI spectrum and derived an estimate of the metallicity of [Fe/H] . On the other hand, no absorption lines were detected in the higher resolution spectrum obtained with MIKE@Keck by Becker et al. (2011).
5 C iv line statistics
5.1 The C iv CDDF
The CDDF, , is defined as the number of lines per unit column density and per unit redshift absorption path, d (Tytler, 1987). The CDDF is a fundamental statistics for absorption lines, similar for many aspects to the luminosity function for stars and galaxies.
The redshift absorption path is used to remove the redshift dependence in the sample and put everything on a comoving coordinate scale. In the assumed cosmology, it is defined as
| (1) |
With the adopted definition, does not evolve at any redshifts for a population whose physical size and comoving space density are constant.
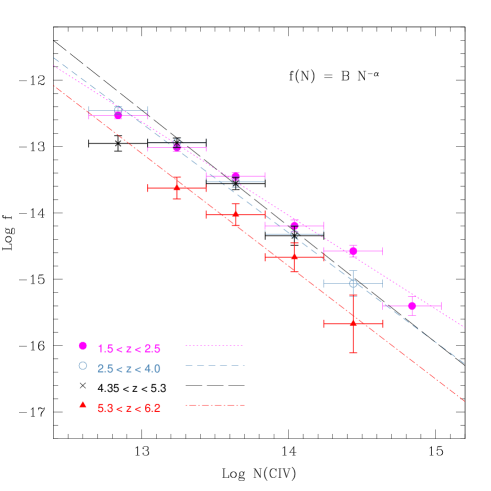
We have computed splitting our data into two redshift bins in order to have comparable in both of them: () and (), considering column densities C iv. The possible evolution with redshift of the CDDF has been verified by comparing for the present data with for the lower redshift sample in D’Odorico et al. (2010). Due to the higher resolution of the spectra in the latter work, C iv lines with velocity separation smaller than km s-1 have been merged into C iv systems.
The result is shown in Fig. 18, where is plotted for four redshift intervals: , , and binned at C iv cm-2. The two CDDFs at higher redshift are complete starting from larger column densities, and a constant decrease with increasing redshift is observed in the bin corresponding to C iv.
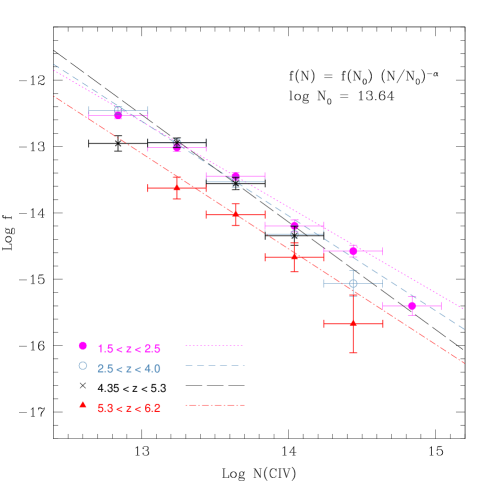
To quantify the redshift evolution of the CDDF, we have computed a least-squares fit of the four samples with a power law of the form (see Fig. 18). From the fit, we observe that in the highest redshift bin the CDDF is lower by a factor of with respect to the CDDF at and . This is in good agreement with the result by Becker et al. (2009) which was based on NIRSPEC spectra at of four QSOs, two of which are also in our sample. The CDDF in the lowest redshift bin has a different slope due to the presence of a larger number of absorption systems in the column density range C iv. At C iv there is a factor of difference between the CDDF at and that at . Due to the small number of points, the power law fit with two variables gives very large errors, in particular for the power-law normalization (highly correlated with the index errors). To obtain more solid results, we have tried also a power-law fit with a pivot column density, , where we chose . The results of this fit are shown in Fig. 19. The power-law indices are lower than in the previous fit, although always consistent within . The net decrease of the highest redshift CDDF is less evident but still present: there is a factor of difference between the CDDF in the redshift bins and .
5.2 The redshift evolution of the cosmic mass density of C iv
| range | Lines | ||||
| () | () | ||||
| C iv | |||||
| 4.818 | 19.21 | 30 | 1.4 | 0.3 | |
| 5.634 | 19.53 | 12 | 0.84 | 0.33 | |
| C iv | |||||
| 4.802 | 19.21 | 9 | 0.65 | 0.22 | |
| 5.706 | 19.53 | 5 | 0.61 | 0.32 | |
The CDDF can be integrated in order to obtain the cosmological mass density of C iv in QSO absorption systems as a fraction of the critical density today:
| (2) |
where km s-1Mpc-1 is the Hubble constant, is the mass of a C iv ion, is the speed of light, g cm-3 and is the CDDF. The above integral can be approximated by the sum:
| (3) |
with an associated fractional variance:
| (4) |
as proposed by Storrie-Lombardi et al (1996). Note that the errors determined with this formula could be underestimated, in particular in the case of small line samples. In D’Odorico et al. (2010), we found that errors on computed with a bootstrap technique were, at maximum, a factor of larger than those estimated with equation (4). For a fair comparison with previous results, however, we report in Table 3 the errors computed with equation (4).
Great care has to be taken when comparing results obtained from different samples, since the values of significantly depend on the column density range over which the sum or the integration is carried out, and as a consequence on the resolution and SNR of the available spectra. To take this aspect into account, we have computed two sets of values to be compared consistently with different data in the literature: the first with CIV and the second with CIV. The final results (reported in Table 3) are not corrected for completeness. We have computed the correction to due to the undetected C iv lines with column densities CIV in the redshift bin , which results to be negligible, of the order of .
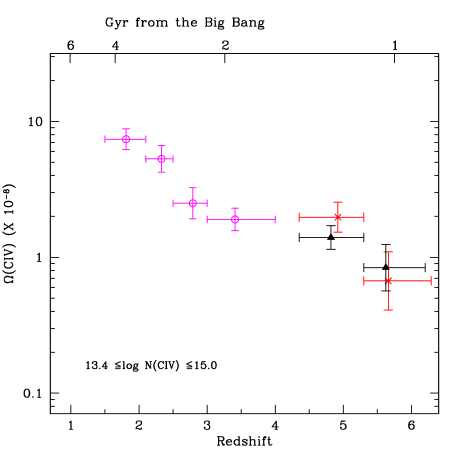
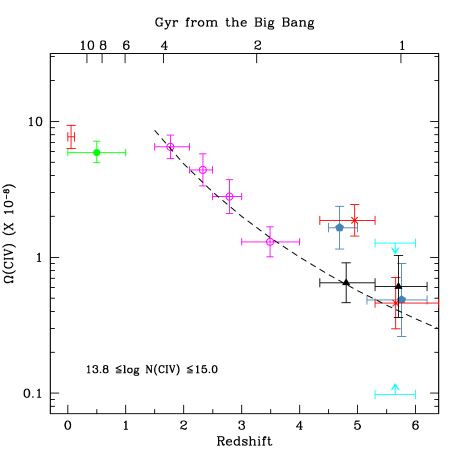
The evolution with redshift of is shown in the two panels of Fig. 20. The determination based on our X-shooter sample has been split into two redshift bins and , to make a reliable comparison with the other most recent determination of at high redshift by Simcoe11. The behaviour of in the redshift range was determined with the high-resolution sample by D’Odorico et al. (2010). In the left plot, where CIV, our measurement is compared with the result obtained by Simcoe11 using only the FIRE spectra, which have the same degree of completeness as our observations. We have not used their enlarged sample for which the completeness column density limit is not well defined. The two estimates are in very good agreement (within one sigma) as was expected since the two samples are almost identical. In the whole inspected redshift range, slowly increases from to lower redshifts, and then it increases more steeply with a factor of difference between and .
The determination of was extended also to very low redshift (, Danforth & Shull, 2008; Cooksey et al., 2010) using UV spectra at lower resolution and lower SNR limiting the detectability of C iv lines to larger column densities. In order to study the evolution of in the whole redshift range between and 6.2, we have carried out a second computation of the values of for C iv systems in the column density range C iv. The results are shown in the right plot of Fig. 20 where we have added also the results by D’Odorico et al. (2010) and the older determinations at high redshift by Pettini03 (corrected for the considered column density range), Ryan-Weber et al. (2009) and Becker et al. (2009). In this case, we compare our estimate of with the result obtained by Simcoe11 for their enlarged sample. Our point in the highest redshift bin is in agreement with all previous determinations. The value of in the redshift range is slightly lower than the estimate by Simcoe11, resulting in a smoother increase of the mass density towards lower redshifts. The discrepancy between our measurements and the result by Simcoe11 is due, in our opinion, to the fact that in Simcoe11 the two estimates at and at have different completeness limits. In the lower redshift range the FIRE spectra are complete down to C iv, while the enlarged sample in the higher redshift bin is likely complete to higher column densities.
In summary, we observe a slow increase of the C iv content from to and then a flattening towards . Our data at high redshift together with the data points of D’Odorico et al. (2010) were fitted with the function: (see the right-hand panel of Fig. 20). Since we expect that these strong lines arises in the halo of star forming galaxies (e.g. Adelberger et al., 2005), what we observe could be the effect of the progressive enrichment due to in situ star formation as the star formation rate density increases with time and then decreases below redshift .
6 Redshift evolution of ionic ratios
It is generally thought that the IGM is kept ionized by the integrated UV emission from active nuclei and star-forming galaxies, but the relative contributions of these sources as a function of epoch are poorly known. At , the declining population of bright quasars appears to make an increasingly small contribution to the 1 Ryd radiation background (e.g. Bianchi, Cristiani & Kim, 2001), and it is believed that massive stars in galactic and sub-galactic systems may provide the additional ionizing flux needed at early times (e.g., Madau et al. 1999; Gnedin 2000; Haehnelt et al. 2001; Wyithe & Loeb 2003; Meiksin 2005; Faucher-Giguère et al. 2008; Robertson et al. 2010). This idea may be supported by the detection of escaping ionizing radiation from individual Lyman break galaxies at (but see Vanzella et al., 2012b, a).
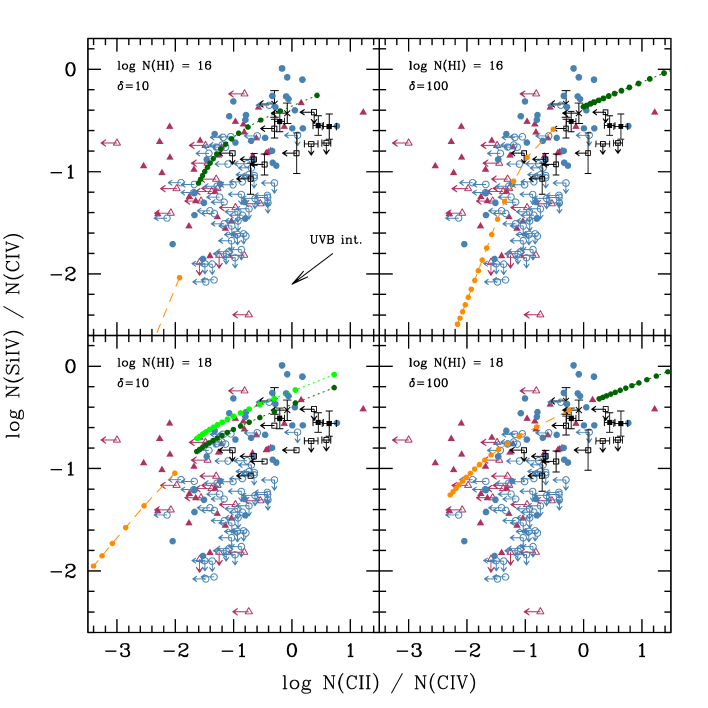
The spectral shape of the ultraviolet background (UVB) radiation should be reflected into the ionization pattern of QSO metal system absorbers. In particular, the ionic ratios Si iv/C iv and C ii/C iv are sensitive to the shape of the high-energy end of the ionizing spectrum where the He ii break is expected (Giroux & Shull, 1997; Savaglio et al., 1997; Agafonova et al., 2007; Bolton & Viel, 2011).
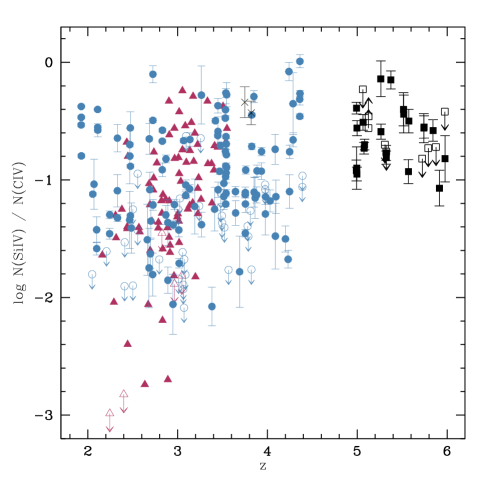
In this work, we have detected for the first time a significant sample of Si iv doublets at . This fact allows us to study the behaviour of the Si ivC iv ratio for all those absorption systems in our sample for which both Si iv and C iv are outside the Ly forest. The result is shown in Fig. 21 where this ionic ratio is plotted as a function of redshift, together with data from works at lower redshift (Savaglio et al., 1997; Songaila, 1998; Boksenberg et al., 2003). In order to compare the data by Boksenberg et al. (2003), obtained from the fit of high resolution HIRES@Keck spectra, with the other samples, we merged velocity components closer than 50 km s-1 before computing the Si iv/C iv ratios. Qualitatively, our X-shooter sample is characterized by large values and a small dispersion. Songaila (1998) claimed to observe a jump in the median value of the Si iv/C iv ratio at redshift that she explained with a variation of the shape of the UVB spectrum due to the end of the He ii re-ionization process. This result was not confirmed in the work by Kim et al. (2002). The authors of this work selected C iv systems in the range on the base of the associated H i absorber in order to consider only metals associated with Ly forest lines. Also Boksenberg et al. (2003) found that the median values of Si iv/C iv obtained from summed column densities in systems are consistent with being constant over the whole observed range .
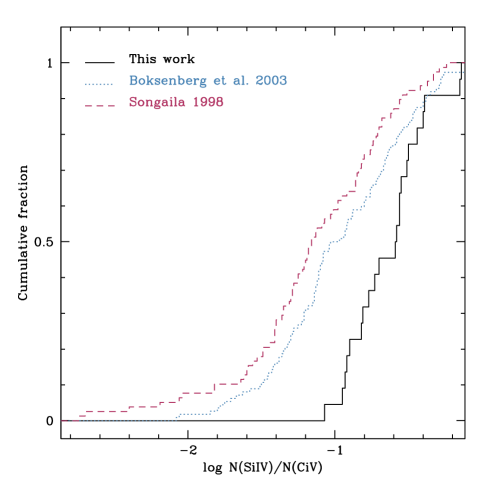
A quantitative comparison of our sample with the lower redshift ones using the Kolmogorov-Smirnov test indicates that the X-shooter high redshift sample is likely drawn from a different parent distribution. The cumulative distributions for the Si iv/C iv ratios of the three main samples are shown in Fig. 22. The probability that the X-shooter sample is drawn from the same distribution of the Songaila et al. sample or of the Boksenberg et al. one is tiny: and , respectively. The probability that the two lower redshift samples are drawn from the same distribution is significantly larger: .
6.1 Photoionization models

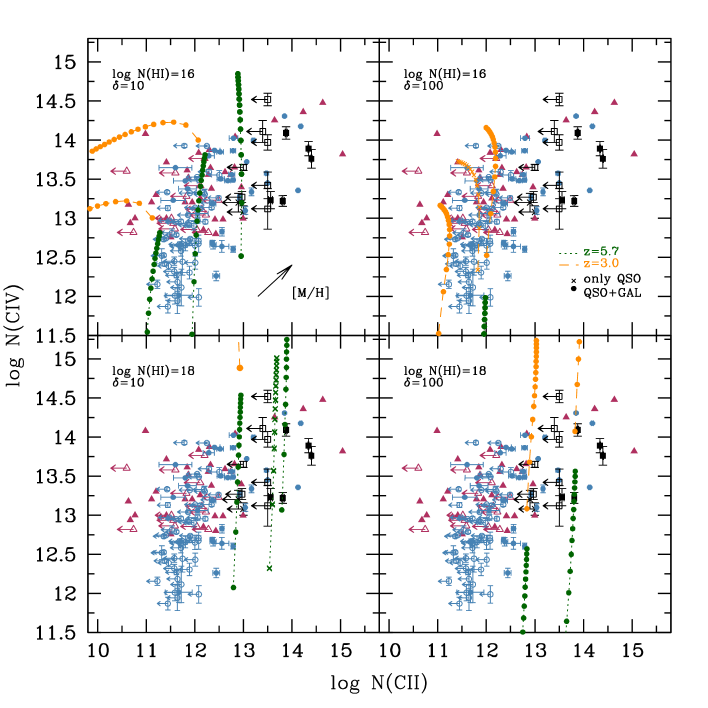
We have run a set of ionization models with version 10.00 of the CLOUDY code, last described by Ferland et al. (1998). It is not conceivable to constrain the whole set of parameters of a photoionization model with just a few ionic transitions as in our case, due to the high level of degeneracy between e.g. total metallicity and chemical composition, or density and intensity of the ionizing flux. For this reason, we decided to run a limited set of models with parameters varying in reasonable ranges with the main aim of verifying that their predictions were compatible with the observed ionic column densities. We chose the HM05 option in CLOUDY, which consists of a UVB made by quasars and galaxies with a 10 per cent photon escape fraction reprocessed by the IGM (Haardt & Madau, 2001). Two sets of models were run: one at to represent our data and one at to represent the lower redshift sample. At each redshift, we considered two over-densities, and 100, where is the IGM baryonic density and is the mean density at the considered redshift; two metallicities, [/H] and , although in some cases also the predictions for [/H] are plotted, and two H i column densities, H i and 18. In all cases, solar relative abundances were adopted as a ground base. We ran also models with a relative abundance [C/Si] as measured recently in metal-poor damped Lyman systems (Cooke et al., 2011) and in low-ionization absorption systems (Becker et al., 2012). The column densities of the interesting ions were changed by multiplying the intensity of the UVB spectrum by a factor ranging from 0.25 to 4 in steps of 0.25.
Even assuming that C and Si are evolving in locksteps, their ratio could be affected not only by the ionization condition of the gas but also by the possible variation in the relative abundances of elements with respect to solar. In order to isolate ionization effects, we have looked for the C ii 1334 Å lines associated with our C iv systems, which fall outside the Ly forest. Only 12 systems in our sample satisfy this requirement, of which 7 are upper limits. The C ii/C iv ratio is not affected by possible variation in the relative abundances of elements with respect to solar; on the other hand, the transition C ii 1334 Å is saturated in most cases and the measured column density could be underestimated. Assuming that this is not the case for the five detections in our sample, we see from Fig. 24 that the measured column densities are, in general, larger than those measured at lower redshift for the same range of C iv column densities. This is evident also in Fig. 25, where most of the low-redshift data have a lower C ii/C iv ratio with respect to our points.
The comparison between observed data and CLOUDY models is shown in Figs 23-25. Each one of the four boxes present in every figure, shows a different combination of and HI for the CLOUDY runs with the considered metallicities. In Fig. 25, we showed only the model results for [/H] , because the different metallicities give very similar results. When the model track is not shown in the figure it is because it falls outside the plotted range of values. In the upper-right and bottom-left plots of Figs 23 and 24, we show also the result of a model with a UVB due only to quasars and metallicity [/H] . At a fixed metallicity and UV intensity, the QSO-only background produces (a factor of ) less C ii, C iv and Si iv with respect to the QSO-galaxy background, this effect is more evident at where the contribution of QSOs to the UVB is less important.
Some qualitative considerations can be drawn as follows: the high-redshift absorbers are better explained by gas with an over density of 10 and an indicative total H i column density of H i, while the lower redshift absorbers trace gas with and preferentially have lower H i column density (H i). This is in agreement with what was found in simulations (e.g. Oppenheimer & Davé, 2006; Cen & Chisari, 2011), where it is shown that C iv is a good tracer of the metallicity in the low-density gas at high redshift while becoming less and less representative going towards lower redshift where it traces gas at larger over densities (). It has to be noted that the indication on the column density of absorbers could be an observational bias, since in our sample we are observing only the strongest systems due to the resolution and SNR of our spectra.
Models with a relative abundance [C/Si] do not reproduce the high-redshift data better than solar abundance model (see Fig. 25). This is somewhat puzzling since Becker et al. (2012) found this abundance result for a sample of absorption systems at among which there are also the two absorption systems at and 5.8770 along the line of sight to J0818+1722. A possible explanation is that since those systems are likely damped or sub-damped Lyman systems, they are subject to a local ionizing flux whose shape is different from the adopted one.
A more detailed analysis of the properties of the high- absorbers will be carried out in a forthcoming paper with a set of cosmological hydro-simulations coupled with cloudy models.
7 Conclusions
The aim of this study was to investigate the metal content of QSO absorbers at very high redshift () in the framework of the general picture of the enrichment history of the Universe.
The reported results are based on a programme devoted to the observations of QSOs at with the X-shooter spectrograph at the unit 2 of the ESO VLT telescope. The final sample consists of the spectra of six objects, of which four were observed in our programme and two were downloaded from the X-shooter archive. Each QSO spectrum was inspected to look for metal absorption lines outside the Ly forest. Then, we focused our attention on the properties of the C iv sample looking, in particular, for the presence of the associated Si iv doublet and C ii 1334 Å line. A total of 102 C iv lines were detected in the redshift interval , of which 25 with have associated Si iv, and 5 show the C ii line. This is the first time that a significant sample of Si iv doublets is reported.
We have reduced and analysed also the UVES spectra of QSOs that were available in the archive. Unfortunately, those observations have too low signal-to-noise ratio to add significant information to the X-shooter observations. In a few cases, thanks to the higher resolution, it was possible to discard the weak metal systems detected with X-shooter.
The main results are described in the following.
-
-C iv CDDF the data sample has been divided into two redshift bins. The CDDF for the bin at is in good agreement with the CDDF of the low redshift systems (). On the other hand, the distribution function of the lines in the high redshift bin () shows systematically lower values in all four column density bins, by a factor of depending on the considered fitting function. This indicates that the properties (e.g. the number density or the physical size) of the C iv absorber population are varying at those redshifts. The observed decrease at is in agreement with what was found by Becker et al. (2009) with a sample of four QSOs observed at slightly higher resolution.
-
- C iv cosmic mass density: the contribution of C iv lines to the cosmic mass density has been computed for our line sample and compared with previous results at lower and similar redshift. We considered two column density regimes which give slightly different results (see Table 3). computed for the absorption lines with C iv is in very good agreement with the recent determination by Simcoe11. We observe a slow increase from the range to and then to , then the mass density evolves more steeply with an increase of a factor of to . Considering the evolution in time, we see approximately an increase of a factor of in every Gyr. In the case of the stronger C iv lines (C iv) a gentle rise of a factor of is observed between and with a possible flattening towards . For the strong lines, we do not observe a drop in between and as claimed by other authors (e.g. Ryan-Weber et al., 2009, Simcoe11). The increase between and 1.5 is well fitted by a power law: . The observed behaviour is suggestive of a progressive accumulation of the metals produced by stars inside galaxies in the circumgalactic medium and IGM. When the star formation rate density is observed to decrease, below , the increase in slows down. It is important to remember that the abundance of our observable, the triply ionized carbon, is determined by the total amount of carbon but also by the ionization conditions in the gas: cosmological simulations could help to fully interpret our results and determine the true evolution of the metal content in the IGM.
-
- C iv, Si iv and C ii combined constraints on the nature of absorbers: starting from our C iv sample, we built a subsample of lines with associated Si iv doublets and a further subsample of lines for which it was possible to detect both the Si iv and the C ii 1334 Å lines, outside the Ly forest. The Si iv/C iv column density ratios for our sample have a small dispersion around a logarithmic median value of . This is somewhat higher than the median value of at found by Boksenberg et al. (2003). A Kolmogorov-Smirnov test run on our sample in comparison with lower redshift samples () indicates that they are likely not drawn from the same parent distribution, suggesting a change in the ionization conditions of the gas with increasing redshift. A qualitative test was carried out by comparing the observed ionic column densities with the results of a (limited) set of CLOUDY ionization models. We adopt a Haardt-Madau UVB, solar abundances and metallicities [/H] and . Indicatively, the observed C iv absorbers at high redshift are better explained by gas with over density of , while at better agreement is obtained with gas with . This is in agreement with the predictions of metal enrichment simulations (e.g. Oppenheimer & Davé, 2006; Cen & Chisari, 2011). CLOUDY models with [C/Si] give a worse representation of the high-redshift data although this relative abundance was obtained for absorption systems. This discrepancy suggests that probably some of these absorbers trace very dense and neutral environments ionized by local sources.
The present study shows how metal enriched ionized gas is present even at very high redshift possibly in the form of dense systems affected by the presence of local ionizing stellar sources. Unfortunately, the modest number of lines of sight and the relatively low SNR in the NIR region are still preventing us to reach solid results on the statistics of C iv absorbers at . Only a major observational effort could improve significantly this situation due to the faintness of the targets and their paucity. This will be an extremely interesting and driving science case for the next generation of visual and NIR high-resolution spectrographs at the ELTs.
Acknowledgements
This work is supported by PRIN-INAF 2010. MV is supported by PRIN-MIUR, INFN/PD51 and the ERC Starting Grant CosmoIGM. We would like to thank the anonymous referee for the very careful reading of the paper and the helpful suggestions.
References
- Adelberger et al. (2005) Adelberger K. L., Shapley A. E., Steidel C. C., Pettini M., Erb D. K., Reddy N. A., 2005, ApJ, 629, 636
- Agafonova et al. (2007) Agafonova I. I., Levshakov S. A., Reimers D., Fechner C., Tytler D., Simcoe R. A., Songaila A., 2007, A&A, 461, 893
- Ballester et al. (2000) Ballester P., Modigliani A., Boitquin O., Cristiani S., Hanuschik R., Kaufer A., Wolf S., 2000, The Messenger, 101, 31
- Becker et al. (2012) Becker G. D., Sargent W. L. W., Rauch M., Carswell R. F., 2012, ApJ, 744, 91
- Becker et al. (2011) Becker G. D., Sargent W. L. W., Rauch M., Calverley A. P., 2011, ApJ, 735, 93
- Becker et al. (2009) Becker G. D., Rauch M., Sargent W. L. W., 2009, ApJ, 698, 1010
- Becker et al. (2006) Becker G. D., Sargent W. L. W., Rauch M., Simcoe A. R., 2006, ApJ, 640, 69
- Bianchi, Cristiani & Kim (2001) Bianchi S., Cristiani S., Kim T., 2001, A&A, 376, 1
- Boksenberg et al. (2003) Boksenberg A., Sargent W. L. W., Rauch M., 2003, astro-ph/0307557 (BSR03)
- Bolton & Viel (2011) Bolton J. S., Viel M., 2011, MNRAS, 414, 241
- Cen & Chisari (2011) Cen R., Chisari N. E., 2011, ApJ, 731, 11
- Choudhury et al. (2008) Choudhury T. R., Ferrara A., Gallerani S., 2008, MNRAS, 385, L58
- Cooke et al. (2011) Cooke R., Pettini M., Steidel C. C., Rudie G. C., Nissen P. E., 2011, MNRAS, 417, 1534
- Cooksey et al. (2010) Cooksey K. L., Thom C., Prochaska J. X., Chen H-W., 2010, ApJ, 708, 868
- Cooksey et al. (2012) Cooksey K. L., Kao M. M., Simcoe R. A., O’Meara J. M., Prochaska J. X., 2012, ApJ submitted, arXiv:1204.2827
- D’Odorico et al. (2010) D’Odorico V., Calura F., Cristiani S., Viel M., 2010, MNRAS, 401, 2715
- D’Odorico et al. (2011) D’Odorico V. et al., 2011, Astron. Nachr., 332, 315 (Paper I)
- Danforth & Shull (2008) Danforth C. W. & Shull J. M., 2008, ApJ, 679, 194
- Dekker et al. (2000) Dekker H., D’Odorico S., Kaufer A., Delabre B., Kotzlowski H., 2000, Proc. SPIE, 4008, 534
- Díaz et al. (2011) Díaz C. G., Ryan-Weber E. V., Cooke J., Pettini M., Madau P., 2011, MNRAS 418, 820
- Fan, Carilli, Keating (2006) Fan X., CarilliC. L., Keating B., 2006, ARA&A, 44, 415
- Fan et al. (2006) Fan X. et al., 2006, AJ, 131, 1203
- Fan et al. (2001) Fan X. et al., 2001, AJ, 122, 2833
- Faucher-Giguère et al (2008) Faucher-Giguère C., Lidz A., Hernquist L. Zaldarriaga M., 2008, ApJL, 682, 9
- Ferland et al. (1998) Ferland G. J., Korista K.T., Verner D.A., Ferguson J.W., Kingdon J.B., Verner E.M, 1998, PASP, 110, 761
- Fontana & Ballester (1995) Fontana, A., Ballester, P., 1995, The Messenger, 80, 37
- Giroux & Shull (1997) Giroux M. L., Shull J. M., 1997, AJ, 113, 1505
- Gnedin (2000) Gnedin N. Y., 2000, ApJ 535, 530
- Goldoni et al (2006) Goldoni P., Royer F., Francois P., Horrobin M., Blanc G., Vernet J., Modigliani A., Larsen J., 2006, Proc. SPIE, 6269, 80
- Gonzàlez et al. (2010) Gonzàlez V., Labbé I., Bouwens R. J., Illingworth G., Franx M., Kriek M., Brammer G. B., 2010, ApJ, 713, 115
- Haardt & Madau (2001) Haardt F., Madau P., 2001 in Neumann D. M., Van J. T. T., eds, Proc. 36th Rencontres de Moriond, Clusters of Galaxies and the High Redshift Universe Observed in X-rays: Recent Results of XMM-Newton and Chandra, CEA, Saclay, 64
- Haehnelt et al. (2001) Haehnelt M. G., Madau P., Kudritzki R., Haardt F., 2001, ApJL, 549, 151
- Jiang et al. (2007) Jiang L., Fan X., Vestergaard M., Kurk J. D., Walter F., Kelly B. C., Strauss M. A., 2007, AJ, 134, 1150
- Kelson (2003) Kelson D. D., 2003, PASP, 115, 688
- Kim et al. (2002) Kim T.-S., Cristiani S., D’Odorico S., 2002, A&A, 383, 747
- Kurk et al. (2007) Kurk J. D. et al., 2007, ApJ, 669, 32
- Madau et al. (2001) Madau P., Ferrara A., Rees M. J., 2001, ApJ, 555, 92
- Madau et al. (1999) Madau P., Haardt F., Rees M. J., 1999, ApJ, 514, 648
- Mannucci et al. (2007) Mannucci F., Buttery H., Maiolino R., Marconi A., Pozzetti L., 2007, A&A, 461, 423
- Meiksin (2005) Meiksin A., 2005, MNRAS, 356, 596
- Mortlock et al. (2009) Mortlock D. J. et al., 2009, A&A, 505, 97
- Mortlock et al. (2011) Mortlock D. J. et al. 2011, Nature, 474, 616
- Oppenheimer & Davé (2006) Oppenheimer B.D., Davé R., 2006, MNRAS, 373, 1265
- Pettini et al. (2003) Pettini M., Madau P., Bolte M., Prochaska J.X., Ellison S.L., Fan X., 2003, ApJ, 594, 695 (Pettini03)
- Robertson et al. (2010) Robertson B. E., Ellis R. S., Dunlop J. S., McLure R. J., Stark D. P., 2010, Nature, 468, 49
- Ryan-Weber et al. (2009) Ryan-Weber E. V., Pettini, M., Madau P., Berkeley J. Z., 2009, MNRAS, 395, 1476
- Ryan-Weber et al. (2006) Ryan-Weber E. V., Pettini, M., Madau P., 2006, MNRAS, 371, L78
- Savaglio et al. (1997) Savaglio S., Cristiani S., D’Odorico S., Fontana A., Giallongo E., Molaro P., 1997, A&A, 318, 347
- Simcoe (2006) Simcoe R. A., 2006, ApJ, 653, 977
- Simcoe et al. (2010) Simcoe R. A. et al., 2010, Proc. SPIE, 7735, 38
- Simcoe et al. (2011) Simcoe R. A. et al., 2011, ApJ, 743, 21 (Simcoe11)
- Songaila & Cowie (2002) Songaila A., Cowie L. L., 2002, AJ, 123 2183
- Songaila (1998) Songaila A., 1998, AJ, 115, 2184
- Storrie-Lombardi et al (1996) Storrie-Lombardi L., McMahon R.G., Irwin M., 1996, MNRAS, 283, 79
- Tescari et al. (2011) Tescari E., Viel M., D’Odorico V., Cristiani S., Calura F., Borgani S., Tornatore L., 2011, MNRAS, 411, 826
- Tytler (1987) Tytler D., 1987, ApJ, 321, 49
- Vanzella et al. (2012a) Vanzella E. et al., 2012, MNRAS, 424, L54
- Vanzella et al. (2012b) Vanzella E. et al., 2012, ApJ, 751, 70
- Vernet et al. (2011) Vernet J. et al. 2011, A&A, 536, 105
- Willott et al (2007) Willott C. J. et al. 2007, AJ, 134, 2435
- Wyithe & Loeb (2003) Wyithe J. S. B., Loeb A., 2003, ApJ, 586, 693
Appendix A C iv and Si iv absorptions in the X-shooter spectra of the QSOs at
| System | Ion | ||||
|---|---|---|---|---|---|
| (Å) | (km s-1) | (cm-2) | |||
| 1 | C iv 1548 | ||||
| C iv 1550 | |||||
| 2 | C iv 1548 | ||||
| C iv 1550b | |||||
| 3 | C iv 1548b | ||||
| C iv 1550 | |||||
| 4 | C iv 1548 | ||||
| C iv 1550 | |||||
| 5 | C iv 1548 | ||||
| C iv 1550 | |||||
| 6 | C iv 1548 | 15 | |||
| C iv 1550 | |||||
| 7 | C iv 1548b | ||||
| C iv 1550 | |||||
| 8 | C iv 1548 | ||||
| C iv 1550 | |||||
| 9 | C iv 1548m | ||||
| C iv 1550m | |||||
| 9a | C iv | ||||
| 9b | C iv | ||||
| 9c | C iv | ||||
| 10 | C iv 1548 | ||||
| C iv 1550s | |||||
| 11 | C iv 1548 | ||||
| C iv 1550 | |||||
| 12 | C iv 1548 | ||||
| C iv 1550 | |||||
| 13 | C iv 1548 | ||||
| C iv 1550s | |||||
| Si iv | |||||
| 14 | C iv 1548 | ||||
| C iv 1550sb | |||||
| Si iv 1402 | |||||
| 15 | C iv 1548 | ||||
| C iv 1550 | |||||
| Si iv 1402 | |||||
| 16 | C iv 1548 | ||||
| C iv 1550 | |||||
| Si iv 1402 | |||||
| 17 | C iv 1548 | ||||
| C iv 1550 | |||||
| Si iv | |||||
| 18 | C iv 1548 | ||||
| C iv 1550 | |||||
| Si iv 1393 | |||||
| Si iv 1402 | |||||
| 19 | C iv 1548s | ||||
| C iv 1550 | |||||
| Si iv | |||||
| 20 | C iv 1548s | ||||
| C iv 1550s | |||||
| Si iv | |||||
| C ii 1334 | |||||
| 21 | C iv 1548 | ||||
| C iv 1550 | |||||
| Si iv 1393 | |||||
| Si iv 1402 | |||||
| C ii 1334 | |||||
| 22 | C iv 1548s | ||||
| C iv 1550 | |||||
| Si iv | |||||
| C ii 1334 |
Notes. b: Line blended with another absorption line; m: multiple components; s: line contaminated by a sky emission line; l: feature below detection.
| System | Ion | ||||
|---|---|---|---|---|---|
| (Å) | (km s-1) | (cm-2) | |||
| 1 | C iv 1548 | ||||
| C iv 1550b | |||||
| 2 | C iv 1548 | ||||
| C iv 1550 | |||||
| 3 | C iv 1548 | ||||
| C iv 1550 | |||||
| 4 | C iv 1548mb | ||||
| C iv 1550m | |||||
| 4a | C iv | ||||
| 4b | C iv | ||||
| 5 | C iv 1548b | 15 | |||
| C iv 1550b | |||||
| 6 | C iv 1548 | ||||
| C iv 1550 | |||||
| 7 | C iv 1548 | ||||
| C iv 1550 | |||||
| Si iv 1393 | |||||
| Si iv 1402l | |||||
| 8 | C iv 1548 | ||||
| C iv 1550 | |||||
| Si iv 1393 | |||||
| Si iv 1402 | |||||
| 9 | C iv 1548 | ||||
| C iv 1550 | |||||
| Si iv 1393 | |||||
| Si iv 1402 | |||||
| 10 | C iv 1548m | ||||
| C iv 1550m | |||||
| Si iv 1393m | |||||
| Si iv 1402m | |||||
| 10a | C iv | ||||
| Si iv | |||||
| 10b | C iv | 10 | |||
| Si iv | 10 | ||||
| 11 | C iv 1548b | 33 | |||
| C iv 1550b | |||||
| Si iv 1393 | |||||
| Si iv 1402 | |||||
| 12 | C iv 1548b | 20 | |||
| C iv 1550b | |||||
| Si iv 1393 | |||||
| Si iv 1402 | |||||
| 13 | C iv 1548 | ||||
| C iv 1550 | |||||
| Si iv 1393 | |||||
| Si iv 1402s | |||||
| C ii 1334 |
Notes. b: Line blended with another absorption line; m: multiple components; s: line contaminated by a sky emission line; l: feature below detection.
| System | Ion | ||||
|---|---|---|---|---|---|
| (Å) | (km s-1) | (cm-2) | |||
| 1 | C iv 1548 | ||||
| C iv 1550b | |||||
| 2 | C iv 1548b | ||||
| C iv 1550l | |||||
| 3 | C iv 1548b | ||||
| C iv 1550 | |||||
| 4 | C iv 1548 | ||||
| C iv 1550b | |||||
| 5 | C iv 1548 | ||||
| C iv 1550 | |||||
| 6 | C iv 1548m | ||||
| C iv 1550m | |||||
| 6a | C iv | ||||
| 6b | C iv | ||||
| 7 | C iv 1548m | ||||
| C iv 1550ms | |||||
| Si iv 1393m | |||||
| Si iv 1402m | |||||
| 7a | C iv | 34 | |||
| Si iv | |||||
| 7b | C iv | ||||
| Si iv | |||||
| 8 | C iv 1548 | ||||
| C iv 1550 | |||||
| Si iv | |||||
| C ii 1334 | |||||
| 9 | C iv 1548m | ||||
| C iv 1550m | |||||
| Si iv 1393m | |||||
| Si iv 1402mb | |||||
| 9a | C iv | ||||
| Si iv | |||||
| C ii 1334 | |||||
| 9b | C iv | ||||
| Si iv | |||||
| C ii 1334 | |||||
| 10 | C iv 1548l | 15 | |||
| C iv 1550l | |||||
| Si iv | |||||
| C ii 1334 | |||||
| 11 | C iv 1548l | 15 | |||
| C iv 1550l | |||||
| Si iv 1393l | 15 | ||||
| Si iv 1402l | |||||
| C ii 1334 |
Notes. b: Line blended with another absorption line; m: multiple components; s: line contaminated by a sky emission line; l: feature below detection.
| System | Ion | ||||
|---|---|---|---|---|---|
| (Å) | (km s-1) | (cm-2) | |||
| 1 | C iv 1548m | ||||
| C iv 1550mb | |||||
| 1a | C iv | ||||
| 1b | C iv | 15 | |||
| 2 | C iv 1548 | ||||
| C iv 1550s | |||||
| 3 | C iv 1548m | ||||
| C iv 1550m | |||||
| 3a | C iv | ||||
| 3b | C iv | ||||
| 3c | C iv | ||||
| 4 | C iv 1548 | ||||
| C iv 1550 | |||||
| 5 | C iv 1548m | ||||
| C iv 1550m | |||||
| 5a | C iv | ||||
| 5b | C iv | ||||
| 5c | C iv | ||||
| 6 | C iv 1548 | ||||
| C iv 1550b | |||||
| 7 | C iv 1548b | ||||
| C iv 1550 | |||||
| 8 | C iv 1548 | ||||
| C iv 1550 | |||||
| 9 | C iv 1548m | ||||
| C iv 1550m | |||||
| 9a | C iv | 50 | |||
| 9b | C iv | ||||
| 9c | C iv | ||||
| 9d | C iv | ||||
| 9e | C iv | ||||
| 9f | C iv | ||||
| 9g | C iv | ||||
| 9h | C iv | ||||
| 9i | C iv | ||||
| 10 | C iv 1548m | ||||
| C iv 1550m | |||||
| 10a | C iv | 10 | |||
| 10b | C iv | ||||
| 10c | C iv | ||||
| 11 | C iv 1548b | ||||
| C iv 1550 | |||||
| 12 | C iv 1548 | ||||
| C iv 1550b |
Notes. b: Line blended with another absorption line; m: multiple components; s: line contaminated by a sky emission line; l: feature below detection.
| System | Ion | ||||
|---|---|---|---|---|---|
| (Å) | (km s-1) | (cm-2) | |||
| 1 | C iv 1548 | ||||
| C iv 1550 | |||||
| 2 | C iv 1548 | ||||
| C iv 1550b | |||||
| 3 | C iv 1548 | ||||
| C iv 1550b | |||||
| 4 | C iv 1548b | ||||
| C iv 1550b | |||||
| 5 | C iv 1548mb | ||||
| C iv 1550mb | |||||
| 5a | C iv | 10 | |||
| 5b | C iv | ||||
| 5c | C iv | ||||
| 5d | C iv | ||||
| 6 | C iv 1548s | ||||
| C iv 1550 | |||||
| 7 | C iv 1548m | ||||
| C iv 1550m | |||||
| 7a | C iv | ||||
| 7b | C iv | ||||
| 8 | C iv 1548m | ||||
| C iv 1550ms | |||||
| Si iv 1393m | |||||
| Si iv 1402mb | |||||
| 8a | C iv | ||||
| Si iv | |||||
| 8b | C iv | ||||
| Si iv | |||||
| 9 | C iv 1548 | ||||
| C iv 1550 | |||||
| Si iv 1393m | |||||
| Si iv 1402m | |||||
| 9a | Si iv | ||||
| 9b | Si iv | ||||
| 10 | C iv 1548s | ||||
| C iv 1550s | |||||
| Si iv 1393 | |||||
| Si iv 1402 | |||||
| C ii 1334 | |||||
| 11 | C iv 1548s | ||||
| C iv 1550s | |||||
| Si iv 1393m | |||||
| Si iv 1402m | |||||
| C ii 1334 | |||||
| 11a | Si iv | ||||
| 11b | Si iv |
Notes. b: Line blended with another absorption line; m: multiple components; s: line contaminated by a sky emission line; l: feature below detection.
| System | Ion | ||||
|---|---|---|---|---|---|
| (Å) | (km s-1) | (cm-2) | |||
| 1 | C iv 1548 | ||||
| C iv 1550 | |||||
| 2 | C iv 1548a | ||||
| C iv 1550b | |||||
| 3 | C iv 1548ba | ||||
| C iv 1550s | |||||
| 4 | C iv 1548a | ||||
| C iv 1550s | |||||
| 6 | C iv 1548a | ||||
| C iv 1550 | |||||
| 7 | C iv 1548 | ||||
| C iv 1550s | |||||
| 8 | C iv 1548 | ||||
| C iv 1550 | |||||
| 9 | C iv 1548sb | ||||
| C iv 1550 | |||||
| 10 | C iv 1548sb | ||||
| C iv 1550s | |||||
| Si iv 1393 | |||||
| Si iv 1402s | |||||
| C ii 1334 |
Notes. b: Line blended with another absorption line; m: multiple components; s: line contaminated by a sky emission line; l: feature below detection. aWe found an alternative identification for this line: it could be Al iii at . bThe line could be saturated
Appendix B Other Absorption Systems
B.1 SDSS J0818+1722
B.2 SDSS J0836+0054
B.3 SDSS J1030+0524
B.4 SDSS J1306+0356
B.5 ULAS J1319+0950
B.6 CFHQS J1509-1749