On the formation time scale of massive cluster ellipticals
based on deep near-IR spectroscopy at
Abstract
We present improved constraints on the formation time scale of massive cluster galaxies based on rest-frame optical spectra of galaxies in a forming cluster located at . The spectra are obtained with MOIRCS on the Subaru telescope with an integration time of hours. We achieve accurate redshift measurements by fitting SEDs using the spectra and broad-band photometry simultaneously, allowing us to identify probable cluster members. Clusters at low redshifts are dominated by quiescent galaxies, but we find that quiescent galaxies and star forming galaxies co-exist in this system. Interestingly, the quiescent galaxies form a weak red sequence in the process of forming. By stacking the spectra of star forming galaxies, we observe strong emission lines such as [oii] and [oiii] and we obtain a tentative hint of AGN activities in these galaxies. On the other hand, the stacked spectrum of the quiescent galaxies reveals a clear 4000 break with a possible CaII H+K absorption feature and strong emission lines such as [oii] are absent in the spectrum, confirming the quiescent nature of these galaxies. We then perform detailed spectral analyses of the stacked spectrum, which suggest that these massive quiescent galaxies formed at redshifts between 3 and 4 on a time scale of Gyr. This short formation time scale is not reproduced in recent numerical simulations. We discuss possible mechanisms for how these galaxies form stellar mass on a short time scale and become red and quiescent by .
Subject headings:
galaxies: general — galaxies: formation — galaxies: evolution — galaxies: clusters: individual (PKS1138-262)1. Introduction
Massive early-type galaxies in the local universe have long been known to show surprisingly tight scaling relations such as Faber-Jackson relation (Faber & Jackson, 1976), or more generally, fundamental plane (Djorgovski & Davis, 1987; Jorgensen et al., 1996), as well as red sequence (Baum, 1959). These observations suggest that early-type galaxies are a fairly homogeneous population and they are thought to form in an intense starburst in their initial phase, followed by passive evolution. The seminal work of the galactic-wind model by Arimoto & Yoshii (1987) is among the first successful theoretical attempts to reproduce the observed properties of early-type galaxies in the local universe such as the mass-metallicity relation.
This simple picture of early-type galaxy formation is supported by the observation that the single-burst passive evolution model is able to reproduce the observed location of the red sequence even in clusters (e.g., Stanford et al. 1998; Mei et al. 2009). Detailed absorption line studies of nearby early-type galaxies lends a further support. Alpha elements are primarily released in type-II supernova explosions, which occur on a short time scale. On the other hand, iron-peaked elements are primarily produced by type-Ia supernovae, which are thought to occur with a delay time of Gyr. The observed [/Fe] enhancement at high mass (e.g., Nelan et al. 2005) is often interpreted as massive galaxies being formed on a fairly short time scale at high redshifts (Thomas et al., 2005) so that type-Ia supernovae do not significantly contribute to the overall metal enrichment, although [/Fe] is also sensitive to IMF.
This picture nicely fits within the framework of a top-down galaxy formation scenario. However, the widely accepted CDM cosmology naturally predicts bottom-up galaxy formation. This bottom-up scenario might appear to confront with the simple observational picture above, but De Lucia et al. (2006) presented a semi-analytic model of galaxy formation built upon the Millennium simulation (Springel et al., 2005a) and showed that the hierarchical model can reproduce the observed old stellar population of massive early-type galaxies today. In their model, galaxies do assemble hierarchically, but most stars that are in massive galaxies at formed early and the stellar population is thus old. An extreme example of this hierarchical assembly presented by De Lucia & Blaizot (2007) is that the most massive galaxies today has acquired 80% of their mass below redshift of unity. Deep imaging observations of nearby elliptical galaxies often unveil tidal features around them, which support the picture of growing early-type galaxies at low redshifts (e.g., van Dokkum 2005; Tal et al. 2009). We are starting to understand the galaxy formation in the hierarchical universe, but theoretical models in this context still do not fully reproduce the observed mass growth of galaxies (e.g., Guo et al. 2011) and the massive galaxy formation still remains one of the major issues.
Recent advent of sensitive near-IR spectrographs on large aperture telescopes has opened a new window in this area. Imaging observations have shown that many of the massive galaxies in the field at are actively forming stars, but quiescent galaxies do exist (e.g., Cimatti et al. 2004; Förster Schreiber et al. 2004; Daddi et al. 2005; Williams et al. 2009; Brammer et al. 2011; Wuyts et al. 2011). Deep near-IR spectroscopy of these quiescent galaxies has revealed their evolved stellar populations. Kriek et al. (2006) performed near-IR spectroscopy of galaxies in order to probe their rest-frame optical light and showed that roughly half of the galaxies they observed have suppressed star formation. Ultradeep spectroscopy of a galaxy by Kriek et al. (2008) showed a pronounced 4000Å break. Gobat et al. (2012) and Onodera et al. (2012) also presented deep near-IR spectroscopy, and recently, X-shooter has started producing high-quality spectra of galaxies with clear detections of absorption features (e.g., Toft et al. 2012; van de Sande et al. 2012) and the number of such spectra is fast growing.
So far, most of the work on massive galaxies are based on data in blank fields and the nature of massive cluster galaxies remains unclear. But, high- clusters are an interesting site to study the formation of massive ellipticals given the prominent red sequence in local clusters. Also, they will provide a key to understanding the origin of the environmental dependence of galaxy properties observed at low redshifts (e.g., Lewis et al. 2002; Gómez et al. 2003; Tanaka et al. 2004). Dedicated effort has identified a number of high redshift groups and clusters of galaxies at (e.g., Kurk et al. 2009; Tanaka et al. 2010a; Fassbender et al. 2011; Gobat et al. 2011; Nastasi et al. 2011; Santos et al. 2011; Spitler et al. 2012; Stanford et al. 2012; Muzzin et al. 2013; Tanaka et al. 2013). Among them, a group, which is likely a progenitor of a today’s massive cluster, is carefully studied by Tanaka et al. (2013) and they showed that the group already exhibits a prominent red sequence of quiescent early-type galaxies formed at (SSP-equivalent). This adds further evidence that at least a fraction of today’s massive cluster ellipticals passively evolve since an early epoch. Higher redshift galaxies have stronger constraining power on their own formation process, and in this paper, we focus on a forming cluster at . We refer the reader to Strazzullo et al. (2013) and Gobat et al. (2013) for recent work on a cluster.
PKS1138-26 is a powerful radio galaxy located at and it has been intensively studied by many authors, providing robust evidence for a forming cluster (Pentericci et al., 1997, 1998; Kurk et al., 2000; Pentericci et al., 2002; Kurk et al., 2004a, b; Croft et al., 2005; Miley et al., 2006; Kodama et al., 2007; Zirm et al., 2008; Hatch et al., 2008, 2009; Doherty et al., 2010; Tanaka et al., 2010b; Koyama et al., 2013). A wealth of imaging data as well as a large number of spectroscopic redshifts are available in this field, making it an unique place to investigate the question raised above. We present deep near-IR spectroscopy of galaxies in this proto-cluster and study galaxy populations in detail with an emphasis on the formation of massive cluster ellipticals.
The paper is organized as follows. We summarize the data used in this work in section 2. We perform SED fitting using spectroscopic and photometric data in this paper and the procedure is described in section 3, followed by the results from the SED fitting in section 4. We discuss the nature of star forming members by stacking their spectra in section 5. We then turn our attention to massive quiescent members and perform spectral analyses to constrain the stellar population and formation time scale of these massive galaxies using a stacked spectrum in section 6. We summarize and discuss the implications of our findings in section 7. Throughout the paper, we assume a flat universe with and with (Komatsu et al., 2011). Magnitudes are in the AB system.
2. Data
2.1. Multi-wavelength catalog of PKS1138
A deep multi-wavelength data set is available in the field of the radio galaxy PKS1138 at . The field has been imaged with LRIS on Keck (-band; Zirm et al. 2008), FORS on VLT ( and ), ACS on HST ( and ; Miley et al. 2006), MOIRCS on Subaru ( and ; Kodama et al. 2007), SOFI on NTT (; Kodama et al. 2007), and IRAC on Spitzer (; Seymour et al. 2007). We base our analysis on an updated version of the multi-band catalog presented in Tanaka et al. (2010b). We primarily used MAG_AUTO from Source Extractor (Bertin & Arnouts, 1996) in the original catalog, but this resulted in somewhat erroneous photometry particularly for faint objects. We instead smooth all the images to the worst seeing of 1.2 arcsec and perform aperture photometry in dual image mode to derive colors. All the objects are selected in the unsmoothed -band. Aperture correction is derived by comparing MAG_AUTO and aperture magnitudes in the band and has been applied to all the other bands.
2.2. MOIRCS Observation and Data Reduction
We used MOIRCS on the Subaru Telescope (Ichikawa et al., 2006; Suzuki et al., 2008) to perform a near-IR follow-up spectroscopy of the galaxies in PKS1138. The targets for spectroscopy were selected by photometric redshifts ( hereafter) in Tanaka et al. (2010b). We first applied a -band magnitude cut of to ensure that we do not observe spurious objects. Galaxies that are consistent with being at the cluster redshift within were selected as primary targets for spectroscopy. We further gave a priority to red objects in the color because their are likely more precise and we are particularly interested in constraining the formation history of the oldest, most massive cluster galaxies. In areas of the MOIRCS field with no suitable targets (about 10% of the field of view), we filled the mask with random objects, which in the end serve as a good control sample to estimate our redshift accuracy. We targeted 38 objects in total, of which 34 are photo- selected galaxies. Among them, 13 have a red color with . Only this one mask was observed in our run.
The observations were carried out on the 4th and 8th Feb. 2011. The conditions were photometric and seeing was good (0.6-0.8 arcsec) on both nights. We used slits with the zJ500 grism, which provides a wavelength coverage of 0.9-1.7 with a resolving power of . The data reduction was performed in a standard manner using the custom-designed code described in Tanaka et al. (2009). After the dark subtraction, the frames were cut into individual slits and flat-fielding was performed. We measured relative spatial offsets between the exposures using a bright star in the mask. As most of the objects were not readily visible in each exposure, we first stacked all the exposures to measure a trace of an object. We then extracted objects in each exposure using that trace shifted by the spatial offsets measured off the bright star. Finally, the extracted spectra were combined with weights computed with the flux of the bright star, which effectively accounted for both seeing and atmospheric transparency variations. The wavelength was calibrated against the sky lines and the flux was calibrated against A0V stars. Telluric absorptions were corrected for in each exposure using a bright star observed in the same mask. We note that the spectral fluxes are not calibrated in the absolute sense at this point due to the slit loss. The total science integration time amounted to 6.8 hours.
Among 38 objects that we observed, we were able to extract spectra for 30 of them and we have visually inspected all of them. Even with the long integration on an 8m telescope, a typical S/N of the spectra is too low ( per resolution element) to directly measure redshifts via absorption features. Seven objects show multiple emission lines and their redshifts can be derived. Five objects show only a single emission line and the line is not uniquely identified. Such a line is probably a strong line such as [oii], [oiii] or H. We choose the most probable line among them using spectrophotometric redshifts measured in Section 3. We cannot measure secure redshifts for the rest of the objects. We present a list of measured redshifts in Table 1 along with spectroscopic redshifts from the literature where available (Pentericci et al., 2000; Kurk et al., 2004a; Croft et al., 2005; Doherty et al., 2010). Note that our redshift for ID=537 is inconsistent with the literature redshift, but our redshift is not a secure redshift. The spectra with measured redshifts (both secure and possible redshifts) are presented in Appendix.
| ID | R.A. | Dec. | SFR | ||||||||
|---|---|---|---|---|---|---|---|---|---|---|---|
| 60 | 22.42 | 1.175 | 0 | — | |||||||
| 61 | 21.84 | 0.832 | 0 | — | |||||||
| 63 | 19.87 | — | — | — | |||||||
| 65 | 21.59 | — | — | — | |||||||
| 113 | 22.28 | 2.348 | 0 | — | |||||||
| 172 | 21.87 | — | — | — | |||||||
| 206 | 22.67 | 0.842 | 9 | — | |||||||
| 280 | 22.15 | 2.062 | 9 | — | |||||||
| 286 | 21.95 | — | — | — | |||||||
| 312 | 22.85 | 1.568 | 9 | — | |||||||
| 329 | 22.76 | 1.667 | 0 | — | |||||||
| 333 | 21.34 | — | — | — | |||||||
| 399 | 20.96 | — | — | 2.162 | |||||||
| 435 | 22.33 | 2.037 | 9 | — | |||||||
| 443 | 21.13 | 1.615 | 0 | — | |||||||
| 445 | 21.68 | — | — | — | |||||||
| 455 | 20.39 | — | — | — | |||||||
| 491 | 20.78 | 2.162 | 1 | 2.172 | |||||||
| 493 | 21.41 | — | — | — | |||||||
| 534 | 22.57 | 1.615 | 9 | — | |||||||
| 537 | 20.44 | 1.335 | 1 | 2.1568 | |||||||
| 548 | 21.63 | 2.547 | 0 | — | |||||||
| 559 | 21.51 | — | — | 2.162 | |||||||
| 582 | 21.95 | 2.155 | 0 | 2.1546 | |||||||
| 593 | 20.86 | — | — | — | |||||||
| 635 | 20.91 | — | — | 2.152 | |||||||
| 669 | 23.42 | — | — | — | |||||||
| 705 | 22.05 | — | — | — | |||||||
| 760 | 22.35 | — | — | — | |||||||
| 826 | 21.93 | — | — | — |
3. Spectral Energy Distribution Fitting
As mentioned in the last section, a large fraction of the MOIRCS spectra is not of sufficient quality to measure redshifts using absorption features. As a result, we cannot determine precise redshifts for quiescent galaxies. However, we can still determine fairly accurate redshifts as well as physical properties of these galaxies using continuum features in the spectra such as the 4000 break when combined with the broad-band photometry. This technique has been demonstrated by Kriek et al. (2006) and Kriek et al. (2008). We measure an inverse-variance weighted mean flux of the observed spectra in 300 bins starting from 0.9 to 1.7. The observed spectra are not flux-calibrated in the absolute sense due to the slit loss. We compute the slit loss by comparing the broad-band and -band photometry with the photometry synthesized with the observed spectra. We take the average of the slit loss in the and -band for most objects. For a small number of objects, either or -band is not fully covered in the spectra due to the slit positions, and we use either one of the bands to compute the slit loss. A typical amount of the slit loss is about 40%.
We follow the standard procedure for the SED fitting. We use an updated version of the Bruzual & Charlot (2003) code, which includes an improved treatment of thermally pulsating AGB stars111 Although the details of the improvements have not yet been published, the model incorporates a prescription of thermally pulsating AGB stars of Marigo & Girardi (2007) (see section 5.2 of Eminian et al. 2008). , to generate model templates of galaxies. We assume the Chabrier initial mass function and solar metallicity. We adopt the -model for star formation histories of galaxies with allowed to vary between 0 and infinity. Dust extinction is applied to the templates assuming the Calzetti attenuation curve (Calzetti et al., 2000). Emission lines are added to the spectra using the emission line intensity ratios given in Inoue (2011) assuming the Calzetti (1997) attenuation law. Each template is convolved with the response functions of all the filters (including the atmosphere for ground-based facilities). For the binned spectra, we use a top-hat function to synthesize fluxes.
The observed SEDs are fit with the model templates using the standard minimization technique. We apply a template error function in order to reduce systematics between the model templates and real SEDs of galaxies and also to assign uncertainties to the model templates as a function of rest-frame wavelength. We use the same template error function as in Tanaka et al. (2013) (for details, refer to the Appendix B of that paper). The model templates have 4 free parameters: redshift, star formation time scale (), extinction (), and age. Stellar mass and SFR can be computed from the combination of redshift, , and age. The fits thus produce multi-parameter probability space. In this probability space, each parameters are marginalized over all the other parameters and we use the median of the probability distribution as the central value and quote 68% interval around it as an uncertainty. Our estimates of the physical parameters thus properly include uncertainties in redshift.
As mentioned above, we bin the spectra into . From a statistics point of view, one does not necessarily have to bin the spectra. Fitting the unbinned spectra together with the broad-band photometry may be more straightforward. We find that, in our case, fits to unbinned spectra often result in catastrophic outliers in redshift with unrealistically small uncertainties. We suspect that this likely comes from non-Gaussian nature of the noise property of our spectra. Our spectral resolution is very low and sky emission lines often overlap each other in near-IR. It is not surprising if we have under/over subtracted the sky lines, which would introduce non-Gaussianity in the noise characteristics of the spectra. A flux calibration error and small offsets in object traces used for the 1D extraction, especially at the edges of the covered wavelength range, are also sources of systematics. To reduce the systematic errors, we bin the spectra by clipping outliers in each bin. To be specific, we clip top 10% and bottom 10% distribution of the fluxes in each bin and use the rest to compute the weighted average. This binning at the same time loses wavelength resolution. We would like to keep the resolution, while having the bin size wide enough to reduce the systematics. Our bin size is a compromise between them. We have confirmed that our results do not significantly change if we change the bin size by a factor of 1.5 (i.e., or ).
We denote photometric redshifts based on broad-band data only as and those based on both broad-band photometry and binned spectra as in what follows. Koo (1999) suggested to use the term photometric redshifts for those based on photometry with a spectral resolution of . Our binned spectra have a higher resolution and we use the term just to distinguish it from . It will be instructive to compare redshifts and physical parameters estimated with and without the binned spectra and we briefly summarize how the binned spectra improve them in Appendix.
4. Results
4.1. Redshift distribution
We have performed the SED fitting using the broad-band photometry and the binned spectra for all of the objects for which we are able to extract the spectra. We first investigate how accurate our spectro-photometric redshifts () are and then move on to discuss detailed physical properties of the galaxies in the proto-cluster.
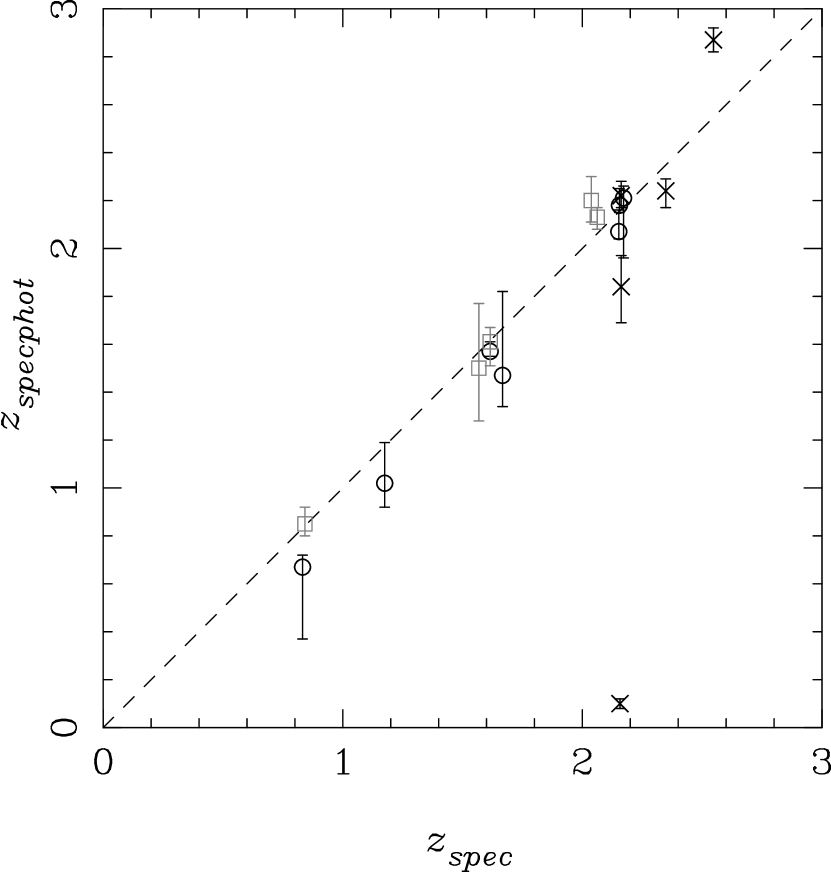
Fig. 1 compares and . In general, the agreement between them is fairly good, except for AGNs. This is not surprising because we did not include AGN templates in the SED fitting. If we do so, for normal galaxies tends to degrade and we choose not to include AGN templates. We measure the accuracy of to be . This may not appear as good as one might expect, but this accuracy is for faint galaxies with , while photo- accuracies quoted in the literature often include much brighter galaxies.
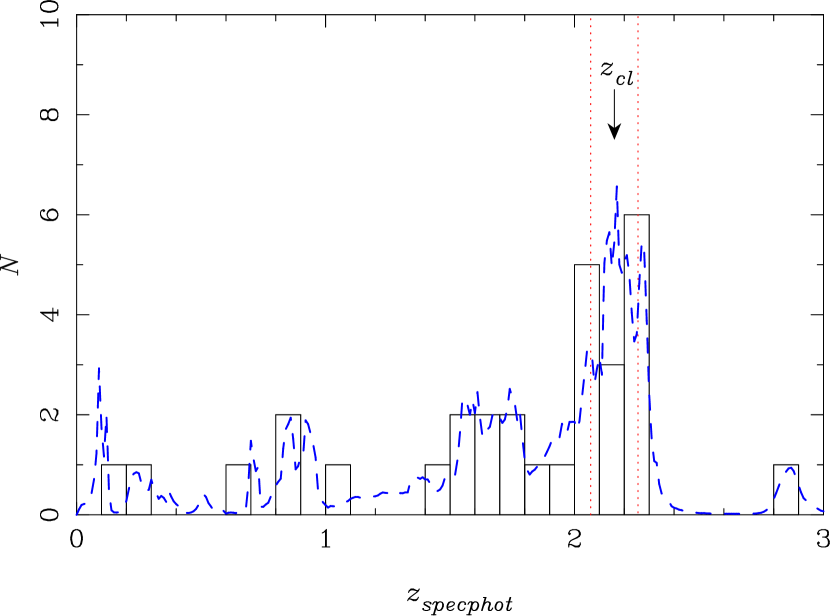
Fig. 2 presents distribution of all the objects we observed. A half of the observed galaxies are clustered around the cluster redshift of . This is particularly clear in the full distribution and a sharp peak is observed at the cluster redshift. The peak is partly due to the fact that we pre-selected member candidates using , but the range in used for the target selection is typically which is wider than the redshift spike observed here. This likely represents a large-scale structure and/or galaxy concentration at the cluster redshift.
We define a proto-cluster membership candidate using the photo- probability distribution function (PDF). To be specific, we apply the following criterion:
| (1) |
where is the proto-cluster redshift of and is the photo- PDF. Note that we take the redshift of the radio galaxy (van Ojik, 1995) as the proto-cluster redshift here. Our has as noted above and we adopt the range to integrate the PDF. If the integrated probability exceeds 0.16, we define the galaxy as a member candidate. This probability threshold is arbitrary, but if a galaxy is consistent with being at within , it is a candidate for group membership. Given the limited accuracy of our , we expect some contamination of near-foreground/background galaxies. We will estimate the amount of such contamination later.
Most objects at satisfies and they are the subject of this work. However, there are three objects that have but with spec-’s inconsistent with being cluster members (ID113, 280, and 435). We exclude them from the following analysis. There are two AGNs with spec-’s consistent with the cluster members, but we fail to obtain consistent due probably to the AGN contamination to the overall SEDs (ID=537 and 559). We could fit these objects with redshifts fixed to their spectroscopic redshifts to derive their physical properties, but the AGN contribution would still affect the measurement of SFR and stellar mass. We do not examine these galaxies either. This leaves us with 11 member candidates.
4.2. Comparison with H emitters
Among the 11 member candidates we have selected, only 2 have spec-’s from the literature and they are consistent with being the proto-cluster members. It would be useful to further check how well we can sample members with . Koyama et al. (2013) performed a narrow-band H observation of this proto-cluster and here we cross-match our member candidates with the H emitters. We note that their observation reaches to a dust-free SFR of (Kennicutt & Evans, 2012) and lower SFR galaxies will not be matched. Obviously, there are three categories to be looked at; (a) member candidates and H emitters, (b) member candidates, but not H emitters, and (c) not member candidates, but H emitters.
(a): 7 objects are both member candidates and H
emitters. They are thus very likely real members. As we will discuss
below, there are 4 quiescent members and one of them (ID=491) is
detected in H and falls
in this category. It may sound surprising that a quiescent galaxy
is detected in H, but this object hosts an AGN (Croft et al., 2005).
The AGN does not contribute significantly to the overall SED
and this galaxy is included in the analysis.
(b): 4 objects are member candidates, but not H emitters.
3 of them are quiescent galaxies with SFR
measured from the SED fitting.
Thus, the non-detection in H is consistent with that.
The fourth object (ID=286) is a star forming galaxy
with SFR and .
Taking into account the extinction, the uncertainty in
the expected H luminosity touches the observational detection limit.
This galaxy may be a near-field contaminant, but it may just have
weak H.
(c): Two H emitters are not member candidates,
but they are the AGNs mentioned above for which we fail to
obtain correct . These objects are excluded from the main analysis.
Overall, our member selection works well. Of the 11 member candidates with , 7 are detected in H. The remaining 4 galaxies are mostly quiescent galaxies and no H detections are expected. This is an encouraging result and it motivates us to study the physical properties of the member candidates in detail.
4.3. SEDs of the member candidates
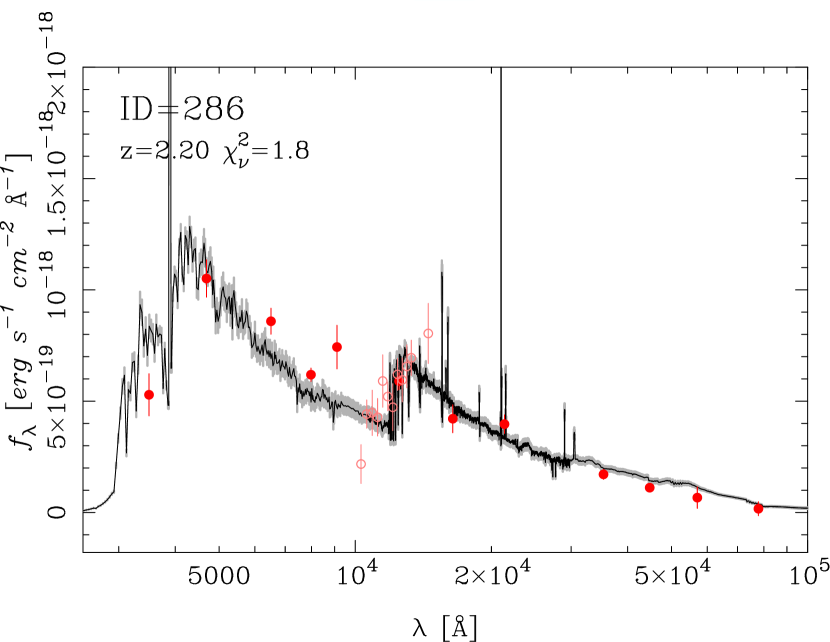
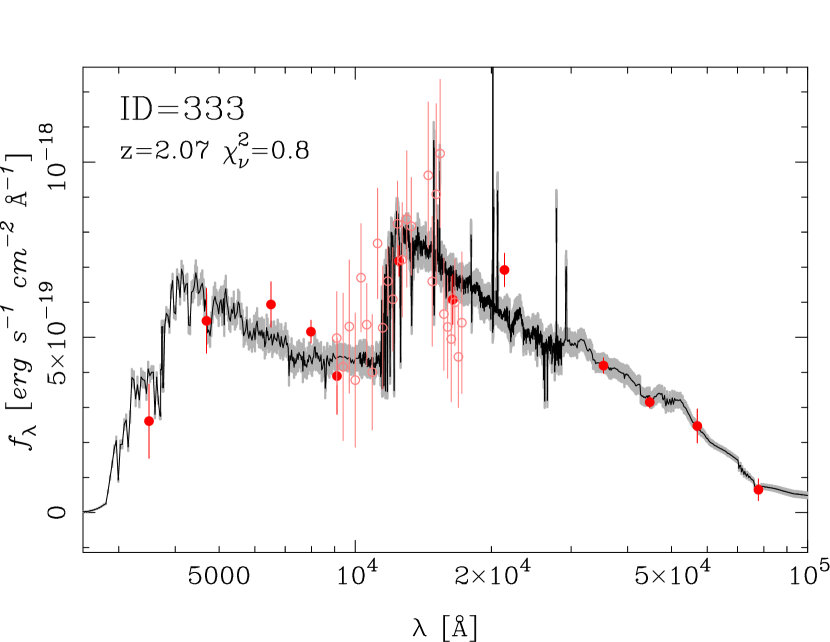
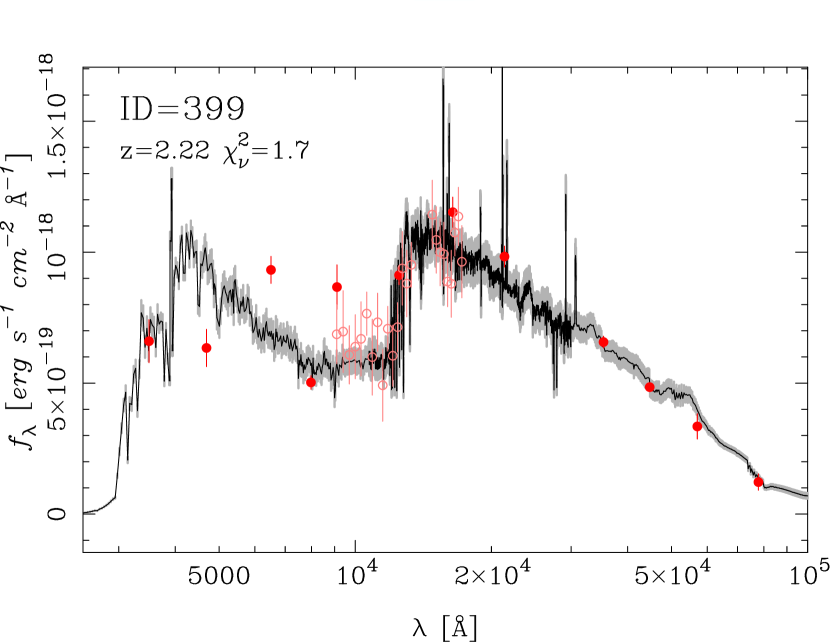
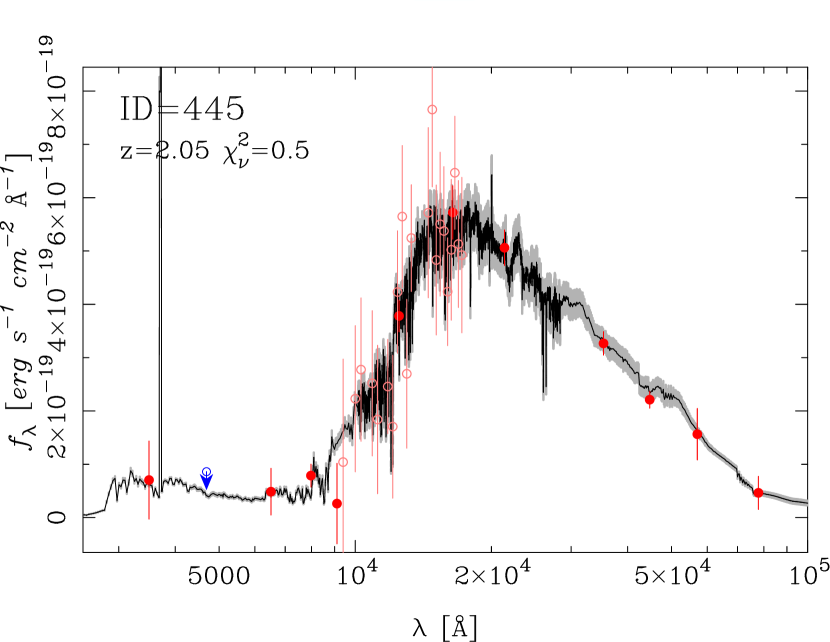
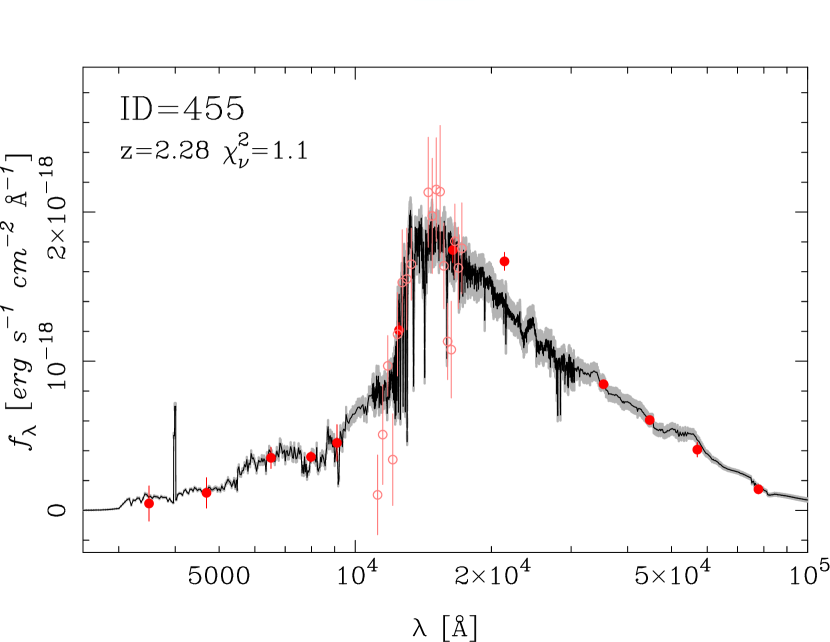
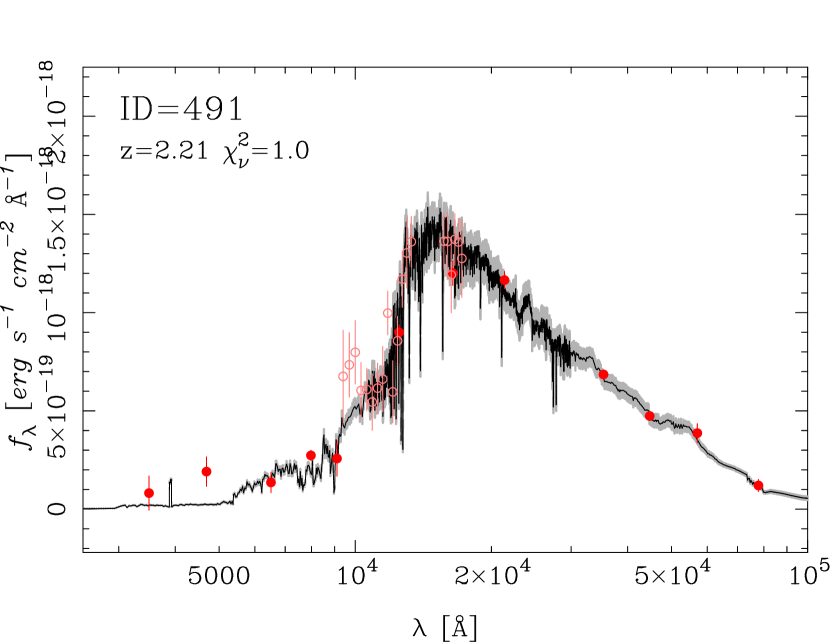
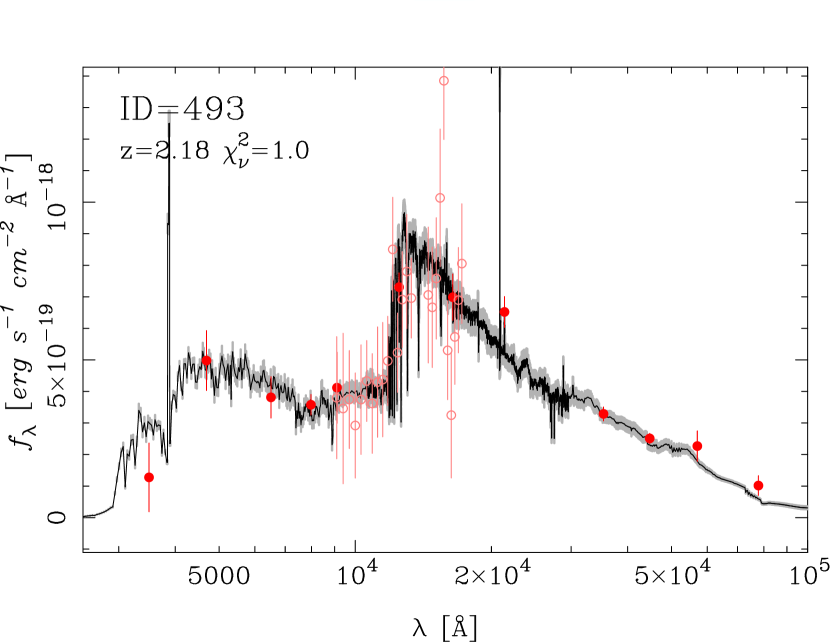
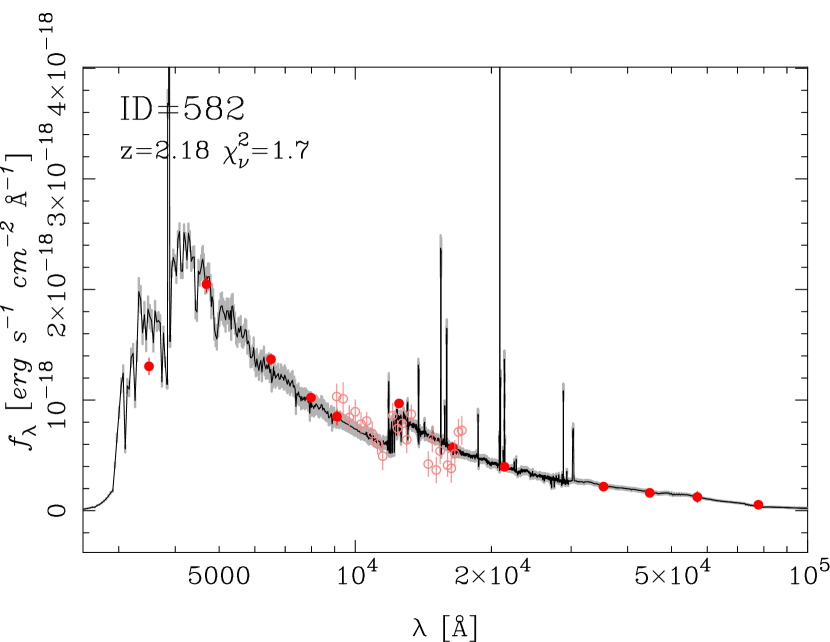
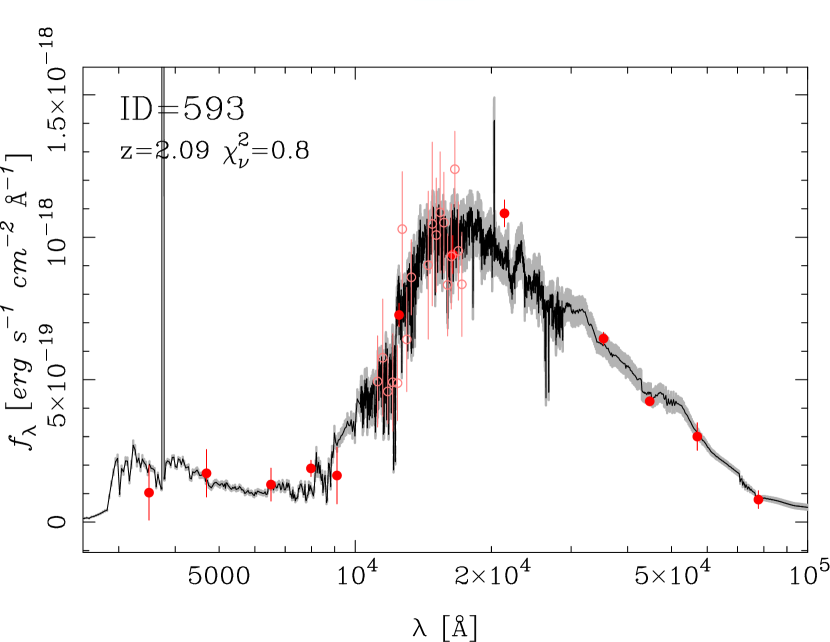
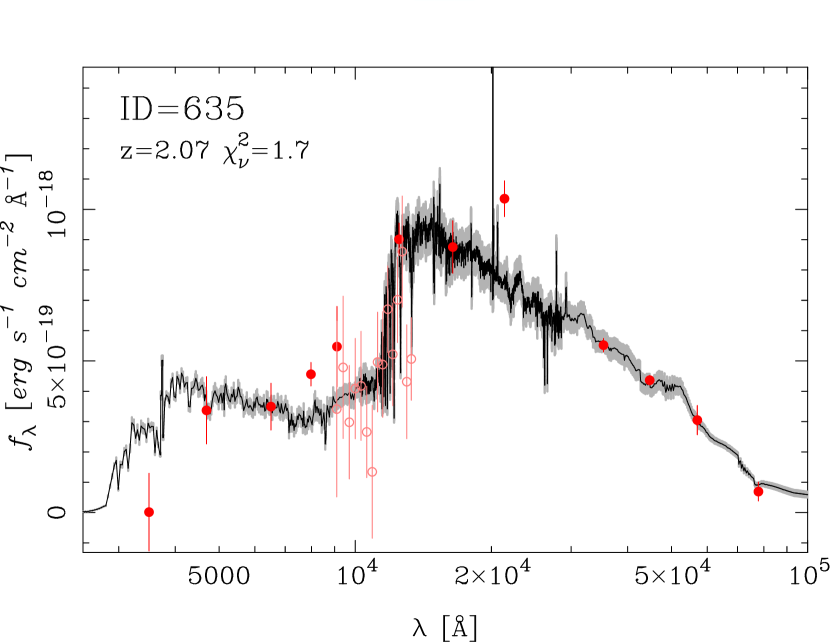
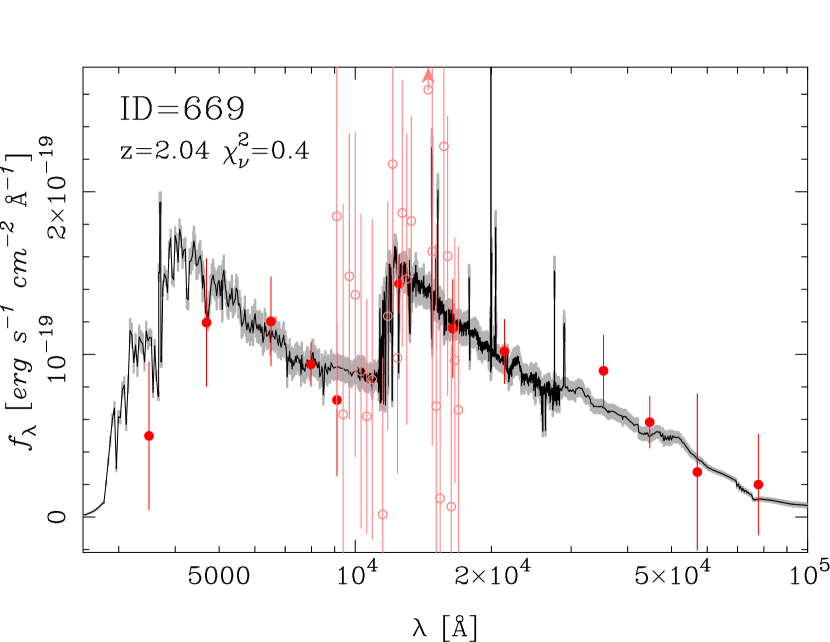
We show in Figs. 3 and 4 the observed SEDs and the best-fitting model SEDs of the member candidates. The fits are reasonable for most objects with . The low resolution spectra nicely trace the continuum shape and a clear 4000 break is observed in most objects. This continuum feature gives strong constraints on redshifts and stellar populations of the galaxies and that is the reason why the low-S/N near-IR spectra are very useful for galaxies (see Appendix and also Kriek et al. 2006).
The figures illustrate the diversity of the galaxy population in the proto-cluster; some have a blue UV slope, which is indicative of active star formation, while some are faint in the UV with no clear sign of active star formation. Galaxy clusters at low redshifts are dominated by quiescent galaxies, but this forming system hosts both star forming and quiescent galaxies. We will be quantitative about this trend in what follows.
4.4. Physical properties
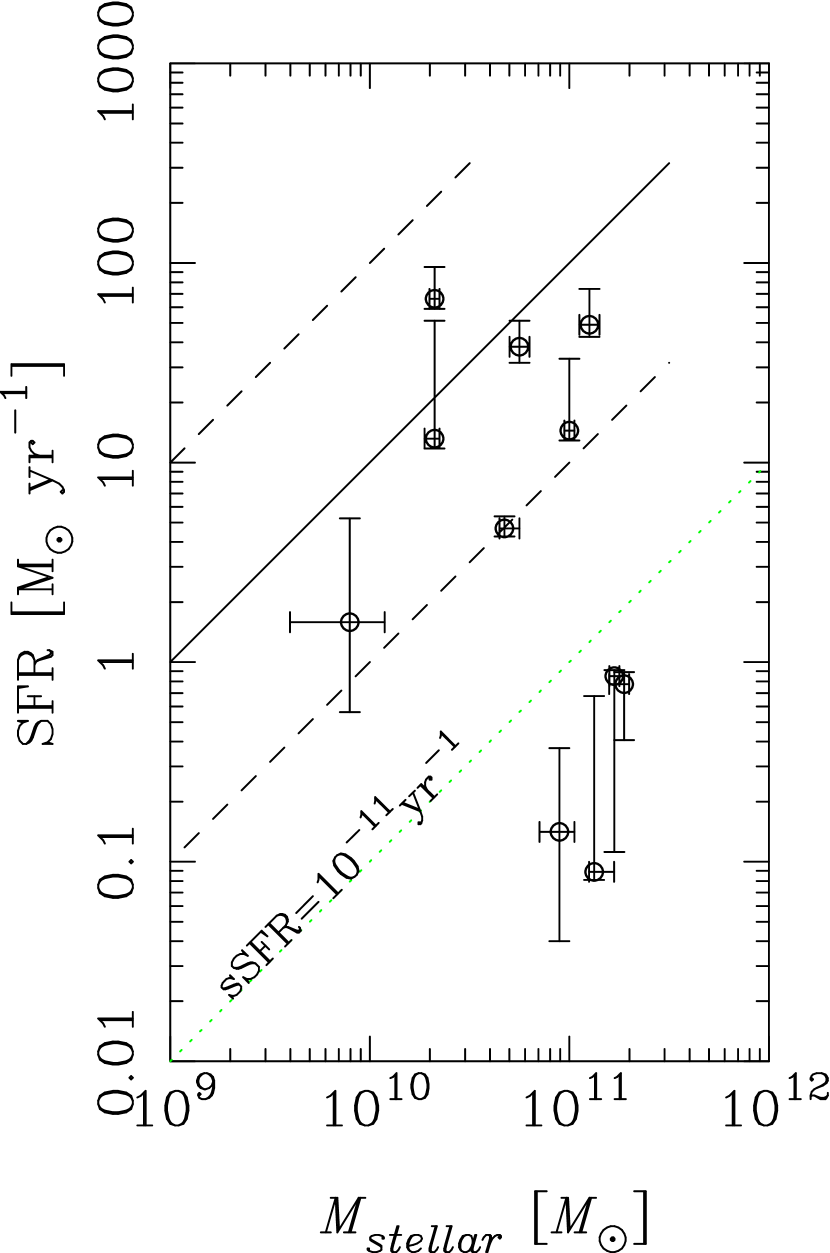
We now turn our attention to the physical properties of the member candidates. Star formation rates (SFRs) and stellar masses are known to show a strong positive correlation (Elbaz et al., 2007; Noeske et al., 2007) and Fig. 5 shows the relationship between the two quantities for the member candidates. See section 3 for the details of the SED fitting and how we measure SFR and stellar mass. We find that the galaxies form two distinct groups: star forming and quiescent. Interestingly, these populations are fairly clearly separated at . We will refer to star forming galaxies as those with and quiescent galaxies as those with lower sSFR in what follows. We note that Brammer et al. (2009) also observed a clear separation of red and blue galaxies in the field up to .
The star formation sequence in PKS1138 might appear slightly offset towards lower SFRs compared to the relation from the literature (Wuyts et al., 2011). This might be a real trend as suggested by Tanaka et al. (2010b), but it might be a systematic difference in the way SFRs are derived from Wuyts et al. (2011). We do not attempt to pursue the issue further due to the limited statistics (we have only 7 star forming galaxies). If we turn to quiescent galaxies, we find that they are all massive galaxies with . There is no lower mass quiescent galaxy in the figure, but this is likely a selection bias – we are complete only down to due to the -band magnitude cut applied.
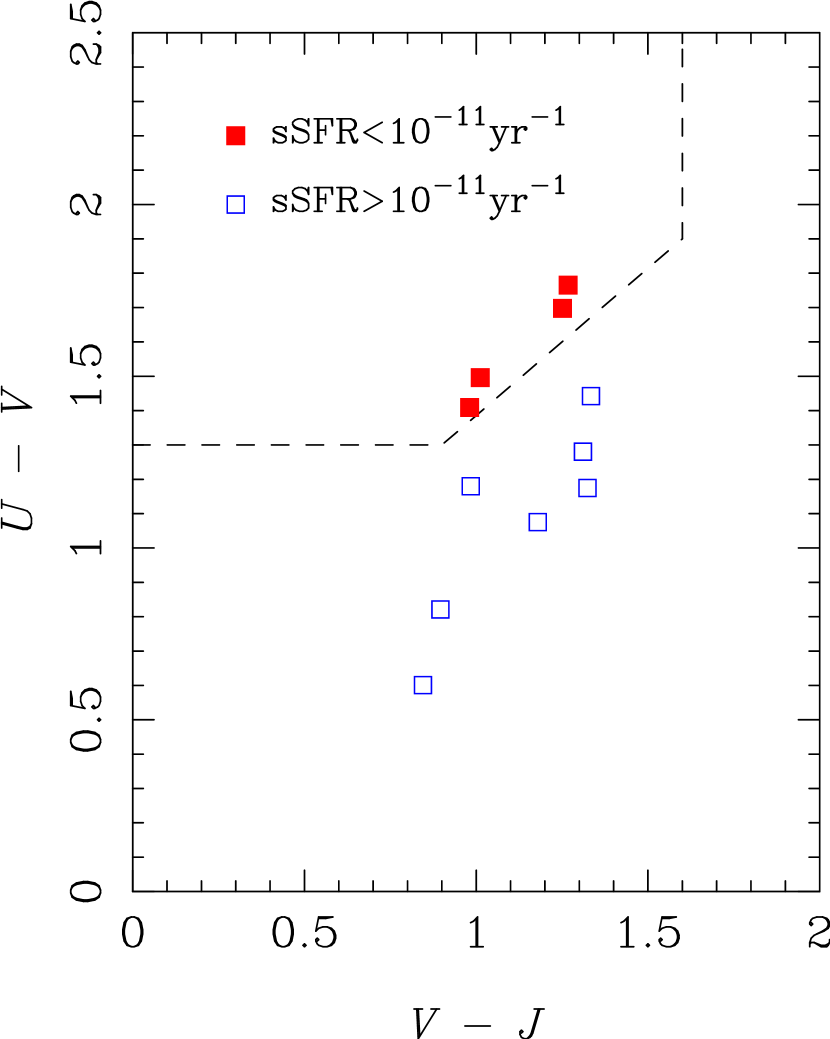
As a further check of the quiescent/star forming nature of the member galaxies, we measure their rest-frame colors using the best-fitting models and place them on a vs. diagram in Fig. 6. Williams et al. (2009) showed that the top-left corner of the diagram is populated by quiescent galaxies and the quiescent galaxies that we observed indeed fall in that area. This diagram further confirms our classification of quiescent and star forming populations based on the SED fitting. It is tempting to estimate a fraction of quiescent galaxies in this proto-cluster, but we choose not to do so because our spectroscopic sampling of the member galaxies is too small and biased (e.g., we gave priorities to red galaxies over blue ones in the mask design). It would be interesting to perform a less biased observation to extend the Butcher-Oemler effect (Butcher & Oemler, 1984) to the epoch of cluster formation.
4.5. Spatial distribution
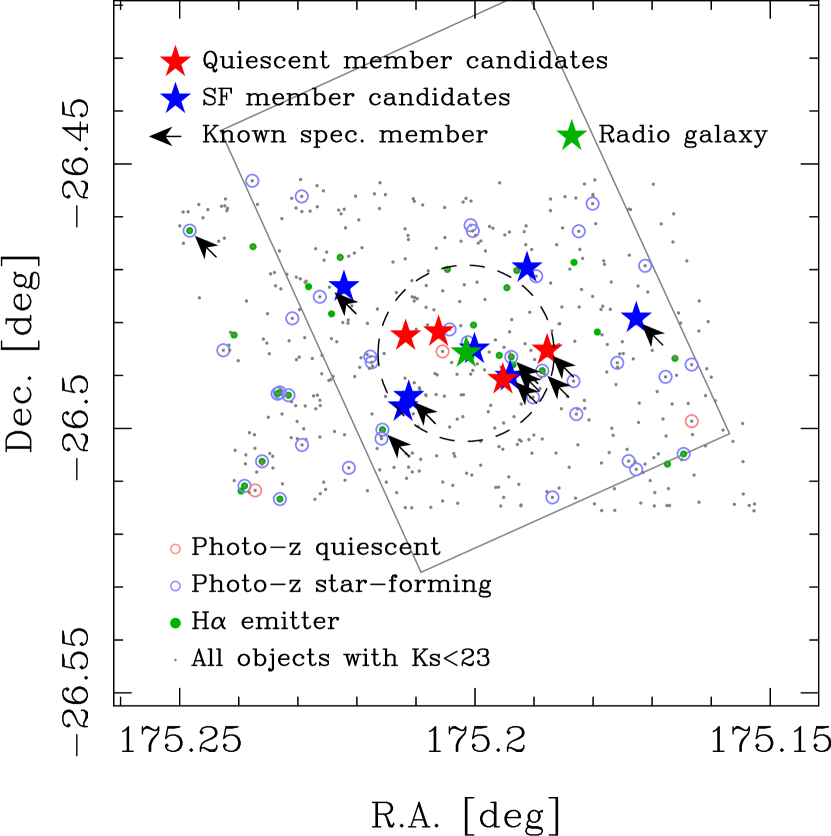
Where are these quiescent massive galaxies located with respect to the central radio galaxy? Fig. 7 shows the spatial distribution of the member candidates. We have recomputed photo-’s in Tanaka et al. (2010b) for all the objects in the field based on the revised catalog. The photo- objects with together with the H emitters from Koyama et al. (2013) are shown in the figure for reference. We find that the spectroscopically observed quiescent members shown as the red stars seem to be clustered around the radio galaxy and they are all located within 0.5 Mpc from the radio galaxy. This is unlikely due to a selection bias introduced in the mask design because we did not prioritize red galaxies in the center over those in the outer parts. Although the spatial area we explore is not large, this plot might indicate that massive quiescent galaxies already dominate the central part of a forming cluster.
As mentioned above, we suffer from near-foreground/background contamination due to the limited accuracy of . Here, we argue that the concentration of the quiescent galaxies is not due to the contamination. Brammer et al. (2011) estimated a number density of quiescent galaxies with stellar mass of to be at . Assuming that we sample galaxies at with Eq. 1, we expect massive quiescent galaxies within the circular aperture shown in Fig. 7, instead we observe four. Even over the entire field shown in Fig. 7, we expect such galaxies. Of course, these numbers are subject to cosmic variance, but it is in any case unlikely that we significantly suffer from the contamination and the concentration of the massive quiescent galaxies around the central radio galaxy is likely real. We will focus on these massive quiescent galaxies in Section 6 assuming that the contamination is negligible. As for star forming galaxies, 6 out of 7 galaxies are H emitters (Section 4.2) and thus the contamination of field star forming galaxies is also likely small.
4.6. Color-magnitude diagram
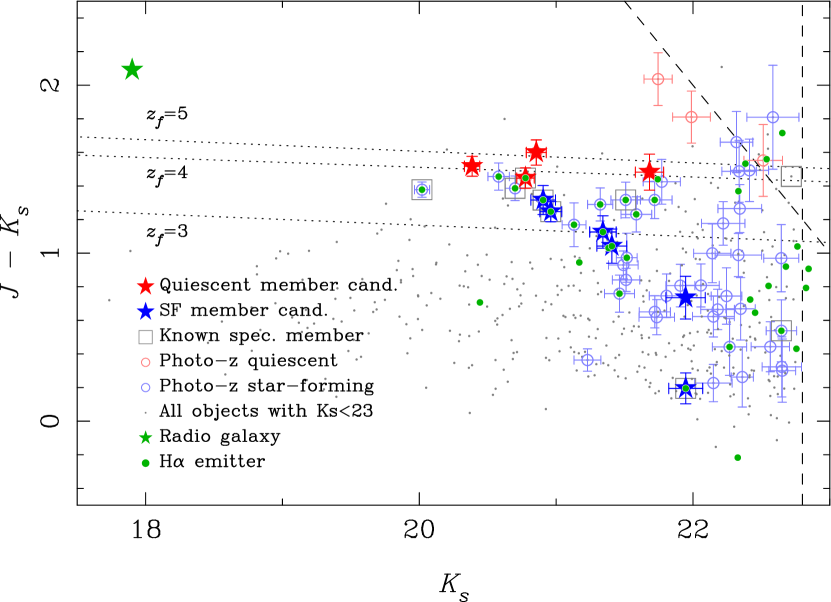
Galaxies in low-redshift clusters are known to form a tight red sequence on a color-magnitude diagram (e.g., Bower et al. 1992). It would be interesting to examine whether the quiescent galaxies form a red sequence in a progenitor system such as the one studied here. We present a color-magnitude diagram in Fig. 8.
Most of the bright galaxies have a relatively red color, but the observed red sequence is not very tight and is contaminated by star forming galaxies as shown by Koyama et al. (2013). This is perhaps what one would expect to observe in a forming cluster. Interestingly, however, the reddest part of the sequence is populated by the quiescent galaxies with sSFR, forming a weak red sequence. We note that there are a few photo- selected, quiescent galaxies with very red colors with , but they have large photometric errors and their sSFRs are actually consistent with star forming galaxies within . Only the member candidates selected with shown as the red stars are quiescent at a high significance. This is the first spectroscopic confirmation of red sequence formed by quiescent galaxies in a proto-cluster. This observation adds a support to the claim that the red sequence is being formed in this system (Zirm et al., 2008). We may expect the red star forming galaxies will eventually stop forming stars and form a more prominent red sequence at a later epoch. If we perform a linear fit to the 4 quiescent galaxies by fixing the slope to that of the model red sequence at (i.e., only the offset is allowed to float), we obtain . We will come back to this number in the discussion section.
To sum up, we have performed a detailed analysis of the SEDs and physical properties of the member candidates of the proto-cluster using the broad-band photometry and low resolution spectra simultaneously. We find that quiescent galaxies and star forming galaxies co-exist in this proto-cluster and the quiescent galaxies seem to form a weak red sequence. The quiescent galaxies are spatially concentrated around the central radio galaxy. This might suggest that the red sequence first appears when a system is collapsing to form a gravitationally bound system. We examine stellar populations of these galaxies in further detail using the MOIRCS spectra in the following sections.
5. Stacked spectrum of star forming members
Rest-frame optical spectra can place tight constraints on the stellar populations of galaxies through an absorption/emission line analysis. As mentioned earlier, the typical S/N of our individual MOIRCS spectra is not good enough for such an analysis. We here attempt to stack the spectra to obtain a higher S/N spectrum. Although the primary focus of the paper is on quiescent galaxies (Section 6), we briefly discuss the nature of star forming galaxies for completeness in this section.
Spectroscopic redshifts are available for 2 of the 7 star forming galaxies in the proto-cluster and we assume that the rest are all located at the cluster redshift. One object is excluded from this analysis because the object is an X-ray source (ID=399) and we do not want to bias the emission line anlalysis below. All the spectra of the remaining 6 star forming galaxies are shifted to rest-frame wavelength, normalized over the entire wavelength, and combined with inverse-variance weights in a rest-frame wavelength bin of , which is a half of of our observation.
We present the stacked spectrum of 6 star forming galaxies in Fig. 9. We observe prominent emission lines ([oii] and [oiii]) on top of a relatively blue continuum with a weak Balmer break. We fit the whole spectrum with the updated Bruzual & Charlot (2003) model templates assuming the Chabrier IMF and the exponentially declining star formation histories as above. Here, we allow age, extinction (), and star formation time scale to vary and the best-fitting model spectrum is shown in Fig. 9. The derived physical parameters are: age= Gyr, , and Gyr. This young age indicates active star formation in these galaxies.
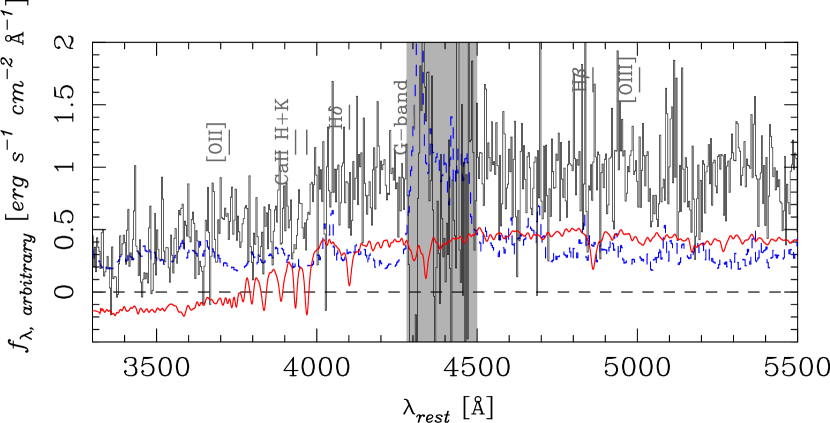
We subtract the best-fit model spectra to measure emission line fluxes. H emission is not clearly seen, but if we assume that the spike at the wavelength consistent with H is a real feature, we measure [oiii]/H, a large ratio not commonly observed in massive star forming galaxies at . This indicates either the galaxies are relatively metal-poor galaxies or they host AGNs. It is hard to discriminate these two possibilities without the [nii]/H ratio, but the latter may be the case as discussed below.
We use the method to estimate their gas-phase metallicity (see Kewley & Ellison 2008 and references therein). The is double-valued with metallicity and we cannot find a unique solution, but we measure for the upper branch and for the lower branch using the calibration by Kobulnicky & Kewley (2004). The star forming galaxies studied here typically have stellar mass of . Erb et al. (2006) reported that star forming galaxies at of similar stellar mass have . Their metallicity is based on the Pettini & Pagel (2004) calibration and if we translate it into the Kobulnicky & Kewley (2004) calibration following Kewley & Ellison (2008), we obtain plus an uncertainty of 0.067 dex from the conversion. Our estimate even for the upper branch is lower than this by . This might be a real trend, but we would rather interpret it as a hint of AGN contamination. Although we have excluded an X-ray source from the stacking, some of the other objects may host AGNs, which tend to lower the metallicity estimates from . A caveat to the analysis here is that we use the extinction from the spectral fit to correct for the dust extinction on the emission lines, which may not be a very accurate correction. The [nii]/H ratio is needed to draw a firm conclusion on the prevalence of AGNs among star forming galaxies in this proto-cluster.
6. Stacked spectrum of quiescent members
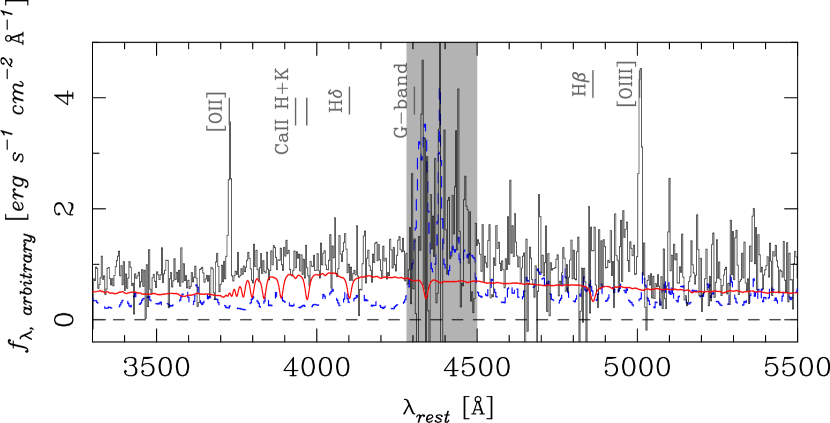
We now turn our attention to quiescent galaxies. Given the likely forming red sequence, it is interesting to study their stellar populations and formation histories in detail and that will be the focus of the rest of the paper. We follow the same procedure for the stacking as described above, except that we normalize the spectra at (i.e., above the break), where we have better S/N than below the break. We perform inverse-variance weighted stacking as done in the previous section. This weights towards brighter galaxies, but we have confirmed that our argument below does not change if we perform straight-mean stacking.
We assume that all the quiescent galaxies are located at the radio galaxy redshift of . We slightly tweak 2 of the 4 redshifts () in which a tentative hint of absorption features is observed in the individual spectra. We present the stacked spectrum in Fig. 10. The continuum is fairly flat at , while the red continuum is seen at shorter wavelengths and the 4000Å break is clearly observed. Interestingly, there is a hint of CaII H+K absorption in the spectrum. This is not a convincing detection, but if real, this would be the first detection of the feature in quiescent galaxies in a proto-cluster at a high redshift. Strong emission lines are absent in the spectrum, which is in stark contrast to the star forming galaxies in Fig. 9, confirming the quiescent nature of the galaxies.
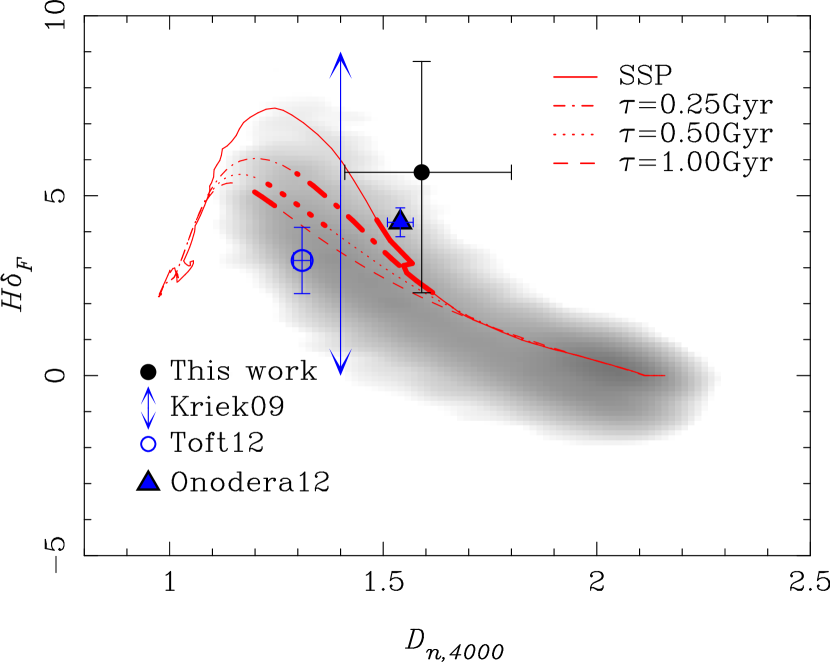
We make a further attempt to constrain the stellar population of the quiescent galaxies by measuring the strengths of the 4000 break and the H absorption of the stacked spectrum. For these indices, we adopt the definition of by Balogh et al. (1999) and H by Worthey & Ottaviani (1997), respectively. We measure and H from the stacked spectrum. Due to the large noise, these indices cannot be precisely measured, but they still give interesting constraints on the formation of the cluster massive galaxies as discussed below. We compare this stacked spectrum with (a) quiescent galaxies in the field at similar redshifts and (b) stellar population synthesis models. We also show the distribution of the galaxies at drawn from the Sloan Digital Sky Survey (SDSS; York et al. 2000) for reference. We show a H vs. diagram in Fig. 11 and make the two comparisons here.
6.1. (a) Quiescent galaxies in the field
Onodera et al. (2012) studied color-selected massive galaxies in the COSMOS field using the same instrument as ours. The redshifts of their galaxies spread over with masses around . Although their objects are located at lower redshifts than ours, we plot the and H indices of their stacked spectrum in Fig. 11 as the filled triangle. Their spectral indices have very small statistical uncertainties due to the high S/N of the spectrum. Our stacked object has a rather large uncertainty and its H and is consistent with Onodera et al. (2012), but let us repeat that their objects are located at lower redshifts.
Kriek et al. (2009) performed extremely deep near-IR spectroscopy of a massive, quiescent galaxy at with a stellar mass of . They measured , which is bluer than our quiescent objects at . Kriek et al. (2009) did not quote H and hence further comparisons cannot be made. Another field galaxy is drawn from Toft et al. (2012), who carried out an X-shooter observation of a massive galaxy at with a stellar mass of . The galaxy is also bluer compared to the quiescent proto-cluster galaxies.
Although the sample is very limited at this point, the two quiescent galaxies in the field at seem to be bluer than those in the proto-cluster. The bluer colors of field quiescent galaxies is expected in the framework of the hierarchical universe. The galaxy formation occurs in a biased fashion and we expect galaxies in clusters start to form earlier than field galaxies, and hence the proto-cluster galaxies appear older (redder) than the field galaxies at similar epoch. Unfortunately, however, the current statistics are too poor to draw any firm conclusion on the environmental variation in the spectral indices.
6.2. (b) Stellar population synthesis models
The redshift of corresponds to 3 Gyr since the Big Bang. The location of the red sequence in lower redshift clusters indicates the formation redshift of (e.g., Stanford et al. 1998), which is only 1-2 Gyr prior to . This fact allows us to put a tight constraint on the formation time scale of cluster massive galaxies.
We use an updated version of Bruzual & Charlot (2003) population synthesis code with improved treatment of the thermally pulsating AGB stars and assume the Chabrier IMF as in our spectrophotometric fits. Because the observed galaxies are massive galaxies with stellar mass of , it is reasonable to assume solar metallicity. In fact, Toft et al. (2012) found that a similarly massive galaxy at has metallicity consistent with solar. We do not consider dust extinction here because the spectral indices we measure are relatively independent of extinction. The only free parameters considered here are the exponential decay time scale () for the star formation history and age, which is time since the onset of star formation. All the model spectra are smoothed to the instrumental resolution of our observation.
We show in Fig. 11 model tracks for and 1.0 Gyr. The thick parts of the curves indicate the formation redshift range of observed at , and thus the stacked spectrum should be compared with these thick parts. The quiescent galaxies in the proto-cluster at can be reproduced by the models with and 0.25 Gyr. The models with and 1 Gyr are inconsistent at 1 and levels, respectively. This suggests that, under the assumption of the -model, the star formation time scale of massive quiescent galaxies in the proto-cluster has to be short, Gyr. If we allow a higher formation redshift of , Gyr is consistent with the observation, while Gyr is still ruled out at . The extra time we gain by allowing higher formation redshifts is short and the short star formation time scale inferred here is not strongly dependent on the choice of the maximum .
While this spectral analysis is robust against flux calibration uncertainties (the indices are measured in narrow wavelength windows), it provides a limited constraint on and . This is primarily because our H is essentially unconstrained and and are degenerate. We perform a further analysis to constrain these parameters using the full stacked spectrum. We fit the whole spectrum in the same manner as described in Section 5. The derived physical parameters are: age= Gyr, , and Gyr. The quiescent galaxies are older and have less dust compared to the star forming galaxies (Section 5), clearly illustrating more evolved stellar populations. The short is in agreement with the constraint from Fig. 11 ( Gyr) and the inferred age translates into .
The derived parameters have small formal errors on age (i.e., ) and , but the spectral fit here is subject to systematics such as flux calibration uncertainty. We try to gauge the systematic uncertainties in our results here by comparing with the formation redshift inferred from the location of the red sequence in Fig. 8. We recall that we have measured from the red sequence, which is higher than that from the spectral fit. But, the difference is in part due to the dust extinction applied here. The amount of extinction is not too high, but if we perform the same spectral fit by fixing extinction to 0, we obtain age= Gyr and Gyr. This age translates into . The age and dust extinction are known to degenerate and the latter fit with is likely more robust. The formation redshift remains essentially the same if we further assume as in the red sequence analysis (note that best-fit quoted above is fairly small). This is still inconsistent with from the red sequence and we deem that the redshift difference of ( Gyr) is a level of systematics in our analysis here. The flux calibration uncertainty in the spectrum and the zero-point calibration uncertainty in the broad-band photometry will be the main sources of systematics. It would be fair to say that the formation redshift is . We can apply the same argument to the formation time scale; from the full spectral fitting is smaller than that from , and we use that result to gauge the level of systematics. To be conservative, we choose to simply place an upper limit; Gyr.
We have considered systematics in observations, but there is another important source of systematics, which is the stellar population synthesis model. All the models used here are based on the updated Bruzual & Charlot (2003) code. There are a number of uncertainties in stellar population synthesis models as summarized in Conroy et al. (2009). We do not reiterate them here, but a possibly important role of thermally pulsating AGB stars claimed by Maraston (2005) is worth mentioning because these stars contribute significantly to the near-IR SED at an age of Gyr, which is about the estimated age of the quiescent galaxies. Here, we argue that our results are robust against this uncertainty. Our spectral analysis is performed in the rest-frame optical wavelengths, where these unstable stars do not significantly contribute. In fact, the evolution of around 1 Gyr is very similar between the Bruzual & Charlot (2003) model and Maraston (2005) model. Furthermore, a prominent role of thermally pulsating AGB stars has been questioned by several authors (e.g., Conroy & Gunn 2010; Kriek et al. 2010; Zibetti et al. 2013). For these reasons, we do not consider the thermally pulsating AGB stars are a serious concern in our analysis. Of course, the evolution of as well as overall spectral shape itself is subject to systematics (Conroy & Gunn, 2010) and it remains one of the major uncertainties at this point. Attenuation curve is not a major concern here because we specifically focused on quiescent galaxies. The initial mass function is assumed to be Chabrier (2003), but if we assume Salpeter (1955), stellar mass and SFR increase by roughly a factor of 2 and the other parameters do not significantly change. The assumption of solar metallicity may also be a concern. Toft et al. (2012) estimated metallicity consistent with solar for a massive field galaxy at albeit with a large uncertainty. Direct, precise metallicity measurements of our proto-cluster galaxies will be essential, but we note that, even if we assume (somewhat unrealistic) super-solar metallicity with , a short formation time scale ( Gyr) is still required to reproduce the observed red spectrum. For sub-solar metallicity, the time scale becomes even shorter.
We have summarized a number of sources of systematics above and we argue that our results do not significantly suffer from most of them. The only major concern is the uncertainty in the overall spectral evolution of the models in the optical at ages of a few Gyr, which is difficult to quantify at this point. We should bear it in mind, but it is unlikely that the inferred short formation time scale changes by as much as Gyr, which is needed to bring the observation consistent with recent simulations as discussed below. We conclude that, under a number of assumptions, the quiescent galaxies in PKS1138 form at with a formation time scale of Gyr. The remaining question is, how can these galaxies grow to on such a short time scale?
7. Summary and Discussion
We have performed deep near-IR spectroscopy of a z=2.16 proto-cluster. We find that quiescent galaxies with masses already appear in the forming cluster. We spectroscopically confirm the red sequence of quiescent galaxies in a proto-cluster for the first time. But, the observed red sequence is weak and the presence of red star forming galaxies suggests that the red sequence is being formed. The stacked spectrum of the star forming galaxies exhibits prominent emission lines on top of the blue continuum, indicating active star formation. However, their inferred gas-phase metallicity is low compared to that of field galaxies of similar mass at similar redshift, which we interpret as an indication of AGN activities in the star forming galaxies. On the other hand, the stacked spectrum of the quiescent galaxies shows a clear 4000Å break with a hint of a CaII H+K feature, indicating an evolved stellar population. Detailed spectral analyses based on the stellar population synthesis models suggest that the quiescent galaxies form at with a formation time scale of Gyr.
This short formation time scale is consistent with what has been indicated by stellar absorption studies of massive ellipticals in the local universe (e.g., Thomas et al. 1999, 2005); the observed element enhancement suggests that their major episode of star formation has to be short so that type Ia supernovae do not significantly contribute to the overall metal enrichment. The exact delay time of type Ia supernovae is still uncertain, but Eq. 4 of Thomas et al. (2005) gives a star formation time scale of 0.4 Gyr for a galaxy, which is consistent with our finding. One of the main criticisms of this interpretation is that it is possible to attribute the -enhancement to an IMF variation. But, our observation at presented in this paper provides independent evidence for the rapid formation.
Naab et al. (2007) performed SPH simulations of massive galaxy formation in the cosmological context. They show that most star formation happens at high redshifts, while a significant mass assembly happens at later times, . This nicely reproduces the observation that the stellar populations of massive early-type galaxies today are old. However, the overall star formation time scale of the massive galaxies () in Naab et al. (2007) is Gyr, which is longer than the time scale inferred from our observations. Johansson et al. (2012) extended the work by including stellar feedback, but the star formation time scale seems to remain similar (see their Fig. 2). This might indicate that there is a missing physical process in the simulation (note that they did not include the AGN feedback) and/or environment might play a role here. They studied objects that become isolated massive galaxies today, while we have focused on a forming galaxy group. A galaxy group is an over-density region in the universe, where a larger number of density peaks are embedded in a small volume by definition, and thus group galaxies might experience an accelerated formation and assembly at early times. This is an area where further simulations would be useful.
Our observation sets the upper limit on the formation time scale. The lower limit comes from the observed solar [Fe/H] abundance in nearby massive galaxies (e.g., Nelan et al. 2005). The galaxies must have experienced multiple cycles of star formation, so that the initial primordial gas is enriched to solar metallicity. In other words, the star formation should not be instantaneous. Closed-box models have provided a way to link metallicity and star formation time scales, but a detailed chemo-hydrodynamic simulation in the cosmological context would be needed to derive a more useful lower limit.
After the intensive in-situ star formation, subsequent star formation has to be shut off in order to reproduce the red spectra of the observed quiescent galaxies without prominent emission lines. Theoretical work has suggested a role of AGNs for such quenching (Granato et al., 2004; Springel et al., 2005b; Croton et al., 2006; Bower et al., 2006). However, there is still a limited amount of convincing observational evidence that AGNs actually shut off star formation, except possibly for powerful QSOs (Ho, 2005; Kim et al., 2006; Greene et al., 2011) and powerful radio galaxies (Nesvadba et al., 2008). The central radio galaxy of the proto-cluster is also likely powerful enough to blow out the gas (Nesvadba et al., 2006). There are 5 spectroscopically confirmed AGNs in this proto-cluster (Croft et al., 2005) and 1 out of the 4 quiescent galaxies focused on in this paper is an AGN. Among all the massive galaxies with , we estimate the AGN fraction is %222 This should be regarded as a rough number. We use our and from the literature to select massive member galaxies here and it is often not trivial to measure stellar mass of hosts of powerful AGNs. We assume a constant for such objects. . We also obtained a tentative hint that AGNs may populate among star forming galaxies in Section 5. This large fraction of galaxies host AGNs in the proto-cluster and a comparably large AGN fraction is observed in the field environment at similar redshifts as well (e.g., Xue et al. 2010; Marchesini et al. 2010; Olsen et al. 2013). Also, a very poor group at , which might possibly be a descendant of a forming system like the one studied here, has a high AGN fraction (; Tanaka et al. 2013). These high AGN fractions hint at a possible role of the AGN feedback in the quenching of star formation in massive galaxies and could be considered as smoking-gun evidence. However, they do not provide direct evidence. It would be fair to say that a physical mechanism to shut off star formation is yet to be identified.
Whatever the physical process is, the quenching is likely a fast process. We have observed a clear separation between the star forming galaxies and quiescent galaxies in Fig. 8. If the quenching happens on a long time scale, we may expect to observe transition galaxies in between the two populations. But, such a population does not seem to exist in this proto-cluster. This fast quenching is in line with the short formation time scale inferred from our analysis in section 5.
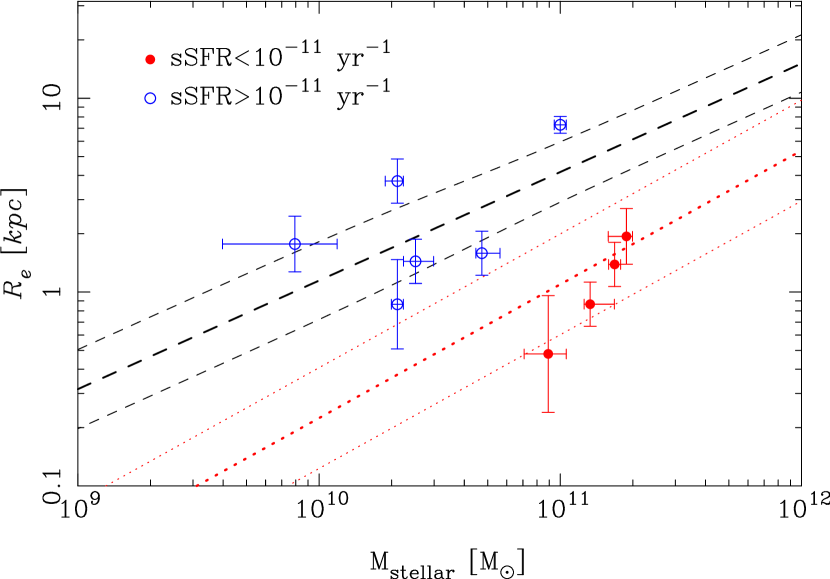
The intense starburst within Gyr followed by a rapid quenching has to result in compact early-type galaxies with high Sérsic indices. There is now a wealth of observations that massive quiescent galaxies at are compact and have steep radial profiles (e.g., Daddi et al. 2005; Toft et al. 2007; Zirm et al. 2007; Cimatti et al. 2008; van Dokkum et al. 2008; Cimatti et al. 2012; but see also van der Wel et al. 2011). We show in Fig. 12 the size-mass relation for the proto-cluster galaxies based on the NICMOS data presented in Zirm et al. (2008) and Zirm et al. (2012). We find that the proto-cluster quiescent galaxies as shown by the filled circles are indeed compact compared to early-type galaxies at from Shen et al. (2003). If we compare the proto-cluster quiescent galaxies with field quiescent galaxies similar redshifts drawn from Newman et al. (2012), the proto-cluster quiescent galaxies seem to have similar physical sizes to those of field galaxies, although the statistics are poor. Zirm et al. (2012) reported on possibly larger sizes of the proto-cluster galaxies compared to the field based on a larger photometric sample, and it is likely that we suffer from the poor statistics here.
A promising way to produce such a compact object would be nuclear starbursts. Galaxy mergers induce strong gas inflow towards the center (Mihos & Hernquist, 1996), triggering a nuclear starburst. Also, filamentary gas inflow, which primarily happens at high redshifts (Kereš et al., 2005; Dekel & Birnboim, 2006; Johansson et al., 2012), can also reach the central region and help feed the nuclear starburst.
One may expect to observe some of such starbursting galaxies as submm galaxies. Toft et al. (in prep.) suggested that submm galaxies at may be the direct progenitors of the quiescent galaxies at because the distribution of the quiescent galaxies match with the observed redshift distribution of submm galaxies. Some of these submm galaxies have SFRs even above , but a recent SPH simulation by Johansson et al. (2012) shows that massive galaxies reach a maximum SFR of about an order of magnitude lower, . This is a total SFR of all galaxies that end up in a massive galaxy at , and thus SFRs of individual galaxies at should be lower. This may indicate a tension between observation and simulation or perhaps it just means that only a fraction of massive galaxies experience a submm phase (and hence not fully reproduced by simulations of a dozen galaxies). We should also mention that the simulated galaxies in Johansson et al. (2012) tend to be less massive than observed submm galaxies and the comparison here may not be fair. This is also an area that deserves further studies.
The gas continues to accrete to the quenched galaxies from the surroundings, but they have to remain quiescent in order to be consistent with the observations at lower redshifts. Minor mergers help keep the gas hot to prevent further star formation through the release of the gravitational energy of the infalling galaxies (Johansson et al., 2009). This heating may not be enough and the gas may still cool, especially in the core (Johansson et al., 2012). The so-called radio mode AGN feedback might be able to heat it (Croton et al., 2006; Bower et al., 2006), although this process is not necessarily confirmed by observation. Minor mergers also help explain the observed size evolution of massive quiescent galaxies (e.g., Naab et al. 2009; Oser et al. 2012) down to the present day.
Overall, we have not fully understood the physical processes that trigger such star formation, enrich metals to solar metallicity, produce a compact galaxy, and then shut off SFR and keep them quiescent afterwards, but aided by numerical simulations, we are starting to constrain them. Our observational constraint presented in this paper is that the massive quiescent galaxies form at on a Gyr time scale. This short formation time scale is in tension with the recent models as we have highlighted in this paper. But, this might indicate that environment plays a role — simulations have focused on field galaxies, but we specifically studied a forming group, and it would not be too surprising if their formation time scales are different. From an observational perspective, it would be interesting to obtain higher S/N spectra as well as to study a larger number of such systems at high redshifts. From a theoretical perspective, a detailed simulation of galaxy formation in high density regions of the universe would be highly useful.
This work is based on data collected at Subaru Telescope, which is operated by the National Astronomical Observatory of Japan. MT acknowledges support by KAKENHI No. 23740144 and thanks Peter Johansson for useful discussions and comments on the manuscript. MT also thanks Kiyoto Yabe for useful conversations. ST and AZ gratefully acknowledge support from the Lundbeck foundation. The Dark Cosmology Centre is funded by the Danish National Research Foundation. DM acknowledges support from Tufts University Mellon Research Fellowship in Arts and Sciences. YK acknowledges the support from the Japan Society for the Promotion of Science (JSPS) through JSPS research fellowships for young scientists. We thank the referee for useful comments, which helped improve the paper.
Appendix A Spectra of objects with measured redshifts
We present the spectra of objects with measured redshifts in Fig. 13. As shown in Table 1, we could not measure spectroscopic redshifts for roughly a half of the objects that we observed with MOIRCS. Those spectra are not included in the figure.

Appendix B Improvements on redshift and physical parameter estimates with the binned spectra
It will be instructive to show how our estimates of redshifts and physical parameters of galaxies improve by combining the binned spectra in the SED fits. We plot in Fig. 14 the ratio of the 68% confidence intervals on redshift, stellar mass and SFR measured with and without the binned spectra. If the ratio is below unity, that means that the binned spectra reduce the uncertainty.
Before we discuss the plot, it is important to emphasize that the result here should not be interpreted as a general improvement that can be achieved by including spectra in SED fits. Improvements are dependent on wavelength coverages of spectra and broad-band photometry and also on their quality. Our spectra cover only a limited rest-frame wavelength range and a wider wavelength coverage is expected to deliver further improvements.

The left panel shows that the redshift uncertainty is reduced by almost a factor of 2 on average by the spectra. There are not many galaxies at low redshifts, but we expect that this improvement is limited to , where we can probe the 4000Å break with the spectra. At lower/higher redshift ranges, the spectra sample only smooth continua and they will not be as useful as the break feature. This plot clearly shows that our work significantly benefited from the spectra in identifying probable cluster member candidates at .
The strength of the 4000Å break feature is a reasonable proxy for stellar mass to light ratio (e.g., Kauffmann et al. 2003). The precise measurement of the break strength with the spectra improves the stellar mass estimates as shown in the 2nd panel. But, interestingly, the spectra do not improve the SFR estimates (3rd panel). This is likely because the wavelength coverage of the spectra is too narrow and most of the constraints on the overall spectral shape come from the broad-band photometry. Not surprisingly, we find that the spectra do not improve dust extinction estimates either (4th panel). Rest-frame UV spectra will be useful to improve SFR and extinction.
References
- Arimoto & Yoshii (1987) Arimoto, N., & Yoshii, Y. 1987, A&A, 173, 23
- Balogh et al. (1999) Balogh, M. L., Morris, S. L., Yee, H. K. C., Carlberg, R. G., & Ellingson, E. 1999, ApJ, 527, 54
- Baum (1959) Baum, W. A. 1959, PASP, 71, 106
- Bertin & Arnouts (1996) Bertin, E., & Arnouts, S. 1996, A&AS, 117, 393
- Bower et al. (1992) Bower, R. G., Lucey, J. R., & Ellis, R. S. 1992, MNRAS, 254, 601
- Bower et al. (2006) Bower, R. G., Benson, A. J., Malbon, R., et al. 2006, MNRAS, 370, 645
- Butcher & Oemler (1984) Butcher, H., & Oemler, A., Jr. 1984, ApJ, 285, 426
- Brammer et al. (2009) Brammer, G. B., Whitaker, K. E., van Dokkum, P. G., et al. 2009, ApJ, 706, L173
- Brammer et al. (2011) Brammer, G. B., Whitaker, K. E., van Dokkum, P. G., et al. 2011, ApJ, 739, 24
- Bruzual & Charlot (2003) Bruzual, G., & Charlot, S. 2003, MNRAS, 344, 1000
- Calzetti et al. (2000) Calzetti, D., Armus, L., Bohlin, R. C., et al. 2000, ApJ, 533, 682
- Calzetti (1997) Calzetti, D. 1997, American Institute of Physics Conference Series, 408, 403
- Chabrier (2003) Chabrier, G. 2003, PASP, 115, 763
- Cimatti et al. (2004) Cimatti, A., Daddi, E., Renzini, A., et al. 2004, Nature, 430, 184
- Cimatti et al. (2008) Cimatti, A., Cassata, P., Pozzetti, L., et al. 2008, A&A, 482, 21
- Cimatti et al. (2012) Cimatti, A., Nipoti, C., & Cassata, P. 2012, MNRAS, 422, L62
- Conroy et al. (2009) Conroy, C., Gunn, J. E., & White, M. 2009, ApJ, 699, 486
- Conroy & Gunn (2010) Conroy, C., & Gunn, J. E. 2010, ApJ, 712, 833
- Croft et al. (2005) Croft, S., Kurk, J., van Breugel, W., et al. 2005, AJ, 130, 867
- Croton et al. (2006) Croton, D. J., Springel, V., White, S. D. M., et al. 2006, MNRAS, 365, 11
- Daddi et al. (2005) Daddi, E., Renzini, A., Pirzkal, N., et al. 2005, ApJ, 626, 680
- De Lucia et al. (2006) De Lucia, G., Springel, V., White, S. D. M., Croton, D., & Kauffmann, G. 2006, MNRAS, 366, 499
- Erb et al. (2006) Erb, D. K., Shapley, A. E., Pettini, M., et al. 2006, ApJ, 644, 813
- Dekel & Birnboim (2006) Dekel, A., & Birnboim, Y. 2006, MNRAS, 368, 2
- De Lucia & Blaizot (2007) De Lucia, G., & Blaizot, J. 2007, MNRAS, 375, 2
- Djorgovski & Davis (1987) Djorgovski, S., & Davis, M. 1987, ApJ, 313, 59
- Doherty et al. (2010) Doherty, M., Tanaka, M., De Breuck, C., et al. 2010, A&A, 509, A83
- Elbaz et al. (2007) Elbaz, D., Daddi, E., Le Borgne, D., et al. 2007, A&A, 468, 33
- Eminian et al. (2008) Eminian, C., Kauffmann, G., Charlot, S., et al. 2008, MNRAS, 384, 930
- Faber & Jackson (1976) Faber, S. M., & Jackson, R. E. 1976, ApJ, 204, 668
- Fassbender et al. (2011) Fassbender, R., Nastasi, A., Böhringer, H., et al. 2011, A&A, 527, L10
- Förster Schreiber et al. (2004) Förster Schreiber, N. M., van Dokkum, P. G., Franx, M., et al. 2004, ApJ, 616, 40
- Gobat et al. (2011) Gobat, R., Daddi, E., Onodera, M., et al. 2011, A&A, 526, A133
- Gobat et al. (2012) Gobat, R., Strazzullo, V., Daddi, E., et al. 2012, ApJ, 759, L44
- Gobat et al. (2013) Gobat, R., Strazzullo, V., Daddi, E., et al. 2013, arXiv:1305.3576
- Gómez et al. (2003) Gómez, P. L., Nichol, R. C., Miller, C. J., et al. 2003, ApJ, 584, 210
- Granato et al. (2004) Granato, G. L., De Zotti, G., Silva, L., Bressan, A., & Danese, L. 2004, ApJ, 600, 580
- Greene et al. (2011) Greene, J. E., Zakamska, N. L., Ho, L. C., & Barth, A. J. 2011, ApJ, 732, 9
- Guo et al. (2011) Guo, Q., White, S., Boylan-Kolchin, M., et al. 2011, MNRAS, 413, 101
- Hatch et al. (2008) Hatch, N. A., Overzier, R. A., Röttgering, H. J. A., Kurk, J. D., & Miley, G. K. 2008, MNRAS, 383, 931
- Hatch et al. (2009) Hatch, N. A., Overzier, R. A., Kurk, J. D., et al. 2009, MNRAS, 395, 114
- Ho (2005) Ho, L. C. 2005, ApJ, 629, 680
- Ichikawa et al. (2006) Ichikawa, T., Suzuki, R., Tokoku, C., et al. 2006, Proc. SPIE, 6269,
- Inoue (2011) Inoue, A. K. 2011, MNRAS, 415, 2920
- Johansson et al. (2009) Johansson, P. H., Naab, T., & Ostriker, J. P. 2009, ApJ, 697, L38
- Johansson et al. (2012) Johansson, P. H., Naab, T., & Ostriker, J. P. 2012, ApJ, 754, 115
- Jorgensen et al. (1996) Jorgensen, I., Franx, M., & Kjaergaard, P. 1996, MNRAS, 280, 167
- Kauffmann et al. (2003) Kauffmann, G., Heckman, T. M., White, S. D. M., et al. 2003, MNRAS, 341, 33
- Kennicutt & Evans (2012) Kennicutt, R. C., & Evans, N. J. 2012, ARA&A, 50, 531
- Kereš et al. (2005) Kereš, D., Katz, N., Weinberg, D. H., & Davé, R. 2005, MNRAS, 363, 2
- Kewley & Ellison (2008) Kewley, L. J., & Ellison, S. L. 2008, ApJ, 681, 1183
- Kim et al. (2006) Kim, M., Ho, L. C., & Im, M. 2006, ApJ, 642, 702
- Komatsu et al. (2011) Komatsu, E., Smith, K. M., Dunkley, J., et al. 2011, ApJS, 192, 18
- Kobulnicky & Kewley (2004) Kobulnicky, H. A., & Kewley, L. J. 2004, ApJ, 617, 240
- Kodama et al. (2007) Kodama, T., Tanaka, I., Kajisawa, M., et al. 2007, MNRAS, 377, 1717
- Koyama et al. (2013) Koyama, Y., Kodama, T., Tadaki, K.-i., et al. 2013, MNRAS, 428, 1551
- Koo (1999) Koo, D. C. 1999, Photometric Redshifts and the Detection of High Redshift Galaxies, 191, 3
- Kriek et al. (2006) Kriek, M., van Dokkum, P. G., Franx, M., et al. 2006, ApJ, 645, 44
- Kriek et al. (2008) Kriek, M., van Dokkum, P. G., Franx, M., et al. 2008, ApJ, 677, 219
- Kriek et al. (2009) Kriek, M., van Dokkum, P. G., Labbé, I., et al. 2009, ApJ, 700, 221
- Kriek et al. (2010) Kriek, M., Labbé, I., Conroy, C., et al. 2010, ApJ, 722, L64
- Kurk et al. (2000) Kurk, J. D., Röttgering, H. J. A., Pentericci, L., et al. 2000, A&A, 358, L1
- Kurk et al. (2004a) Kurk, J. D., Pentericci, L., Overzier, R. A., Röttgering, H. J. A., & Miley, G. K. 2004a, A&A, 428, 817
- Kurk et al. (2004b) Kurk, J. D., Pentericci, L., Röttgering, H. J. A., & Miley, G. K. 2004b, A&A, 428, 793
- Kurk et al. (2009) Kurk, J., Cimatti, A., Zamorani, G., et al. 2009, A&A, 504, 331
- Lewis et al. (2002) Lewis, I., Balogh, M., De Propris, R., et al. 2002, MNRAS, 334, 673
- Maraston (2005) Maraston, C. 2005, MNRAS, 362, 799
- Marchesini et al. (2010) Marchesini, D., Whitaker, K. E., Brammer, G., et al. 2010, ApJ, 725, 1277
- Marigo & Girardi (2007) Marigo, P., & Girardi, L. 2007, A&A, 469, 239
- Mei et al. (2009) Mei, S., Holden, B. P., Blakeslee, J. P., et al. 2009, ApJ, 690, 42
- Miley et al. (2006) Miley, G. K., Overzier, R. A., Zirm, A. W., et al. 2006, ApJ, 650, L29
- Mihos & Hernquist (1996) Mihos, J. C., & Hernquist, L. 1996, ApJ, 464, 641
- Muzzin et al. (2013) Muzzin, A., Wilson, G., Demarco, R., et al. 2013, ApJ, 767, 39
- Naab et al. (2007) Naab, T., Johansson, P. H., Ostriker, J. P., & Efstathiou, G. 2007, ApJ, 658, 710
- Naab et al. (2009) Naab, T., Johansson, P. H., & Ostriker, J. P. 2009, ApJ, 699, L178
- Nastasi et al. (2011) Nastasi, A., Fassbender, R., Böhringer, H., et al. 2011, A&A, 532, L6
- Nelan et al. (2005) Nelan, J. E., Smith, R. J., Hudson, M. J., et al. 2005, ApJ, 632, 137
- Nesvadba et al. (2006) Nesvadba, N. P. H., Lehnert, M. D., Eisenhauer, F., et al. 2006, ApJ, 650, 693
- Nesvadba et al. (2008) Nesvadba, N. P. H., Lehnert, M. D., De Breuck, C., Gilbert, A. M., & van Breugel, W. 2008, A&A, 491, 407
- Newman et al. (2012) Newman, A. B., Ellis, R. S., Bundy, K., & Treu, T. 2012, ApJ, 746, 162
- Noeske et al. (2007) Noeske, K. G., Weiner, B. J., Faber, S. M., et al. 2007, ApJ, 660, L43
- Olsen et al. (2013) Olsen, K. P., Rasmussen, J., Toft, S., & Zirm, A. W. 2013, ApJ, 764, 4
- Onodera et al. (2012) Onodera, M., Renzini, A., Carollo, M., et al. 2012, ApJ, 755, 26
- Oser et al. (2012) Oser, L., Naab, T., Ostriker, J. P., & Johansson, P. H. 2012, ApJ, 744, 63
- Pentericci et al. (1997) Pentericci, L., Roettgering, H. J. A., Miley, G. K., Carilli, C. L., & McCarthy, P. 1997, A&A, 326, 580
- Pentericci et al. (1998) Pentericci, L., Roettgering, H. J. A., Miley, G. K., et al. 1998, ApJ, 504, 139
- Pentericci et al. (2000) Pentericci, L., Kurk, J. D., Röttgering, H. J. A., et al. 2000, A&A, 361, L25
- Pentericci et al. (2002) Pentericci, L., Kurk, J. D., Carilli, C. L., et al. 2002, A&A, 396, 109
- Pettini & Pagel (2004) Pettini, M., & Pagel, B. E. J. 2004, MNRAS, 348, L59
- Salpeter (1955) Salpeter, E. E. 1955, ApJ, 121, 161
- Santos et al. (2011) Santos, J. S., Fassbender, R., Nastasi, A., et al. 2011, A&A, 531, L15
- Seymour et al. (2007) Seymour, N., Stern, D., De Breuck, C., et al. 2007, ApJS, 171, 353
- Shen et al. (2003) Shen, S., Mo, H. J., White, S. D. M., et al. 2003, MNRAS, 343, 978
- Spitler et al. (2012) Spitler, L. R., Labbé, I., Glazebrook, K., et al. 2012, ApJ, 748, L21
- Springel et al. (2005a) Springel, V., White, S. D. M., Jenkins, A., et al. 2005a, Nature, 435, 629
- Springel et al. (2005b) Springel, V., Di Matteo, T., & Hernquist, L. 2005b, MNRAS, 361, 776
- Stanford et al. (1998) Stanford, S. A., Eisenhardt, P. R., & Dickinson, M. 1998, ApJ, 492, 461
- Stanford et al. (2012) Stanford, S. A., Brodwin, M., Gonzalez, A. H., et al. 2012, ApJ, 753, 164
- Strazzullo et al. (2013) Strazzullo, V., Gobat, R., Daddi, E., et al. 2013, arXiv:1305.3577
- Suzuki et al. (2008) Suzuki, R., Tokoku, C., Ichikawa, T., et al. 2008, PASJ, 60, 1347
- Tal et al. (2009) Tal, T., van Dokkum, P. G., Nelan, J., & Bezanson, R. 2009, AJ, 138, 1417
- Tanaka et al. (2004) Tanaka, M., Goto, T., Okamura, S., Shimasaku, K., & Brinkmann, J. 2004, AJ, 128, 2677
- Tanaka et al. (2009) Tanaka, M., Lidman, C., Bower, R. G., et al. 2009, A&A, 507, 671
- Tanaka et al. (2010a) Tanaka, M., Finoguenov, A., & Ueda, Y. 2010, ApJ, 716, L152
- Tanaka et al. (2010b) Tanaka, M., De Breuck, C., Venemans, B., & Kurk, J. 2010, A&A, 518, A18
- Tanaka et al. (2013) Tanaka, M., Finoguenov, A., Mirkazemi, M., et al. 2013, PASJ, 65, 17
- Thomas et al. (1999) Thomas, D., Greggio, L., & Bender, R. 1999, MNRAS, 302, 537
- Thomas et al. (2005) Thomas, D., Maraston, C., Bender, R., & Mendes de Oliveira, C. 2005, ApJ, 621, 673
- Toft et al. (2007) Toft, S., van Dokkum, P., Franx, M., et al. 2007, ApJ, 671, 285
- Toft et al. (2012) Toft, S., Gallazzi, A., Zirm, A., et al. 2012, ApJ, 754, 3
- van der Wel et al. (2011) van der Wel, A., Rix, H.-W., Wuyts, S., et al. 2011, ApJ, 730, 38
- van de Sande et al. (2012) van de Sande, J., Kriek, M., Franx, M., et al. 2012, arXiv:1211.3424
- van Dokkum (2005) van Dokkum, P. G. 2005, AJ, 130, 2647
- van Dokkum et al. (2008) van Dokkum, P. G., Franx, M., Kriek, M., et al. 2008, ApJ, 677, L5
- van Ojik (1995) van Ojik, R. 1995, Ph.D. Thesis,
- Williams et al. (2009) Williams, R. J., Quadri, R. F., Franx, M., van Dokkum, P., & Labbé, I. 2009, ApJ, 691, 1879
- Worthey & Ottaviani (1997) Worthey, G., & Ottaviani, D. L. 1997, ApJS, 111, 377
- Wuyts et al. (2011) Wuyts, S., Förster Schreiber, N. M., van der Wel, A., et al. 2011, ApJ, 742, 96
- Xue et al. (2010) Xue, Y. Q., Brandt, W. N., Luo, B., et al. 2010, ApJ, 720, 368
- York et al. (2000) York, D. G., Adelman, J., Anderson, J. E., Jr., et al. 2000, AJ, 120, 1579
- Zibetti et al. (2013) Zibetti, S., Gallazzi, A., Charlot, S., Pierini, D., & Pasquali, A. 2013, MNRAS, 428, 1479
- Zirm et al. (2007) Zirm, A. W., van der Wel, A., Franx, M., et al. 2007, ApJ, 656, 66
- Zirm et al. (2008) Zirm, A. W., Stanford, S. A., Postman, M., et al. 2008, ApJ, 680, 224
- Zirm et al. (2012) Zirm, A. W., Toft, S., & Tanaka, M. 2012, ApJ, 744, 181