CSS J134052.0+151341 : A Cataclysmic Binary Star with a Stripped, Evolved Secondary 111Based on observations obtained at the MDM Observatory, operated by Dartmouth College, Columbia University, Ohio State University, Ohio University, and the University of Michigan.
Abstract
I report spectroscopy and time-series photometry of the cataclysmic binary CSS J134052.0+151341. The optical light is dominated by the secondary star, which I classify as K4 ( subclasses), yet the orbital period derived from the absorption radial velocities is only 2.45 hr, implying a Roche radius much too small to contain a main-sequence K star. The spectrum shows enhanced sodium absorption in several lines, suggesting that the surface material has been processed at high temperatures. CSS J134052.0+151341 appears to be a rare example of a cataclysmic binary in which the secondary star is the stripped core of a formerly much more massive star, that began mass transfer after much of the core’s nuclear evolution had taken place.
1 Introduction
Cataclysmic variable stars (CVs) are close binary systems in which a white dwarf accretes matter from a less-compact companion that fills its Roche critical lobe. The companion usually resembles a low-mass main sequence star. Faulkner et al. (1972) pointed out that if a star fills its Roche critical lobe in a close binary, its mean density is inversely related to the orbital period , with little dependence on the masses of the two stars. Along the main sequence, the mean density increases strongly with decreasing mass. Consequently, the secondary stars in short-period CVs tend to resemble late M dwarfs. At periods shorter than 4 hr, the secondary is usually not detectable in the combined spectrum, because other sources of light overwhelm its feeble contribution. At longer periods, the secondaries tend to be hotter, more luminous, and more conspicuous. The relationship between and the secondary spectral type is explored in detail by Knigge (2006).
Some CVs depart radically from the typical - relationship. If the secondary star is also a degenerate dwarf, the system is called an AM CVn star; these can have min. Over a dozen examples are known (Nelemans, 2005; Roelofs et al., 2007; Rau et al., 2010).
Here we are concerned with another CV subtype – the small number of short-period systems in which the secondary star not a white dwarf, but is significantly warmer than expected for the orbital period. EI Psc (= 1RXS J232953.9+062814) has = 64 min, yet shows a conspicuous K-type secondary (Thorstensen et al., 2002a). The orbital period of QZ Ser is less extreme at 2.0 hours, but it too has a K-type secondary (Thorstensen et al., 2002b). Littlefair et al. (2006) obtained time-series photometry of the 2.4-hour eclipsing system SDSS J170213.26+322954.1 and derived a temperature for the secondary consistent with an M0 star, while the typical relation would predict M4. Szkody et al. (2004) found a spectral type of M1.5 1.1 for the secondary, marginally consistent with the Littlefair et al. (2006) result, and also hotter than expected for .
The standard explanation for these warmer-than-expected secondaries is that mass transfer began after the secondary had consumed most of the hydrogen in the its core. This greatly alters the mass-luminosity-temperature () relation, and in particular makes greater at a given surface temperature, which results in the departure from the usual - relation. This idea is supported by evolutionary calculations (Thorstensen et al., 2002a) and by indications of unusual abundances in the accreted material (Gänsicke et al., 2003) and in the secondary’s photosphere. In particular, Thorstensen et al. (2002b) found unusually strong sodium absorption lines in the QZ Ser secondary spectrum, which they interpreted as evidence that the material had been processed at a temperature high enough to drive proton capture by 22Ne. One attractive feature of the evolved-secondary scenario is that, if the secondary were more massive than the primary when it first contacted its Roche critical lobe, the subsequent mass transfer would have been unstable, leading to rapid shrinkage of the orbit. This could explain to the short periods observed (Littlefair et al., 2006).
A stripped-core secondary also features in at least one neutron-star binary, namely AY Sex (FIRSTJ102347+003841; Archibald et al., 2009; Thorstensen & Armstrong, 2005). The primary in this system is a 500 Hz millisecond pulsar, and the secondary is a mid-G star. A recent VLA parallax measurement by Deller et al. (2012), combined with the constraints derived by Thorstensen & Armstrong (2005), give a secondary-star mass of only 0.24 M⊙, so it is extremely undermassive for its spectral type. AY Sex also shows some evidence of Na enhancement (Thorstensen & Armstrong, 2005).
Here I report on a new member of this exclusive class, CSS J134052.0+151341. This was discovered in the Catalina Real Time Survey (CRTS; Drake et al., 2009), which has turned up a very large number of new CV candidates (Woudt et al., 2012; Thorstensen & Skinner, 2012) . Table 1 summarizes some pertinent information about the star. The CRTS light curve of this object 222This and all other CRTS information about this star were retrieved the on-line CRTS CV catalog, available at http://nesssi.cacr.caltech.edu/catalina/AllCV.html shows with a white-light magnitude just fainter than 18th, and a single outburst to 14.5 magnitude starting 2010 May 31. While the outburst behavior is unremarkable, the magnitude at minimum is unusually steady, varying by only a few tenths of a magnitude at most. Most dwarf novae show much larger variations at minimum.
2 Observations
All the observations are from MDM Observatory, on Kitt Peak, Arizona. Spectra were obtained on 2013 Mar. 3, 4, and 5 UT; on the 5th, I also obtained simultaneous time-series photometry.
2.1 Spectroscopy
The spectra are from the 2.4m Hiltner telescope and modular spectrograph, equipped with a 600 line mm- grating and the SITe 10242 CCD detector ‘Templeton’. The region from 4660 to 6732 Å was covered at 2 Å pixel-1, and the 1.1-arcsec slit gave resolution somewhat better than 2 pixels FWHM. Standard stars were observed in twilight when the weather was clear, but unfortunately many of the spectra of the program object were taken through thin cloud or in poor seeing, so not all are of good photometric quality. Exposures of wavelength calibration lamps taken in twilight gave the base pixel-to-wavelength relation, which typically had rms residuals Å, and the reduction pipeline shifted this solution to force the [OI] line (present in all the spectra) to its rest wavelength. Exposure times were mostly 720 s to suppress readout noise and minimize dead time.
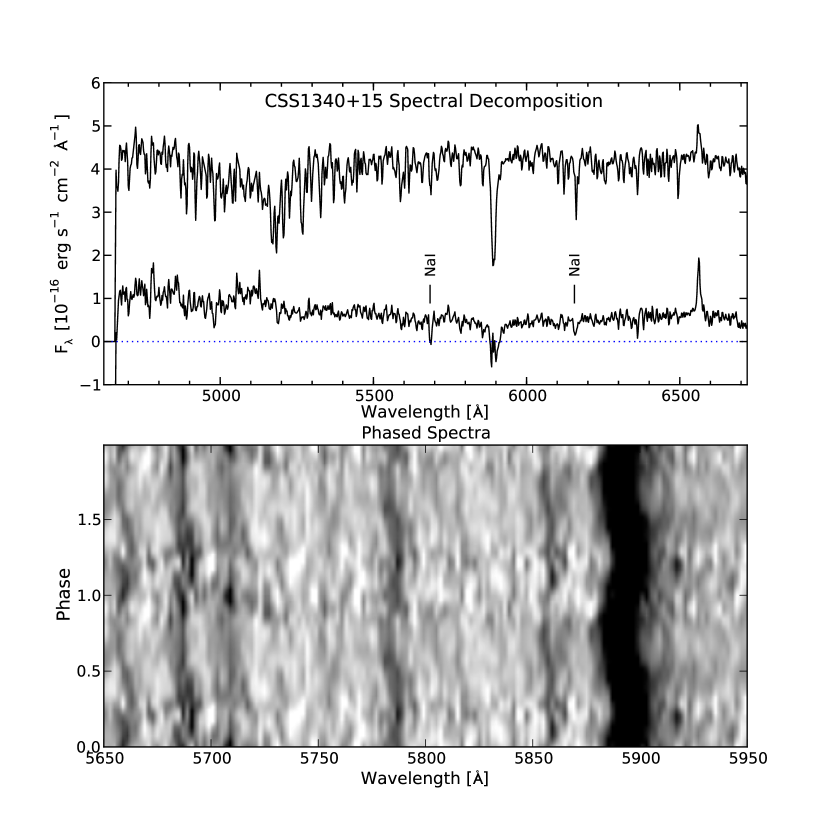
The mean spectrum (Fig. 1, top panel) shows the absorption lines of a late-type star and weak emission at H. I estimated the spectral type and light fraction of the secondary by scaling and subtracting spectra of stars classified by Keenan & McNeil (1989) and looking for the best cancellation of late-type features. This constrained the spectral type to be K4 2 subclasses. The secondary contributes most – possibly almost all – of the system’s light.
Along with the observed spectrum, Fig. 1 shows the result of subtracting a scaled K4 spectrum. The subtracted spectrum shows stronger H emission than the original, because even K stars have fairly strong H absorption, which masks the intrinsically weak emission line. Also, NaD is grossly undersubtracted. Comparison with spectral type standards shows that the NaD absorption in the original spectrum is roughly as strong as that in an M0 star. The sodium blend near 5685 is also badly undersubtracted, and the Na blend near 6158 may also be enhanced, though in the latter case the strong CaI lines near 6160 complicate the interpretation. A similar apparent Na enhancement is seen in the secondary of QZ Ser (Thorstensen et al., 2002b).
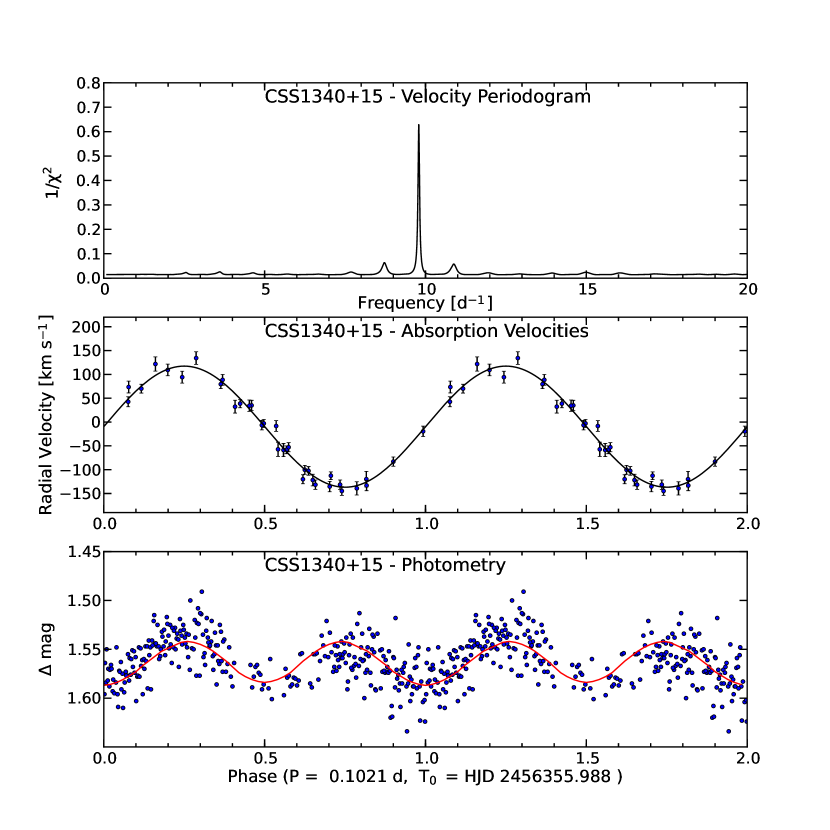
The H line was too weak for radial velocity measurements, but the rich absorption spectrum yielded usable velocities for 34 of the 49 spectra (Table 2). These were measured using the cross-correlation routine xcsao in the rvsao package (Kurtz & Mink, 1998); I used a velocity-compensated composite of G- and K-type velocity standards as a template. Fig. 2 shows the result of a period search of the velocities, using the sine-fitting method described by Thorstensen et al. (1996); the orbital period is obvious. Fitting a sinusoid of the form
yields
| and | ||||
The middle panel of Fig. 2 shows the cross-correlation velocities folded on this period, together with the best-fit sinusoid, and the lower panel of Fig. 1 shows a greyscale representation of the data in the vicinity of the NaD line.
2.2 Time-series Photometry
On 2013 March 5 UT, I obtained simultaneous time-series photometry with the MDM 1.3m McGraw-Hill telescope and an Andor Ikon DU-937N camera. The Andor camera’s sensor is a thinned, backside-illuminated, frame-transfer CCD; the active area is has 512 512, pixels, each 13 m square. Binning this gave a 1282 data array subtending 139 arcsec on a side. Exposures were 45 seconds through a Schott GG420 filter, chosen to suppress scattered moonlight. The vendor-supplied Solis software wrote the images as a FITS data cube, which I reduced using Python-languages programs based on PyFits (Barrett & Bridgman, 2000) and NumPy. Processing steps included subtracting bias and dark images, and dividing by a flat field derived from images of the twilight sky.
The program star and several others were measured in each frame using the aperture photometry task phot from the IRAF implementation of DAOphot. Frames were centered southwest of the program object in order to include a comparison star 102 arcsec to the west and 89 arcsec south, which is mag brighter. Intermittent cirrus clouds greatly degraded the signal-to-noise of some of the images, so images in which the comparison star was attenuated by more than mag were discarded from the analysis.
The lower panel of Fig. 2 shows the magnitudes relative to the comparison star, folded on the orbital ephemeris. A clear double-peaked modulation is present. Comparison with the velocity curve shows that the fainter minimum coincides with inferior conjunction of the secondary, as expected for ellipsoidal variation. This modulation accounts for all the variation – the scatter around the ellipsoidal light-curve is comparable to the scatter in the measurements of similarly faint stars in the field.
3 Discussion
At hr, the - relation for normal CVs predicts a secondary around M3 or M4 (Knigge, 2006). At K4 2, the secondary is clearly well to the warm side of the curve. The apparent Na enhancement reinforces the resemblance to QZ Ser. CSS J134052.0+151341 joins the exclusive club of stripped-core secondaries.
The amplitude of the ellipsoidal variation is fairly small, so the inclination is fairly close to face-on. To quantify this, I adapted the computer code developed by Thorstensen & Armstrong (2005) (to model the AY Sex light curve) to the present case. The icosahedral tesselation of the secondary star, surface-brightness/color/effective-temperature relations, and prescriptions for limb- and gravity-darkening were unchanged. I adopted kelvin as appropriate for a K4V photosphere (Pickles, 1998). The primary star’s luminosity (which heats one face of the AY Sex secondary) was turned off, but to account for a possible accretion disk contribution I added extra light comprising about 15 per cent of the system’s light, guided by the spectral decomposition in Fig. 1 (top panel). In the original case of AY Sex, , , and bands light curves were available, but the present data are in white light, so the color-fitting portions of the code were turned off. I assumed that the white-light behavior is represented adequately by a -band model, which seems reasonable given the available signal-to-noise. I assumed further that the light curve oscillates around , from the data in Table 1.
A model with M⊙, M⊙, and an inclination degrees gave excellent agreement, both with the light curve and the observed velocity amplitude. Assuming a reddening (Schlegel, Finkbeiner, & Davis, 1998), the normalization puts this model at 790 pc. This distance will scale approximately as the secondary mass to the 1/3 power, and inversely with the surface brightness, which increases steeply with the assumed effective temperature. This model is not intended to be unique, but rather to check whether the available information supports a primary star mass in the white dwarf range, which it evidently does.
It is interesting that only one outburst has been observed. EI Psc and QZ Ser also outburst rarely. In the absence of an outburst, an object similar to CSS J134052.0+151341 would be inconspicuous. This raises the question of how many similar objects may remain undetected. The optical spectrum is dominated by a K star, with weak emission, so emission line surveys such as IPHAS (Witham et al., 2007) would not see it. Color-based surveys would fare no better; the optical colors (Table 1) are typical of K stars (Covey et al., 2007), and even the color does not stick out. It seems likely, then, that a sizeable number of these objects remain undetected. This may change in the future; the Large Synoptic Survey Telescope should be capable of detecting quiescent objects of this kind through their ellipsoidal variation – most will be closer to edge-on than this one – or through eclipses. The GAIA astrometric satellite may also contribute, since the secondary stars in similar objects are likely to have radii significantly smaller than normal stars of the same color, leading to distances that are anomalously small for the color and apparent magnitude.
It also may be significant that this object has a period squarely in the middle of the so-called ‘period gap’ (Kolb et al., 1998, and references therein), the interval where relatively few CVs (especially non-magnetic dwarf novae) are found. Interestingly, SDSS J170213.26+322954.1 , the warm-secondary eclipsing system noted in the Introduction, is also well within the gap at almost the same , 2.4 hr Littlefair et al. (2006) .
A popular explanation for the gap, the disrupted magnetic braking scenario, is as follows (Knigge, 2006, and references therein). CVs evolve to shorter periods by angular momentum loss, their secondaries become distended because they go out of thermal equilibrium as mass is removed from their surfaces. Around 3 hr, an abrupt change in the angular momentum loss (usually thought to involve a reconfiguration of the secondary’s magnetic field) quenches the angular momentum loss, causing the secondary to relax back toward its natural radius and detach from the Roche lobe. The system evolves slowly across the gap due to more gradual angular momentum loss, and lights up again around 2 hr as the Roche lobe squeezes down onto the secondary.
CSS J134052.0+151341 is relatively quiescent, but it is not entirely so – it shows H emission and erupted in the recent past. Unless mass transfer is being driven through some mechanism other than Roche overflow, It must be very close to its Roche lobe. Disrupted magnetic braking would require that a CV in the middle of the gap be well-detached from its Roche lobe, so this system must have evolved differently. As Littlefair et al. (2006) suggest, it is possible that the system was dropped into nearly its present configuration in a sudden episode of mass loss driven by dynamical-timescale mass transfer.
References
- Archibald et al. (2009) Archibald, A. M., Stairs, I. H., Ransom, S. M., et al. 2009, Science, 324, 1411
- Barrett & Bridgman (2000) Barrett, P. E., & Bridgman, W. T. 2000, in Astronomical Society of the Pacific Conference Proceedings, vol 216, Astronomical Data Analysis Software and Systems IX, ed. N. Manset, C. Veillet, & D. Crabtree , 67
- Covey et al. (2007) Covey, K. R., Ivezić, Ž., Schlegel, D., et al. 2007, AJ, 134, 2398
- Deller et al. (2012) Deller, A. T., Archibald, A. M., Brisken, W. F., et al. 2012, ApJ, 756, L25
- Drake et al. (2009) Drake, A. J., et al. 2009, ApJ, 696, 870
- Faulkner et al. (1972) Faulkner, J., Flannery, B. P., & Warner, B. 1972, ApJ, 175, L79
- Gänsicke et al. (2003) Gänsicke, B. T., Szkody, P., de Martino, D., et al. 2003, ApJ, 594, 443
- Hambly et al. (2008) Hambly, N. C., Collins, R. S., Cross, N. J. G., et al. 2008, MNRAS, 384, 637
- Keenan & McNeil (1989) Keenan, P. C., & McNeil, R. C. 1989, ApJS, 71, 245
- Lawrence et al. (2007) Lawrence, A., Warren, S. J., Almaini, O., et al. 2007, MNRAS, 379, 1599
- Knigge (2006) Knigge, C. 2006, MNRAS, 373, 484
- Kolb et al. (1998) Kolb, U., King, A. R., & Ritter, H. 1998, MNRAS, 298, L29
- Kurtz & Mink (1998) Kurtz, M. J. & Mink, D. J. 1998, PASP, 110, 934
- Littlefair et al. (2006) Littlefair, S. P., Dhillon, V. S., Marsh, T. R., Gänsicke, B. T. 2006, MNRAS, 371, 1435
- Nelemans (2005) Nelemans, G. 2005, in Astronomical Society of the Pacific Conference Series, vol. 330, The Astrophysics of Cataclysmic Variables and Related Objects, ed. J.-M. Hameury & J.-P. Lasota, 27
- Pickles (1998) Pickles, A. J. 1998, PASP, 110, 863
- Roeser et al. (2010) Roeser, S., Demleitner, M., & Schilbach, E. 2010, AJ, 139, 2440
- Rau et al. (2010) Rau, A., Roelofs, G. H. A., Groot, P. J., et al. 2010, ApJ, 708, 456
- Roelofs et al. (2007) Roelofs, G. H. A., Nelemans, G., & Groot, P. J. 2007, MNRAS, 382, 685
- Schlegel, Finkbeiner, & Davis (1998) Schlegel, D. J., Finkbeiner, D. P., & Davis, M. 1998, ApJ, 500, 525
- Szkody et al. (2004) Szkody, P., Henden, A., Fraser, O., et al. 2004, AJ, 128, 1882
- Thorstensen & Armstrong (2005) Thorstensen, J. R., & Armstrong, E. 2005, AJ, 130, 759
- Thorstensen et al. (2002a) Thorstensen, J. R., Fenton, W. H., Patterson, J. O., et al. 2002a, ApJ, 567, L49
- Thorstensen et al. (2002b) Thorstensen, J. R., Fenton, W. H., Patterson, J., et al. 2002b, PASP, 114, 1117
- Thorstensen et al. (1996) Thorstensen, J. R., Patterson, J., Thomas, G., & Shambrook, A. 1996, PASP, 108, 73
- Thorstensen & Skinner (2012) Thorstensen, J. R., & Skinner, J. N. 2012, AJ, 144, 81
- Witham et al. (2007) Witham, A. R., Knigge, C., Aungwerojwit, A., et al. 2007, MNRAS, 382, 1158
- Woudt et al. (2012) Woudt, P. A., Warner, B., de Budé, D., et al. 2012, MNRAS, 2533
| Property | Value | ReferenceaaReferences are as follows: PPMXL is the PPMXL astrometric catalog (Roeser et al., 2010); CRTS is the Catalina Real Time Survey (Drake et al., 2009); UKDISS is the UK Deep Infrared Sky Survey (Lawrence et al., 2007; Hambly et al., 2008), Data Release 8; SDSS is the SDSS Photometric Catalog, Data Release 9. |
|---|---|---|
| 13h 40m 52s.062 | PPMXL | |
| +15 | ||
| Outburst date | 2010 May 31 | CRTS |
| Outburst magnitude | 14.48 | |
| u | SDSS | |
| g | ||
| r | ||
| i | ||
| z | ||
| V | 18.30bbThe magnitude is computed using an approximation derived by R. H. Lupton and cited at the SDSS website. | |
| Y | UKDISS | |
| J | ||
| H | ||
| K |
| Time | ||
|---|---|---|
| [km s-1] | [km s-1] | |
| 6355.0097 | ||
| 6355.0172 | ||
| 6355.0244 | ||
| 6355.0314 | ||
| 6355.0385 | ||
| 6355.8405 | ||
| 6355.8498 | ||
| 6355.8668 | ||
| 6355.9325 | ||
| 6355.9409 | ||
| 6355.9494 | ||
| 6355.9606 | ||
| 6355.9690 | ||
| 6355.9775 | ||
| 6355.9956 | ||
| 6356.0041 | ||
| 6356.0126 | ||
| 6356.7443 | ||
| 6356.7528 | ||
| 6356.7613 | ||
| 6356.7698 | ||
| 6356.7782 | ||
| 6356.8040 | ||
| 6356.8125 | ||
| 6356.8419 | ||
| 6356.9188 | ||
| 6356.9272 | ||
| 6356.9362 | ||
| 6356.9446 | ||
| 6356.9531 | ||
| 6356.9616 | ||
| 6356.9701 | ||
| 6356.9786 | ||
| 6356.9872 |
Note. — Absorption-line radial velocities. Times listed are the heliocentric Julian date of mid-integration, minus 2 450 000. The time base is UTC.