Stellar Populations and the Star Formation Histories of LSB Galaxies: II. HII Regions
Abstract
The luminosities, colors and H emission for 429 HII regions in 54 LSB galaxies are presented. While the number of HII regions per galaxy is lower in LSB galaxies compared to star-forming irregulars and spirals, there is no indication that the size or luminosity function of HII regions differs from other galaxy types. The lower number of HII regions per galaxy is consistent with their lower total star formation rates. The fraction of total contributed by HII regions varies from 10 to 90% in LSB galaxies (the rest of the H emission being associated with a diffuse component) with no correlation with galaxy stellar or gas mass. Bright HII regions have bluer colors, similar to the trend in spirals; their number and luminosities are consistent with the hypothesis that they are produced by the same HII luminosity function as spirals. Comparison with stellar population models indicates that the brightest HII regions in LSB galaxies range in cluster mass from a few (e.g., Oph) to globular cluster sized systems (e.g., 30 Dor) and that their ages are consistent with clusters from 2 to 15 Myrs old. The faintest HII regions are comparable to those in the LMC powered by a single O or B star. Thus, star formation in LSB galaxies covers the full range of stellar cluster mass.
1 Introduction
The observational tracers of star formation range from the near-UV (Boissier et al. 2008) to the far-IR (Bigiel et al. 2008) and, while each wavelength region has its advantages and disadvantages, LSB galaxies are difficult to observe outside the traditional optical bandpasses. The most visible feature of star formation in LSB galaxies is the H line, produced by young, massive stars that compose the upper end of the IMF. The UV photons emitted by these stars will, in turn, ionize the surrounding gas to form a HII region. While the total H luminosity of a galaxy measures its global star formation history, these HII regions map the amount and location of local star formation, providing a window in to the details of the star formation process.
Studying HII regions in galaxies allows one to 1) investigate star formation both globally and locally, 2) examine the upper mass limit of stellar mass function and 3) map the structure of the ISM. While UV and far-IR emission may provide a more nuanced view of total star formation; the size, location and luminosity of HII regions displays the local variation of star formation directly and can be used to resolve stellar population questions. In addition, the size and luminosity of HII regions provide information on number of ionizing stars and the mass of the underlying stellar associations.
Previous work on HII regions in galaxies focused on high surface brightness spirals and irregular galaxies (e.g., Caldwell et al. 1991, Kennicutt, Edgar & Hodge 1989, Youngblood & Hunter 1999). These studies found that the number of HII regions in a galaxy increases with later Hubble type, in correlation with the total star formation rate (SFR), and found various differences in the HII luminosity function as a function of galaxy properties. However, very little work has been completed on H emission in low surface brightness (LSB) galaxies due to the technical difficulty in measuring narrow band fluxes for object so close to the brightness of the night sky. Studies by Schombert et al. (1992), McGaugh, Schombert & Bothun (1995) and recent work by Kim (2007) represent the deepest H studies in LSB galaxies.
The results from these previous works can be summarized that LSB galaxies have 1) small regions of H emission (assumed to be low in luminosity, although this early data was not flux calibrated), 2) weakly correlated with regions of enhanced surface brightness and 3) no coherent patterns indicative of density wave scenarios. Small and weak HII regions are consistent with the low SFR’s for LSB galaxies as a class of objects, and agreed with the hypothesis that these galaxies are quiescent and inhibited in their star formation histories.
This paper, the second in our series on optical observations of PSS-II LSB galaxies, presents the H spatial results which map the size, location and luminosities of HII regions in our sample galaxies. With this information, our goal is to compare the style of star formation in LSB galaxies with spirals and irregulars to detect any global differences in their star formation histories. The characteristics of importance to the star formation history of a galaxy are the number of HII regions, the luminosity of the brightest HII regions, the shape of the HII region luminosity function and the spatial positions of HII regions with respect the optical distribution of light. Lastly, we examine the optical colors of the HII regions in the hope of resolving the color dilemma in LSB galaxies, their unusually blue colors, yet low total SFR’s.
2 Analysis
Observations, reduction techniques and the characteristics of the sample are described in Paper I (Schombert, Maciel & McGaugh 2011). Our final sample contains 58 LSB galaxies selected from the PSS-II LSB catalog (Schombert, Pildis & Eder 1997) with deep , and H imaging from the KPNO 2.1 meter. H emission was detected in 54 of the 58 galaxies. All detected galaxies had at least one distinct HII region, although diffuse emission account for approximately 50% of the total H emission in most LSB galaxies.
The sample galaxies all have irregular morphology with some suggestions of a bulge and disk for a handful. They range in size from 0.5 to 10 kpc and central surface brightnesses from 22 to 24 mag arcsces-2. Their total luminosities range from 14 to 19 mags, which maps into stellar masses from 107 to 109 . The gas fractions for the sample are between 0.5 and 0.9, so the amount of HI gas covers a similar range.
Identification of a HII region followed a slightly different prescription from previous studies. In our case, we have identified an H knot to be a HII region if it is 1) distinct, i.e. not a filament or diffuse region, 2) has rough circular symmetry (where spatial resolution limits this determination) 3) having a clear peak in H emission, and 4) falling off uniformly around the peak. Due to resolution limits, any particular region may include several HII complexes for more distant galaxies in the sample. However, even for the most distant galaxies, one arcsec corresponds to 400pc which is sufficient to resolve the high luminosity HII regions into smaller components. There was no correlation with the number of HII regions and distance (see §4) which would imply that confusion is not a factor in our sample.
Identification was made by visually guiding a threshold algorithm applied to smoothed H images. The center of confirmed HII knots were determined and the luminosity of each selected region was determined by a circular aperture. The radius of the aperture is determined to be the point where the flux falls to 25% of the peak emission. This value is used for the size of the HII region, regardless of any indication of non-circularity.
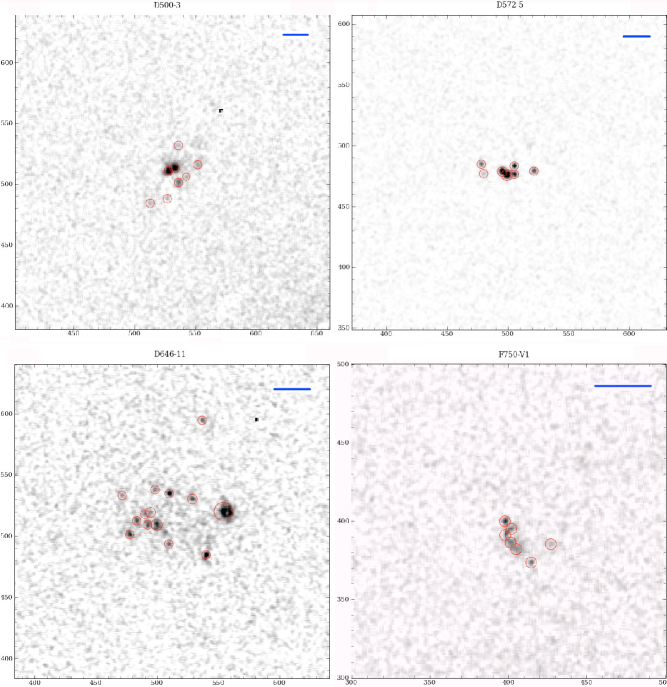
Four examples of our HII region selection process is shown in Figure 1 where the selected HII regions are shown inside red circles. A five kpc scale is indicated in each frame. Continuum images (Johnson ) can be found at the our data website (http://abyss.uoregon.edu/js/lsb), as well as all the information on individual HII regions plus color and surface brightness data on the sample. The four examples in Figure 1 were selected to illustrate several key points about the HII regions in LSB galaxies.
Galaxy D500-3 (upper left) displays two bright regions near the galaxy core and a number of fainter regions surrounding the core. None of the HII regions are evident as higher continuum surface brightness regions from frames. Even though the brightest two regions are relatively high in H luminosity (38.24 and 38.17 log LHα, approximately 20 Orion complexes), their stellar populations have no effect on the optical structure of the nearby region of the galaxy. The 5 kpc bar is indicated in the upper right of the frame, where the larger HII regions are 100 to 150 pc in size, ranging down to 25 pc for the fainter regions.
Galaxy D572-5 (upper right) exhibits a more luminous set of HII regions from other LSB galaxies, again several bright regions in the core and a few fainter HII regions in the outer regions. There is some indication of diffuse H emission in the outer disk, but insufficient to warrant inclusion by our selection algorithm. The brighter HII regions are just visible in the continuum frames as distinct blue knots.
Galaxy D646-11 (lower left) displays more scattered H emission. The selected HII regions are not centrally concentrated. In fact, the brightest region (more of a shell or bubble than a star complex) is located in the outer disk. There are several filaments and diffuse H regions in the core that were not selected as HII regions. The brighter HII regions are associated with bluer continuum colors, but this is not always the case for LSB galaxies as a whole (Pildis, Schombert & Eder 1997).
Galaxy F750-V1 (lower right) is a smaller, nearby LSB galaxy. While seven HII regions were selected, most of its H emission is diffuse. It is a subjective determination to select any knot in the core region. There is no signature from the HII regions in the continuum images; however, there is enhanced blue stellar colors in the diffuse regions.
Similar criteria to identify H knots were used to identify surface brightness knots in the frames. The mean surface brightness isophotes (based on ellipse fits) are subtracted from the raw image. This subtracted image is threshold searched for optical knots. As with the H knots, these regions are marked and measured with circular apertures defined by the 25% width. In the final analysis, 492 HII regions were identified in 54 LSB galaxies and two DDO objects (154 and 168). In addition, 271 optical knots were identified in the frames. Of the 492 HII regions, 207 had no distinct optical counterpart. Of the 271 knots, only 49 had no detectable H emission. The properties of these regions will be discussed in §7.
3 HII Regions Sizes and Luminosities
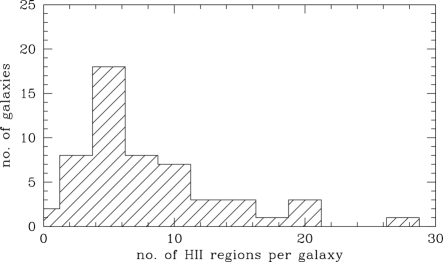
In our total LSB sample, 54 (93%) galaxies had more than one identifiable HII region. The four galaxies undetected by our H imaging had the four lowest gas fractions (less than 0.4). A histogram of the number of HII regions per galaxy is shown in Figure 2. The typical of HII regions per galaxy is between 3 and 10, which is quite low for late-type galaxies with irregular morphology (Caldwell et al. 1991) but consistent with values from early studies of H emission in LSB galaxies (McGaugh, Schombert & Bothun 1995). We note that these mean values are much less than the numbers found by Youngblood & Hunter (1999) for HII regions in dIrr’s. That number is usually above 20 HII regions per galaxy; but, this is due in part to our different selection schemes and the intrinsic nature of rich, star-forming dIrr’s. We have two galaxies in common, DDO154 and DDO168. Youngblood & Hunter find 74 and 58 HII regions, respectfully, whereas we only find 14 and 25 for the same systems. While this might appear that we are incomplete in our HII region selection, the total H fluxes are in agreement and the difference in number simply reflects our more stringent selection criteria in defining clear, isolated HII regions, rather than H filaments.
The H luminosities for all the HII regions in our sample is shown in Figure 3 (note we distinguish the total H of a galaxy, , versus the H luminosity of an individual HII region, ). The HII region luminosities range from ergs s-1 for the faintest regions to 1039.5 for the brightest regions. A single O7V star results in a HII region of log (Werk et al. 2008), although HII regions powered by single B0 stars are found in the LMC with to 36.2 (Zastrow, Oey & Pellegrini 2013). Thus, the faintest regions are difficult to explain under the observation that very few O or B stars are born in isolation (Chu & Gruendl 2008) or may be the result of PN ionization (Walterbos & Braun 1992). The brighter regions correspond to a 30 Doradus sized complexes and would contain solar masses of gas; however, even these individual regions would not be detected in CO surveys of LSB galaxies (Schombert et al. 1990).
In some ways, the distribution of HII region luminosities in LSB galaxies are similar to the distribution in early-type spirals rather than irregulars. In early-type spirals, there are more low luminosity HII regions relative to the brightest ones (Kennicutt, Edgar & Hodge 1989), with fewer of the massive star forming regions found in dwarf irregulars. On the other hand, LSB galaxies with HII regions brighter than log do exist, but HII regions of this size are not found in Sa spirals (Caldwell et al. 1991). Thus, it seems the HII regions in LSB galaxies follow more closely the pattern of other galaxies with irregular morphologies; unfortunately, we lack sufficient statistics to construct a HII luminosity function for individual galaxies in order to rigorously examine this effect.
Flux completeness for our HII region selection is a greater concern for our sample, for we explore a larger volume of the Universe than other samples as the original PSS-II catalog was surface brightness selected with an angular size limit, not luminosity limited. The individual HII region luminosities are shown in Figure 3 as a function of galaxy distance. As can be seen in this Figure, the brightest HII regions are found in the most distant galaxies (which are also the most massive/brightest galaxies). In addition, the galaxies farther than 40 Mpc are deficient in HII regions fainter that log = 38. Interestingly, the 40 Mpc limit is the same limited distance found by Kennicutt, Edgar & Hodge (1989) based on resolution experiments with their H imaging study.
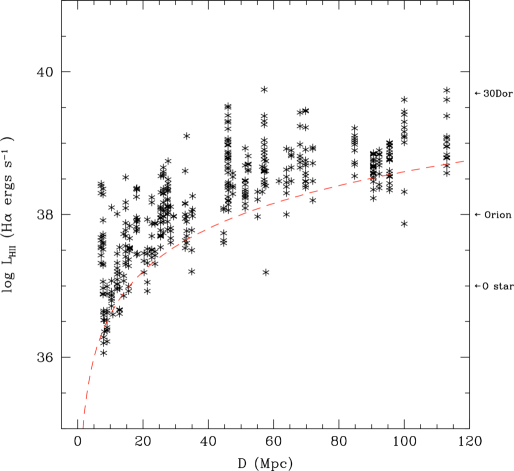
The lack of fainter HII regions for the more distant galaxies is probably due to a lack of spatial resolution to distinguish a HII complex from diffuse H emission. To test this hypothesis, we selected a subset of galaxies between 20 and 30 Mpc and deconvolved their H images to simulate their appearance at 80 to 120 Mpc. As expected, the fainter HII regions (log ) dropped below the threshold of detection. However, due to the typical wide spacing of HII regions in LSB galaxies, there was no significant increase in the brightness of the remaining HII regions due to blending. We conclude that our sample will severely under sample low luminosity HII regions for objects greater than 40 Mpc in distance and, thus, any discussion of a HII region luminosity function must take this bias into account.
Even for the more complete nearby portion of our sample ( Mpc) the ratio of is dramatically different from those found by Youngblood & Hunter. Their distribution (their Figure 10) displays very few galaxies with ratios less than 80%, such that a majority of H emission comes from distinct star forming regions, although the determination method differs from our calculations in the sense that they assign HII regions to complexes then compare the amount of H flux from complexes versus their total fluxes. For our sample, a significant amount of H emission in LSB galaxies (typically 50%) arises from a warm, diffuse component, rather than directly from HII complexes, in agreement with the dwarf galaxies studied by van Zee (2000). The ionizing source of this diffuse component is difficult to determine (Hoopes et al. 2001). Although this conclusion is strongly dependent on whether one can isolate small, weak HII regions in the diffuse component, objects that our more stringent selection criteria would miss.
Another concern is that the brightest HII regions are found in the most distant galaxies. This may be due to confusion, where the HII regions selected by this study are, in fact, blends of fainter HII regions blurred by distance. While this may be true for some individual cases, the number of HII regions as a function of distance does not show a decreasing trend with distance, a relationship one would expect if a number of fainter HII regions are being mistakenly grouped together as one complex. The more likely trend is that fainter HII regions are simply indistinct and confused with diffuse H emission, therefore, not selected by our criteria.
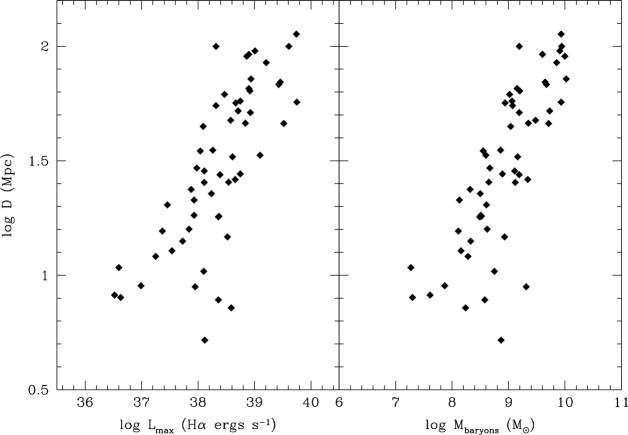
Figure 4 displays the luminosity of the brightest HII region () and the baryon mass of a galaxy (stellar mass plus gas mass) as a function of distance. As noted in Paper I, the most massive LSB galaxies in our sample are at the largest distances. The brightness of the brightest HII region also increases with distance, in synchronous with the baryon mass (see §6). We conclude that the reason that the brightest HII regions in LSB galaxies are found in the most distant galaxies is due to a volume selection effect. The more distant objects in our sample are the brightest by luminosity (and the largest in baryon mass) and are also galaxies with the highest H fluxes in the sample. The low mass, low H luminosity galaxies in the sample would not be found at large distances due to the angular size limit to the PSS-II catalog. There is no reason to believe that Malmquist bias plays a role in our sample, as it was not selected by total or H luminosity. The brighter HII regions in distant galaxies simply reflect the diversity of LSB galaxies, where LSB galaxies with bright 30 Doradus sized star forming complexes are rare. However, due to the loss of fainter HII regions with distance in the sample, in our following discussions we will distinguish between the distant sample ( Mpc) and the more complete nearby sample.
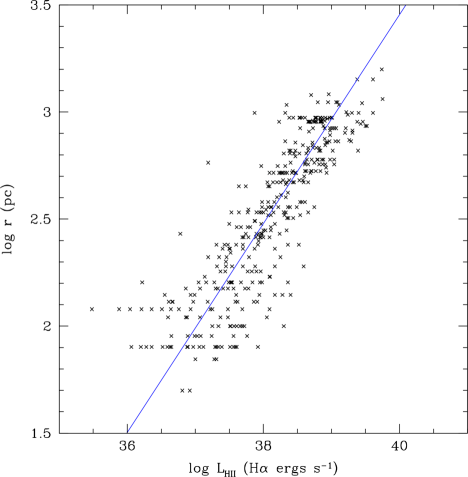
For the sample as a whole, about 50% of the imaged galaxies have between 75 to 200 pc/pixel resolution, 25% have a resolution less than 50 pc/pixel, where the radius of a HII region is estimated by the point where the flux falls to 25% the peak flux. A plot of HII region radius (, in pc’s) versus their H luminosity is shown in Figure 5. The slope of the relationship is consistent with log , meaning that we detect all the H photons produced in the complexes. Foreground extinction by dust is very small in LSB galaxies compared to spirals, in agreement with the lack of far-IR detection for LSB galaxies and their low mean metallicities (Kuzio de Naray, McGaugh & de Blok 2004). Hence, we make no corrections for internal extinction in any of our quoted flux values.
4 HII Region Numbers
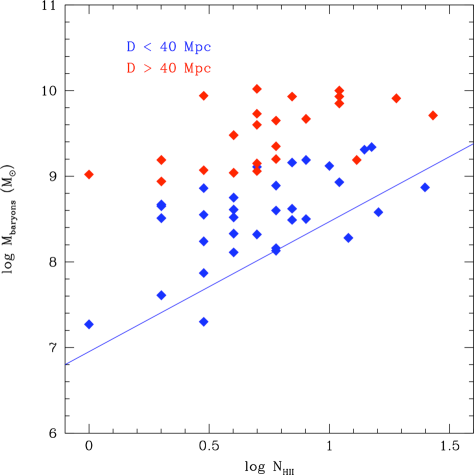
The number of HII regions as a function of galaxy mass is shown in Figure 6. There is a similar relation between number of HII regions and galaxy mass as found by Youngblood & Hunter (1999) (blue line in Figure 6). Again, the distant galaxies in our sample fail to display any relationship due to the under counting of fainter HII regions. The nearby sample displays the same slope as Youngblood & Hunter, although our more stringent detection criteria shifts our number counts to lower values.
The relationship between number and galaxy mass may simply reflect the statistical effect of more gas material in a larger volume results in more star formation events. As star formation is driven by local density (Helmboldt et al. 2005), then more volume will produce more individual star forming regions. There is a also a trend of brightest HII region flux with the number of HII regions; but, again, this reflects the statistical behavior of larger volume provides a greater chance of a larger star formation event.
The number density of HII regions per kpc-2 has a weak trend of decreasing density with increasing galaxy mass where the typical number density (for the Mpc sample) is between 0.1 and 1 HII regions per kpc-2 with a mean of 0.3. This is similar to the mean value for Sm/Im type galaxies from Kennicutt, Edgar & Hodge (1989). There is no trend of number density with galaxy mass/size; however, the sample has a limited dynamic range in galaxy size and mass.
5 HII Regions Locations
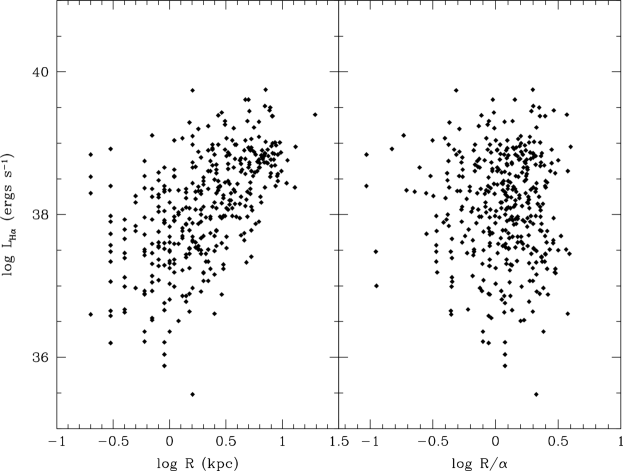
The relationship between the H luminosity of each HII region and its distance from the galaxy center is shown in Figure 7. While the absolute distance, in kpcs, displays a trend that the brightest HII regions are found in the outer regions (left panel), this is an artifact of the effect that the largest (brightest) galaxies in the sample have the brightest HII regions. When the distance from the galaxy core is displayed in terms of the scale length of the galaxy (, from exponential fits to the frames), the relationship disappears (right panel). The lack of radial correlation in Figure 7 is reinforced by the fact that the location of the brightest HII regions are also independent of their distance from the galaxy center.
Our interpretation for a lack of correlation between HII region luminosity and distance from the galaxy center is that this reflects the underlying gas distribution in LSB galaxies. In general, the HI gas density in LSB galaxies is much more extended than the optical image and the density levels are flat out to several optical scale lengths (de Blok, McGaugh & van der Hulst 1996). While it is the molecular gas, not neutral hydrogen, that drives star formation (Scoville 2012), the distribution of H2 gas in LSB galaxies is not directly known (Matthews et al. 2005) and HI serves as a necessary proxy. However, since the density of HI gas in LSB galaxies is low (as are their stellar densities) and typically constant with radius (stellar surface brightness profiles are also very shallow exponentials), the lack of a radial trend in decreasing gas density with radius means that star formation will be dominated by local density enhancements rather than global processes. And, as concluded by other studies, it is clear that the spatial distribution of star formation in LSB galaxies differs from the global patterns found in spirals (Bigiel et al. 2008, O’Neil, Oey & Bothun 2007).
Presumably, the SFR will halt when the molecular gas surface density drops below a critical value, but an estimate of where that radius occurs requires more HI information than is available for our sample. However, there are numerous examples of HII regions at very low surface brightnesses in LSB galaxies (see Figure 10 for an example where H emission is found beyond 5 scale lengths). Over 1/3 of the HII regions in our sample occur in regions where the surface brightness is below 25 mags arcsecs-1 (which corresponds to less than 4 pc-2) and 1/2 the HII regions have no optical signature (an optical knot or surface brightness enhancement) even at such low surface brightnesses (indicating a very low cluster mass). This is an important observation with respect to LSB galaxies as star formation has always been assumed to be inhibited in low density environments, but not non-existent.
Star formation, as traced by H is loosely correlated with optical surface brightness in LSB galaxies, in the sense that for HII regions without detectable optical knots there is the trend that the brightest HII regions are located in regions of the galaxy with higher surface brightness. However, the trend is by no means exact and there exist many examples of strong HII regions in areas of very low stellar density. Gravitational instability models suggest a threshold for star formation where the gas density falls below a critical value (Kennicutt 1998) and star formation efficiency in HSB galaxies generally follows stellar densities more strongly than gas densities (Leroy et al. 2008). But, star formation in the low surface brightness regions of our sample suggests some other method allows the formation of the cold phase of the ISM without the gravitational pull from stellar mass (see also Thornley, Braine & Gardan 2006) and that gravitational instability from stellar density does not play a dominant role.
HII regions tend to avoid the cores of LSB galaxies, as can be seen in scale length panel of Figure 7. While the central peak of stellar luminosity in LSB galaxies is ill-defined, due to their irregular morphology, their outer isophotes are usually fairly regular and can be used to define a center of stellar mass. The fact that HII regions tend to be found in regions outside the core may simply reflect the lumpy distribution of stars and gas in LSB’s (Pildis, Schombert & Eder 1997) rather than formation effects (i.e., spiral bulges). LSB galaxies rarely have the central concentrations, bulges or even AGN behavior that would indicate present, or past, nuclear star formation that is common in many starburst and spiral galaxies (Schombert 1998).
6 Brightest HII Regions
One area where completeness is not an issue is the characteristics of the brightest HII region in each galaxy. This region represents the largest site of star formation in each galaxy and, presumably, the largest concentration of ionizing O stars. While the HII region luminosity function predicts the number of bright HII regions in a galaxy, there is no particular model or framework for understanding the relationship between the luminosity/mass of the brightest region and global characteristics of a galaxy (Leroy et al. 2008).
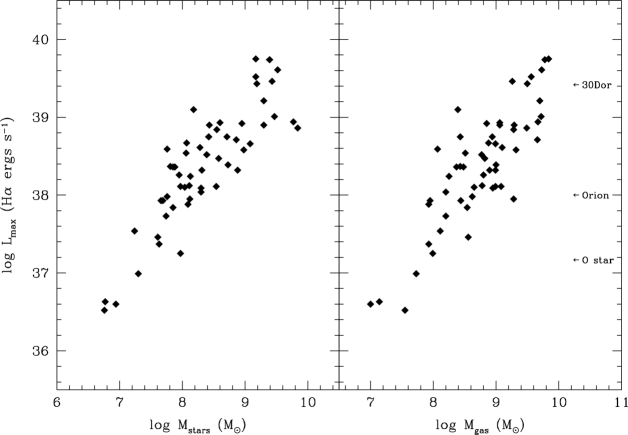
There are clear, distinct correlations between the luminosity of the brightest HII region () and galaxy luminosity (i.e., a proxy for stellar mass), gas mass and the total H luminosity of the galaxy. The first two correlations are shown in Figure 8, where stellar luminosity is converted to stellar mass following the prescription of McGaugh & de Blok (1997) and gas mass corrected from HI mass for metallicity and molecular contributions. The correlation with total H luminosity is shown in Figure 9.
If the amount of local star formation is determined by a random process of gas collection (e.g., cloud-cloud collisions), then the correlations with galaxy mass would simply reflect the statistical nature of more star formation with larger gas mass and a higher chance of building a large, bright HII complex with more available gas. In that scenario, the correlations should be stronger with gas mass versus stellar mass (as the available gas reservoir is the fuel for star formation, not stellar mass), and the fact that there is no significant difference may signify at strong evolutionary connection between the formation of stellar mass and the available gas supply. At the very least, the current SFR in an LSB galaxy has a strong evolutionary connection with its past as defined by stellar mass build-up, even if a significant fraction of the current SF is occurring in low stellar density regions (perhaps future HSB regions).
The statistical nature can be understood better in terms of comparing the total star formation rate of galaxy (as given by the total ) and the luminosity of the brightest HII region (). The star formation rates of LSB galaxies are low compared to other irregular galaxies (Schombert, Maciel & McGaugh 2011). However, if the distribution of HII region luminosities follows the same luminosity function as other galaxies, then there should be simply a smaller number of HII regions that can form for a given value of total . Thus, the probability of finding a HII region of a particular luminosity decreases with higher HII region luminosities.
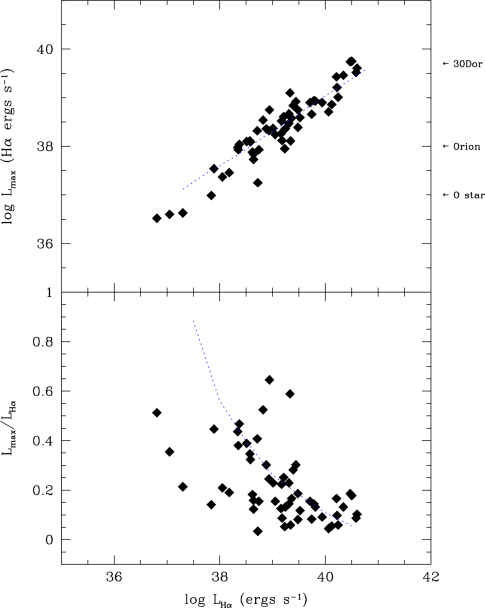
The correlation between total galaxy H luminosity and the luminosity of the brightest HII region is found in Figure 9 (top panel), along with the ratio of the brightest HII region luminosity and the total H luminosity (bottom panel). The brightest HII regions correspond to approximately 200 O7V stars (Werk et al. 2008), yet as the total SFR increases for the sample, they contribute only 10 to 20% to the total H luminosity. The diffuse component means that this value will never be above 0.5 in LSB galaxies.
In order to test the idea that the properties of the observed HII regions are simply the result of small number statistics, we constructed a simple Monte Carlo simulation by randomly selecting HII region luminosities from the luminosity function as given in Youngblood & Hunter (1999) for dwarf irregulars. The HII region luminosities were randomly selected by their luminosity function probability then added until the total set matched a given value. The luminosity of the brightest HII region was then output. After running 10,000 simulations per luminosity bin, the mean brightest HII region luminosity was determined as a function of . The results from these simulations are shown as the blue lines in Figure 9.
The agreement between the simulation and the data (top panel in Figure 9) is excellent and demonstrates that, despite previous claims of truncated LF’s in LSB galaxies (O’Neil, Oey & Bothun 2007, Helmboldt et al. 2005), the luminosity of the brightest HII regions is consistent with the same pattern of HII regions for dwarf irregulars. The ratio of and the total H luminosity is also in agreement with the simulations, where a lack of near unity simply reflects the statistical improbability of finding a single HII region that contains all the H flux of a galaxy including any diffuse emission.
7 Optical Colors and HII regions
The identification of HII regions in the H images allows us to use the same apertures on the and images to extract continuum luminosities and colors. As described in §2, we have divided the sample of identified optical and H knots into three types; 1) those regions with H emission, but no enhanced optical flux above the mean surface brightness of the local isophote value, 2) knots with both H and optical emission and 3) knots only visible in images without detectable H emission. These three regions would, presumingly, correspond a low luminosity HII region (no visible stars), a young HII region with some blowout and visible stars (Orion type HII region) and an evolved stellar cluster or association sufficiently old to be free of any remaining hot gas. The regions of the first type (no optical enhancement) are slightly redder than those HII regions with an optical knot, but display no extra reddening compared to the regions surrounding them. They may, in fact, simply represent regions where the luminosity of the underlying star cluster is small compared to the local galaxy light, although this is a problematic interpretation due to the low surface brightness nature of these regions.
An example of H versus optical knots is shown in Figure 10. In this Figure, the H and frames for F608-1 are plotted at the same scale (150 arcsecs to a side). The HII regions are marked in both panels by red circles, as determined from the H image. There are several examples of H knots with no visible optical emission (the two HII regions farthest to the right and topmost). There are also several examples of an HII region with a distinct optical knot in the image (e.g., the three brightest H regions). The faintest HII regions correspond to log between 36.2 and 36.5. The brightest three HII regions are log of 36.8, 36.9 and 37.0, comparable to a cluster of stellar mass between and ionized by a dozen O stars.
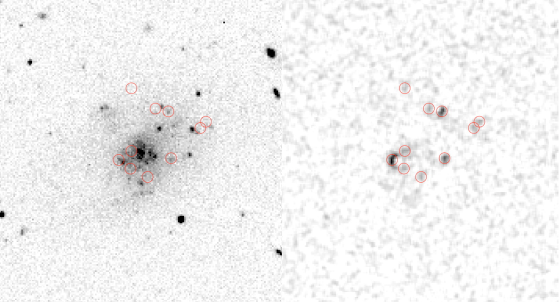
For the 429 regions with H emission, we have plotted their H luminosities versus their B-V colors (determined through the same apertures as the H fluxes, in Figure 11). No internal extinction corrections have been applied, although gas and dust are probably available in sufficient quantities to alter the colors. And, more importantly, no effort was made to subtract out the underlying galaxy light (see below) which is necessary to compare to regions without any obvious optical emission.
Figure 11 displays a very weak trend for bluer optical colors with increasing H luminosity. This trend is as expected with greater H flux implying a larger number of ionizing O stars per HII region and, therefore, greater blue flux (see Caldwell et al. 1991). However, the poor relationship only emphasizes the rich color structure that is found in LSB galaxies where star forming regions are often associated with blue shells and filaments and color features uncorrelated with star forming regions (to be studied in a later paper). It is worth noting that the color-H trend is not as blue as HII regions in early-type spirals (Caldwell et al. 1991). In that sample, HII regions with log have colors less than zero. Many of the regions with optical emission have much bluer colors (see below) and the colors for low luminosity HII regions are correlated with the nearby galaxy colors. We anticipate that the underlying colors will be less than once the galaxy light is subtracted.
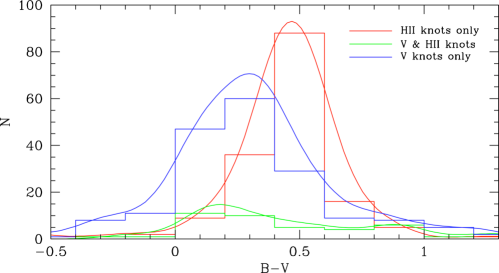
A comparative histogram of colors within the various H and knots is shown in Figure 12. These colors were calculated by subtracting the local galaxy isophote from those HII regions with optical knots, leaving only the luminosity above the underlying galaxy luminosity density. For HII regions without optical knots, the local galaxy color is used. This technique does not bias the calculated color for the optical knots, but it was unsurprising to find the majority of them have colors bluer then the local galaxy color as was noted in the two color maps from Paper I.
Here, the reddest colors are found for the H knots without any optical signature. It should be noted that these H only knots also typically have the lowest H luminosities. In other words, these are regions that are ionized by a single or a very small number of O or B stars. Their mean color is 0.45, which basically confirms that these regions have little effect on the surface brightness or local color as these values conform to the mean total color of LSB galaxies. The underlying stellar association lack sufficient luminosity to alter the galaxy’s isophotes and colors, even at these low surface brightness regimes ( pc-2 = 1 to 4).
Regions which display HII emission and an optical enhancement tend to be bluer than sole H knots (mean = 0.25) and are also brighter in H luminosity with values that correspond to between tens to hundreds of O stars per region. This trend of optical detection correlated with H emission was also seen in early-type spirals by Caldwell et al. (1991). The bluest knots agree well with the bluest regions for spirals (). Lastly, the optical knots without H emission span a full range of colors, although with a mean color slightly redder than the optical knots with H emission. The slightly redder colors probably indicates an evolutionary effect, i.e. as a cluster ages and the ionizing stars die off, the HII region dissipates and the cluster ages and reddens (see below).
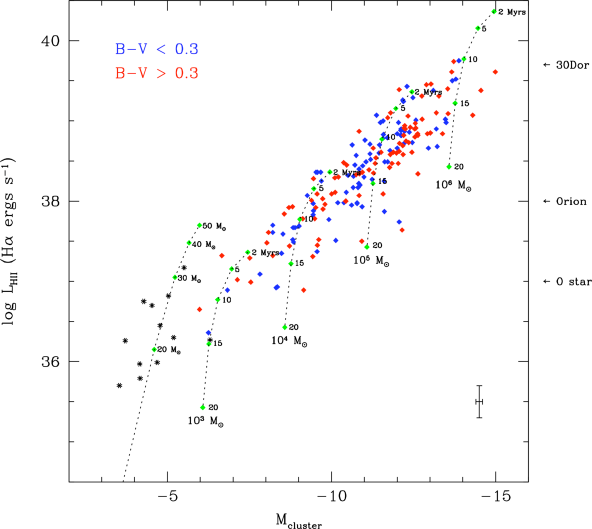
To examine this evolutionary processes in greater detail, we plot in Figure 13 the absolute magnitude of the knot (presumably a stellar association), the HII region H luminosity versus . The absolute magnitude of the stellar association or cluster ranges from values of to , which would correspond to a range of cluster masses from open clusters to globular sized if age were not a factor. However, assigning a cluster mass to the magnitude is a difficult procedure, for while the luminosity relates the number of ionizing O stars per region, the total number of stars (as given by the IMF) will be extremely sensitive to the age of the HII region (Leitherer et al. 2010). For example, a 10 Myr cluster has the same magnitude as a 100 Myr cluster and a 500 Myr cluster (Bruzual & Charlot 2003).
We have divided the sample into red () and blue () clusters. The division of the sample by color is clear, the blue clusters have higher values then red clusters at constant cluster luminosity. The inverse interpretation, that red clusters having brighter magnitudes at a constant H value is opposite to what one would expect from spectroevolutionary models where an aging cluster will redden by 0.3 in over 500 Myrs, but the luminosity of the underlying cluster will have decreased by 3 magnitudes. A more plausible scenario is that age is the defining factor in the difference between red and blue clusters in Figure 13. The blue clusters are younger and have more ionizing stars per unit cluster mass producing higher H luminosities. Over 100 Myrs, the number of ionizing stars decreases by a factor of 3 (Werk et al. 2008) while the color has reddened by 0.2. This is consistent with the trend seen in Figure 13.
In order to test this hypothesis, we have constructed a series of stellar population models taking the population colors and luminosities from Bruzual & Charlot (2003) for low metallicity ([Fe/H] = 0.4) tracks. Starting with a given stellar mass, we apply the IMF from Kroupa et al. (2011) to determine the number of stars with ionizing photons. We then apply the ionization Q curves from Martins et al. (2005) to determine the H luminosity of the cluster as a function of age. Each zero age model is then aged used a standard stellar lifetime as a function of mass, the Q values are recalculated and new cluster luminosities are determined. The resulting tracks are shown in Figure 13.
As can be seen in Figure 13, the star forming regions in LSB galaxies range in stellar mass from globular cluster sized (), such as 30 Doradus, to small associations (), such as the California nebula and the Taurus cloud in our own Galaxy. In addition, HII regions vary in age from 2 to 15 Myrs, although a majority of the detected HII regions have ages between 10 and 15 Myrs. We note that the position of the model tracks with respect to H luminosity are extremely sensitive to the shape of the upper end of the IMF. However, the top edge of our sample agrees well with the zero age line from our models, indicating that the upper end of the Kroupa IMF appears to closely represents the IMF in LSB galaxies.
Low luminosity HII regions, lacking any optical signature, would presumably fall to the bottom left of this diagram. For comparison, we have plotted the data from Zastrow, Oey & Pellegrini (2013) for single O or B clusters in the LMC (black symbols in Figure 13). Also shown are single star ionization curves for single star mass of 10 to 50 . HII regions with log less than 36.5 would fall in this region, and have visual luminosities and mean surface brightnesses below detection levels (a cluster within a 100pc pixel would only increase the surface brightness of that pixel by 1%).
8 Conclusions
LSB galaxies typically have low total SFR’s and, thus, fewer HII regions to study compared to spirals and irregulars. We have attempted to overcome this deficiency by observing a larger sample over a greater volume of the local Universe. Our sample of 54 LSB galaxies produced 429 HII regions for study, most having sufficient S/N in their optical images to compare broadband luminosities and colors. Four galaxies in our sample were undetected in H and have the lowest gas mass fraction of the sample, suggesting their lower gas supply is responsible for their lack of star formation.
We summarize our results as the following:
-
(1) LSB galaxies typically have fewer HII regions per galaxy than other irregular galaxies; however, LSB galaxies have a full range of HII region sizes from complexes that encompass regions powered by a single O or B star (log ) to 30 Doradus sized complexes with log . The correlation between HII region luminosity and size is well defined with a slope of two, indicating that we are observing all of the photons from the ionized gas.
-
(2) LSB galaxies have a wide range in the fraction of HII region’s contribution to the total luminosity from 10 to 90%. The fraction having no correlation with galaxy baryon mass.
-
(3) There is no correlation between the HII region luminosity and spatial position in a galaxy. The brightest HII regions do not preferentially appear at any particular radius as normalized by disk scale length.
-
(4) Roughly 1/2 of the HII regions have a distinct optical enhancement above the surrounding isophote. This is interpreted to be stellar mass produced by the star formation event (which is confirmed by their bluer colors compared to surrounding galaxy color). HII regions without enhancement are still, loosely, associated with local stellar density (i.e., surface brightness) in proportion to their . However, there are numerous examples of bright HII regions in faint galaxy regions.
-
(5) The luminosity of the brightest HII region in each galaxy is correlated with the galaxy’s stellar mass, gas mass and total star formation rate. Monte Carlo simulations confirm that these correlations are replicated by an underlying HII region luminosity function that matches that for star forming irregulars. In other words, there is no evidence that the distribution of HII regions luminosities in LSB galaxies differ from that of star forming HSB galaxies, and the underlying star formation mechanisms appear to be the same.
-
(6) As observed in spiral galaxies, there is a weak correlation between the color of a HII region and its H luminosity. And, while regions with H emission are bluer with increasing H luminosity, there are blue regions in a LSB galaxy without H emission.
-
(7) Comparison with stellar population models indicates that the HII regions in LSB galaxies range in mass from a few to globular cluster sized systems. Their ages are consistent with clusters between from 2 to 15 Myrs old. The faintest HII regions are also similar to single O or B star associations seen in the LMC. Thus, star formation in LSB galaxies covers the full range of stellar cluster mass and age.
The hope in studying LSB galaxies was to reveal, perhaps, a new realm of star formation processes or conditions. Where the class of LSB galaxies differ from HSB galaxies in terms of their bluer colors, lower stellar densities and higher gas fractions; however, there is nothing particularly unusual about the individual sites of star formation under more detailed examination. The local process of star formation, cluster size and mass, IMF and gas physics, all are consistent with the style of star formation found in HII regions in spirals and irregulars. With respect to their global properties, the HII regions in LSB galaxies are more similar to other irregular galaxies, again reflecting the sporadic distribution of gas over coherent kinematic processes (i.e., spiral patterns).
References
- Bigiel et al. (2008) Bigiel, F., Leroy, A., Walter, F., et al. 2008, AJ, 136, 2846
- de Blok et al. (1996) de Blok, W. J. G., McGaugh, S. S., & van der Hulst, J. M. 1996, MNRAS, 283, 18
- Boissier et al. (2008) Boissier, S., Gil de Paz, A., Boselli, A., et al. 2008, ApJ, 681, 244
- Bruzual & Charlot (2003) Bruzual, G., & Charlot, S. 2003, MNRAS, 344, 1000
- Caldwell et al. (1991) Caldwell, N., Kennicutt, R., Phillips, A. C., & Schommer, R. A. 1991, ApJ, 370, 526
- Chu & Gruendl (2008) Chu, Y.-H., & Gruendl, R. A. 2008, Massive Star Formation: Observations Confront Theory, 387, 415
- Helmboldt et al. (2005) Helmboldt, J. F., Walterbos, R. A. M., Bothun, G. D., & O’Neil, K. 2005, ApJ, 630, 824
- Hoopes et al. (2001) Hoopes, C. G., Walterbos, R. A. M., & Bothun, G. D. 2001, ApJ, 559, 878
- Kennicutt (1998) Kennicutt, R. C., Jr. 1998, ApJ, 498, 541
- Kennicutt et al. (1989) Kennicutt, R. C., Jr., Edgar, B. K., & Hodge, P. W. 1989, ApJ, 337, 761
- Kim (2007) Kim, J. H. 2007, Ph.D. Thesis.
- Kroupa et al. (2011) Kroupa, P., Weidner, C., Pflamm-Altenburg, J., et al. 2011, arXiv:1112.3340
- Kuzio de Naray et al. (2004) Kuzio de Naray, R., McGaugh, S. S., & de Blok, W. J. G. 2004, MNRAS, 355, 887
- Leitherer et al. (2010) Leitherer, C., Ortiz Otálvaro, P. A., Bresolin, F., et al. 2010, ApJS, 189, 309
- Leroy et al. (2008) Leroy, A. K., Walter, F., Brinks, E., et al. 2008, AJ, 136, 2782
- Martins et al. (2005) Martins, F., Schaerer, D., & Hillier, D. J. 2005, A&A, 436, 1049
- Matthews et al. (2005) Matthews, L. D., Gao, Y., Uson, J. M., & Combes, F. 2005, AJ, 129, 1849
- McGaugh & de Blok (1997) McGaugh, S. S., & de Blok, W. J. G. 1997, ApJ, 481, 689
- McGaugh et al. (1995) McGaugh, S. S., Schombert, J. M., & Bothun, G. D. 1995, AJ, 109, 2019
- O’Neil et al. (2007) O’Neil, K., Oey, M. S., & Bothun, G. 2007, AJ, 134, 547
- Pildis et al. (1997) Pildis, R. A., Schombert, J. M., & Eder, J. A. 1997, ApJ, 481, 157
- Schombert (1998) Schombert, J. 1998, AJ, 116, 1650
- Schombert et al. (1990) Schombert, J. M., Bothun, G. D., Impey, C. D., & Mundy, L. G. 1990, AJ, 100, 1523
- Schombert et al. (1992) Schombert, J. M., Bothun, G. D., Schneider, S. E., & McGaugh, S. S. 1992, AJ, 103, 1107
- Schombert et al. (2011) Schombert, J., Maciel, T., & McGaugh, S. 2011, Advances in Astronomy, 2011,
- Schombert et al. (1997) Schombert, J. M., Pildis, R. A., & Eder, J. A. 1997, ApJS, 111, 233
- Scoville (2012) Scoville, N. Z. 2012, arXiv:1210.6990
- Thornley et al. (2006) Thornley, M. D., Braine, J., & Gardan, E. 2006, ApJ, 651, L101
- Walterbos & Braun (1992) Walterbos, R. A. M., & Braun, R. 1992, A&AS, 92, 625
- Werk et al. (2008) Werk, J. K., Putman, M. E., Meurer, G. R., et al. 2008, ApJ, 678, 888
- Youngblood & Hunter (1999) Youngblood, A. J., & Hunter, D. A. 1999, ApJ, 519, 55
- Zastrow et al. (2012) Zastrow, J., Oey, M. S., & Pellegrini, E. W. 2012, arXiv:1212.5487
- van Zee (2000) van Zee, L. 2000, AJ, 119, 2757