Fluctuations in the electron system of a superconductor exposed to a photon flux
Abstract
We report on fluctuations in the electron system, Cooper pairs and quasiparticles, of a superconducting aluminium film. The superconductor is exposed to pair-breaking photons (1.54 THz), which are coupled through an antenna. The change in the complex conductivity of the superconductor upon a change in the quasiparticle number is read out by a microwave resonator. A large range in radiation power can be chosen by carefully filtering the radiation from a blackbody source. We identify two regimes. At high radiation power, fluctuations in the electron system caused by the random arrival rate of the photons are resolved, giving a straightforward measure of the optical efficiency (%). At low radiation power fluctuations are dominated by excess quasiparticles, the number of which is measured through their recombination lifetime.
In a superconductor well below its critical temperature, the majority of the electrons is bound in a condensate of Cooper pairs. The further the superconductor is cooled down, the closer it gets to its ground state, where all the quasiparticles are condensed to pairs. Due to the low gap energy, the superconductor is sensitive to disturbances from the environment to which it couples. In most experiments this sensitivity is undesirable, but it is particularly suited for detection of radiation. The superconductor can interact with its environment due to either photons or phonons. Photons with an energy higher than the energy gap break up Cooper pairs into quasiparticles. The change in the number of quasiparticles and Cooper pairs changes the electrodynamic response of the superconductor, which can be measured using a microwave resonator pday2003 . Quasiparticles give rise to microwave losses and the Cooper pairs to a kinetic inductance dmattis1958 . In steady state, the number of quasiparticles fluctuates in time around a constant average value. A measurement of the spectrum of these fluctuations allows for a characterisation of the quasiparticle system when exposed to pair-breaking photons, microwave photons or to changes in the bath temperature. The characteristic timescale of the fluctuations, the quasiparticle recombination time, is inversely proportional to the number of quasiparticles skaplan1976 , and is therefore a measure of this number. These fluctuation phenomena are a monitor of the superconducting state and reveal the physical mechanisms that are at the heart of pair breaking in a superconductor.
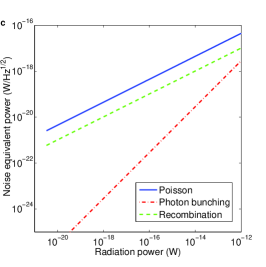
We study these processes in a superconducting pair breaking detector formed by a 50 nm thick Al film. The ideal pair breaking detector can either count single photons while its sensitivity is limited by Fano noise, or is photon integrating and limited by photon noise, the noise from the photon source itself syates2011 . In both cases a high optical efficiency is required. The principle of radiation detection due to pair breaking with superconducting microwave resonators was proposed in 2003 pday2003 ; jzmuidzinas2012 . Since then, several unanticipated sources of excess noise have been identified and studied in depth jgao2007 ; jgao2008b ; rbarends2008 ; rbarends2010b . Here we report on an all-aluminium antenna-coupled microwave resonator detector (Fig. 1a), which is limited only by fluctuations in the electron system that are fundamentally connected to the physical process of pair breaking. We use a blackbody with a variable temperature (3-25 K) and eight optical filters, which define an optical band around 1.54 THz, as shown schematically in Fig. 1b. The radiation power can be changed from W to W. At powers ranging from 0.1 - 700 fW, the sensitivity is only limited by the random arrival rate of the photons, which is evident through the measured power dependence of the noise equivalent power (NEP) as shown in Fig. 1c. At lower radiation powers, we observe a power-independent NEP. This is consistent with generation-recombination noise due to the presence of excess quasiparticles cwilson2001 ; pdevisser2011 . Excess quasiparticles are a general concern for superconducting devices jmartinis2009 ; gcatelani2011 ; mlenander2011 ; mzgirski2011 ; rbarends2011 ; osaira2012 ; driste2012 . In this case they are generated by the microwave readout power pdevisser2012b ; dgoldie2013 . As shown in Fig. 1c, they impose a lower limit to the NEP of this detector of WHz-1/2, which is the lowest reported so far for this type of detectors.
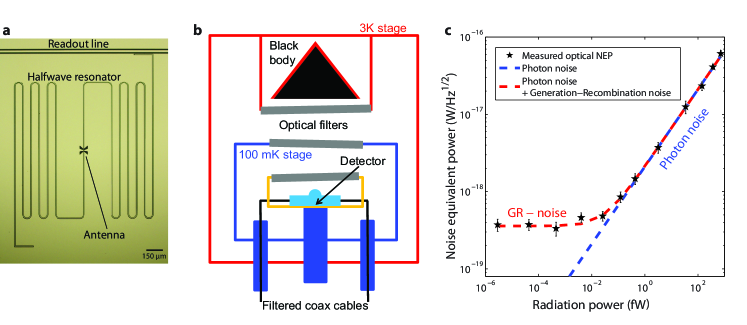
Design of the experiment. The detector is based on a lens-antenna coupled superconducting microwave resonator. The resonator is an open ended half wave, coplanar waveguide resonator, where the central strip (with a width of 3 m) is isolated from the ground plane. The resonators all have different lengths and therefore different resonant frequencies, enabling the read-out of all resonators using a single coaxial line. Radiation is focused by a silicon lens to an X-slot antenna aiacono2011 , optimised for broad band detection from 1.4-2.8 THz. Radiation coupled to the antenna is launched as a travelling wave into the waveguide aiacono2011 , where it is absorbed by breaking Cooper pairs (the gap energy 188 eV). The created quasiparticles, which can diffuse over several millimeters before they recombine, are confined to the central strip. The central strip layer is 50 nm thick, and the groundplane layer 100 nm. The thin central strip layer gives higher response and ensures that most of the radiation is absorbed in that central strip, due to its higher resistance (see Methods). The thick groundplane reduces antenna losses. An advantage of the geometry, shown in Fig. 1a, is that it can also be used at other radiation frequencies by only changing the antenna.
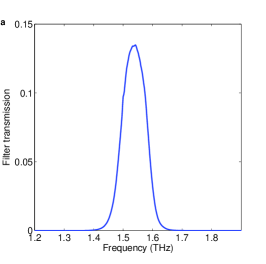
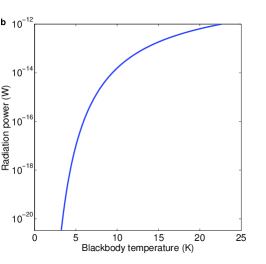
The sample is cooled in a pulse tube precooled adiabatic demagnetization refrigerator. The sample stage is carefully shielded from stray light from the 3 K stage of the cooler, using a box-in-a-box concept with optical filters at each stage, as well as coax cable filters in the outer box jbaselmans2012 . The photon source is a blackbody with a variable temperature between 3 and 25 K. The system is schematically depicted in Fig. 1b. Eight optical filters in series define an optical bandpass of 0.1 THz centred around 1.54 THz. Three filter stacks are essential to eliminate filter heating. The filter transmission of the three filter stages is shown in Fig. 2a. The curves of spectral radiance for high and low blackbody temperature indicate a large tuning range in radiation power (). In fact, can be varied between 3 zW (1 zW = W) and 1 pW (Supplementary Information). Practically this experiment allows us to switch from a regime where the number of quasiparticles is fully determined by the radiation to a regime with a negligible number of optically created quasiparticles. We put a polarising wire grid just before the detector to make sure the detector only receives radiation in the polarisation direction of the antenna.
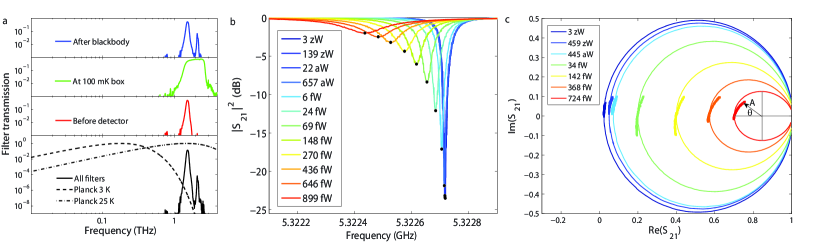
Operation principle. The number of quasiparticles is measured through a measurement of the complex conductivity of the superconductor. The real part of the conductivity, , is due to the quasiparticles and resistive. The imaginary part, , is due to the kinetic inductance of the Cooper-pair condensate dmattis1958 . When the radiation power or the bath temperature is increased, more quasiparticles are generated, which changes both and . The kinetic inductance increases, which leads to a lower resonant frequency , where is the length of the resonator, the geometrical inductance, the kinetic inductance and the capacitance of the line, all per unit length. The losses at microwave frequencies also increase, leading to a shallower resonance. Measurements of the resonance curves for various radiation powers are shown in Fig. 2b. In a practical detection scheme one typically uses an amplitude, , and a phase, , referred to the resonance circle in the complex plane jgao2007 , as shown in Fig. 2c. The amplitude response originates from a change in resistance, whereas the phase changes due to the kinetic inductance. We have only used the amplitude response in this experiment.
The NEP is a convenient quantity to compare the spectra of quasiparticle fluctuations in different regimes, as shown in Fig. 1c. The NEP of the resonator amplitude is experimentally determined from a measurement of the noise spectrum () and the responsivity to radiation () and given by
| (1) |
with the radiation power and the modulation frequency. is obtained experimentally by a linear fit to a measurement of where was slowly varied around the power of interest (Fig. 2c). The last factor in Eq. 1 arises because the quasiparticle system cannot respond to fluctuations that are faster than the quasiparticle recombination time, .
Photon-induced quasiparticle fluctuations. If the average number of quasiparticles is dominated by the absorbed optical photons, the number of quasiparticles fluctuates in time due to two contributions. One is fundamental to every power-integrating detector and due to the random arrival rate of the photons, which induce a random generation of quasiparticles. The power spectral density of fluctuations in the resonator amplitude due to this photon noise is given by syates2011
| (2) |
where the first term is the spectrum of the photon (power) fluctuations and the second term describes the resonator response upon a change in the radiation power. is the frequency of the optical photons and Planck’s constant. The factor is the correction to Poissonian statistics due to photon bunching, with the efficiency from emission to detection of one mode and the mode occupation rboyd1982 , which is negligible for the here measured power range. Eq. 2 is valid as long as , which holds in this experiment since the response time of the resonator, given by , is 6 s. is the quality factor of the resonator.
Because of the pair-breaking nature of the radiation absorption a second noise mechanism arises due to random recombination of the quasiparticles that are generated by the photons. This is half the generation-recombination noise that arises in thermal equilibrium cwilson2004 , because generation noise is already contained in Eq. 2. The spectrum is given by
| (3) |
with the number of quasiparticles and the responsivity of to a change in . Quasiparticle number fluctuations can be converted to power fluctuations through . is the optical efficiency, the efficiency with which power in front of the lens is absorbed in the detector. is the pair breaking efficiency akozorezov2000 , the efficiency with which absorbed radiation power is converted into quasiparticles. For small changes in the quasiparticle number, and therefore . From Eqs. 2 and 3, the relative contribution of photon noise compared to recombination noise is given by at all , for THz and .
The NEP due to photon noise and recombination noise (Eqs. 1-3), for , is given by
| (4) |
which is shown as the blue dashed line in Fig. 1c.
In thermal equilibrium is related to through
| (5) |
where is the single spin density of states at the Fermi level, the volume and the characteristic electron-phonon interaction time skaplan1976 . We take m-3 eV-1 and m3, half the volume of the central strip of the resonator (see Methods). This equation is also expected to hold in non-equilibrium conditions due to optical excitations jgao2008c or microwave readout power dissipation dgoldie2013 at low bath temperatures.
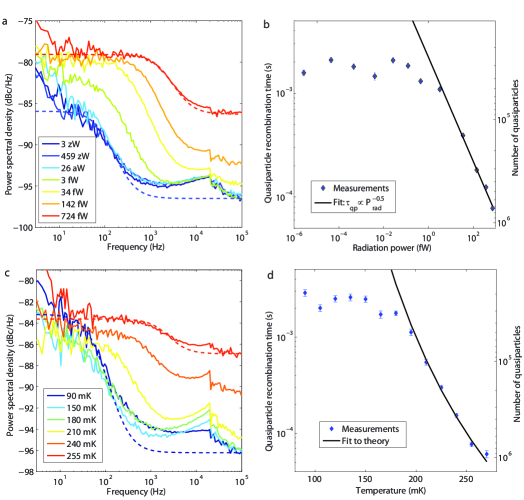
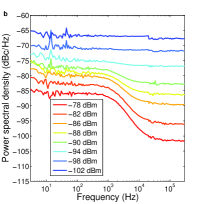
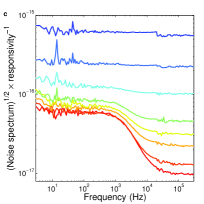
The fluctuations in the resonator amplitude (Fig. 2c) were measured as a function of radiation power at a constant bath temperature of 120 mK (Methods). The resulting power spectral densities are shown in Fig. 3a for a selection of radiation powers and a microwave readout power (the power on the readout line) of -88 dBm. We observe that the spectra show a roll-off, the frequency of which increases as a function of radiation power, due to the decreasing quasiparticle recombination time. The other phenomena in the noise spectrum at higher frequencies (the bump at 20 kHz, a second higher frequency roll-off and amplifier noise) are understood and can be accounted for (see Supplementary Information). The quasiparticle recombination times from the roll-off in the spectra are shown as a function of radiation power in Fig. 3b. , calculated using Eq. 5 is shown on the right axis. Since and (Eq. 5), is expected to scale as . A fit to the measured recombination time as a function of results in , which agrees very well with the expected behaviour. Within the measurement accuracy the same coefficient is measured for other microwave readout powers. The quasiparticle recombination time saturates below about 0.1 fW, which is consistent with the presence of excess quasiparticles pdevisser2011 .
Phonon-induced quasiparticle fluctuations. Excess quasiparticles give rise to quasiparticle number fluctuations pdevisser2011 ; pdevisser2012b . To verify that the spectra in the saturation regime show these fluctuations, we change the number of quasiparticles by varying the number of phonons (the bath temperature) at the same microwave power. The amplitude spectrum is shown for bath temperatures ranging from 90-255 mK in Fig. 3c. The blackbody temperature is kept at 3.2 K, so there are less than 100 quasiparticles due to the radiation power in the sensitive volume. The amplitude spectrum due to quasiparticle fluctuations can be described as cwilson2001 ; pdevisser2011 , because here both generation and recombination are considered. The noise level, which is proportional to , is expected to be constant as a function of temperature (see Eq. 5), which we indeed observe in Fig. 3c. We assume here that is constant for this temperature range jgao2008c . The quasiparticle recombination time extracted from these spectra is plotted as a function of temperature in Fig. 3d. We observe the same saturation level in the recombination time as in Fig. 3b where the radiation power was changed. ns is obtained from a fit to the measured as a function of temperature skaplan1976 ; pdevisser2011 . is slightly different from earlier results (458 ns pdevisser2011 ), which could be due to the higher resistivity and of the Al skaplan1976 .
We have now verified that the noise spectra in the regime of low radiation power (below 0.1 fW) are consistent with quasiparticle number fluctuations. The optical NEP due to quasiparticle number fluctuations is given by
| (6) |
The excess quasiparticles that cause the measured saturation in the recombination time (Fig. 3b) are the explanation of the saturation of the NEP in Fig. 1c.
If we return to the photon induced fluctuations in Fig. 3a, we observe that the noise level becomes also constant at the highest radiation powers. This constant level is expected when Eqs. 2 and 3 are rewritten in terms of . The noise level is higher than in Fig. 3c, because there is both photon noise and recombination noise.
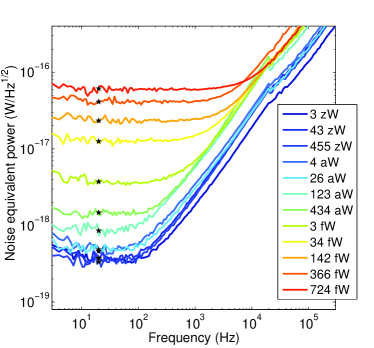
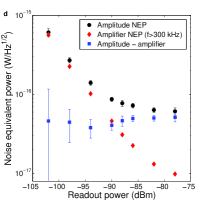
Noise equivalent power. The measured NEP, obtained by using Eq. 1 together with the measured (Fig. 3a), (Fig. 2c) and (Fig. 3b), is shown for various radiation powers in Fig. 4. The NEP measurement was done at a range of microwave readout powers. The results shown in Figs. 1c and 4 are at the readout power with the minimum NEP for that radiation power.
The measured optical NEP at 20 Hz is shown as a function of radiation power in Fig. 1c as our main result. At radiation powers of 0.1 fW and higher, the NEP scales with , as expected from the photon noise limit given by Eq. 4. In this regime, the optical efficiency is obtained by fitting Eq. 4 to the measured NEP. The result is shown as the blue line in Fig. 1c, which gives for a single polarisation, consistent with electromagnetic simulations of the antenna (Supplementary Information).
Below 0.1 fW, the NEP saturates at WHz-1/2. We have seen that generation-recombination noise due to excess quasiparticles dominates the noise spectra in this regime. From the measured recombination time (3 ms, see Fig. 5b), we calculate using Eq. 5. The sum of Eqs. 4 and 6 is shown as the red dashed line in Fig. 1c and gives a good account of the measured NEP. The limit of WHz-1/2 is in good agreement with predictions based on dark experiments pdevisser2012b .
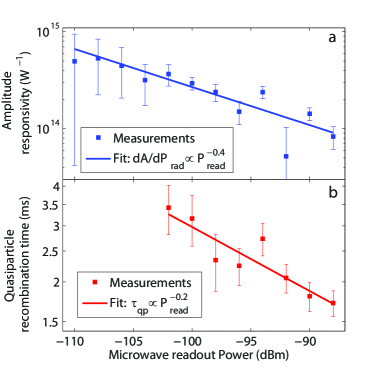
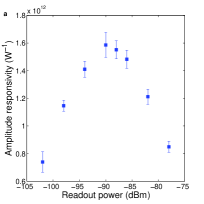
Excess quasiparticles due to the readout power. From recent dark experiments pdevisser2012b (without blackbody source) and simulations dgoldie2013 we expect that the excess quasiparticles at low radiation power are due to microwave readout power dissipation. In an optical experiment excess quasiparticles should lead to a decrease in the optical response. More precisely, the optical responsivity is expected to scale with readout power as in the regime where the readout power dominates the number of quasiparticles (see Supplementary Information for a derivation). The measured responsivity is shown in Fig. 5a as a function of . A power law to the responsivity versus readout power results in , which is in reasonable agreement with the expected scaling.
Fig. 5b shows , extracted from the noise spectra, as a function of . increases when decreases, which is consistent with quasiparticle generation by the microwave readout signal pdevisser2012b ; dgoldie2013 . A fit to the measured data gives . If the absorbed microwave power would scale linearly with , we would expect (Supplementary Information). The difference may be caused by the intricate distribution of the quasiparticle over energies due to the microwave absorption dgoldie2013 .
Discussion. At higher radiation powers, where the noise spectrum is dominated by photon noise, the optical responsivity also changes with readout power. In this regime ( 1 fW) however, the measured photon noise NEP stays the same, as expected from Eq. 4 (Supplementary Information). Therefore, when photon-noise dominates the noise spectrum, one can safely use high readout powers to suppress amplifier noise.
At the lowest readout power where was determined, -102 dBm, the quasiparticle recombination time is 3.5 ms, which corresponds to a quasiparticle density m-3. This density is still high in comparison with the lowest reported values for superconducting qubits and Cooper pair transistors osaira2012 ; driste2012 (less than 0.1 m-3), but inherent to the relatively high microwave powers we need in this type of experiments. The measured limit in optical NEP due to excess quasiparticles is comparable to the lowest observed optical NEP in other detectors for similar wavelengths bkarasik2011 ; maudley2012 ; kstone2012 .
A reduction in is possible by using a parametric amplifier with high bandwidth and dynamic range beom2012 . This allows a reduction of the readout power by about a factor 10. In the current design however, the detector would become too slow for practical use at low readout power due to the long recombination time. The most feasible route towards lower NEP with aluminium, the most reliable material so far, is to choose geometries in which the active volume is dramatically reduced, which could also be the route towards single photon counting at terahertz frequencies.
Methods
Sample design.
A layer of aluminium with a thickness of 100 nm is sputtered onto a sapphire substrate and serves as the ground plane for the microwave resonators. The microwave resonator is a coplanar waveguide resonator with a central strip width of 3 m and slit widths of 1.5 m. The central strip of the resonator is made of a second layer of 50 nm Al. The critical temperature of the 50 nm layer is measured to be K, from which the energy gap = 188 eV, with Boltzmann’s constant. From the normal state resistivity ( cm for the central strip and 0.28 cm for the groundplane) the skin depth for radiation at 1.54 THz is 60 nm in the central strip and 21 nm in the groundplane. The X-slot antenna would be ineffective for a layer thinner than the skin depth, therefore the groundplane layer is 100 nm thick. Since the microwave sheet resistance of the central line is 0.37 and that of the ground plane 0.13 , about 73% of the radiation is absorbed in the central line.
The current distribution along the length of the resonator peaks at the antenna and decreases as to zero at the open ends. Therefore the responsivity changes with . Since the diffusion length within a typical quasiparticle recombination lifetime of 2 ms is more than half the resonator length, optically created quasiparticles can move into the non-responsive regime. Therefore for calculating the number of quasiparticles in the sensitive volume, we take half the central strip volume, m3.
Noise measurement. The signal from the microwave generator is first attenuated, sent through the sample, and amplified with a HEMT amplifier at 4 K and with a room temperature amplifier. The output is mixed with the original signal using an IQ mixer, the output of which can be sampled at a maximum frequency of 2 MHz. The spectrum of fluctuations in the resonator amplitude is measured by recording the resonator amplitude as a function of time and computing the power spectral density. Peaks in the time domain stream that occur due to high energy impacts are filtered out before the spectrum is computed, as described in Ref. pdevisser2011, . We use the amplitude direction because fluctuations in the phase direction are dominated by two level system noise in the dielectrics surrounding the resonator jgao2007 (Supplementary Information).
Acknowledgements
We would like to thank Y.J.Y. Lankwarden for fabricating the devices and S.J.C. Yates for contributing to the experimental setup. This work has been supported as part of a collaborative project, SPACEKIDS, funded via grant 313320 provided by the European Commission under Theme SPA.2012.2.2-01 of Framework Programme 7.
References
- (1) Day, P. K., LeDuc, H. G., Mazin, B. A., Vayonakis, A. & Zmuidzinas, J. A broadband superconducting detector suitable for use in large arrays. Nature 425, 817 (2003).
- (2) Mattis, D. C. & Bardeen, J. Theory of the anomalous skin effect in normal and superconducting metals. Phys. Rev. 111, 412 (1958).
- (3) Kaplan, S. B. et al. Quasiparticle and phonon lifetimes in superconductors. Phys. Rev. B 14, 4854–4873 (1976).
- (4) Yates, S. J. C. et al. Photon noise limited radiation detection with lens-antenna coupled microwave kinetic inductance detectors. Appl. Phys. Lett. 99, 073505 (2011).
- (5) Zmuidzinas, J. Superconducting microresonators: Physics and applications. Ann. Rev. Condens. Matter Phys. 3, 169–214 (2012).
- (6) Gao, J., Zmuidzinas, J., Mazin, B. A., LeDuc, H. G. & Day, P. K. Noise properties of superconducting coplanar waveguide microwave resonators. Appl. Phys. Lett. 90, 102507 (2007).
- (7) Gao, J. et al. A semiempirical model for two-level system noise in superconducting microresonators. Appl. Phys. Lett. 92, 212504 (2008).
- (8) Barends, R. et al. Contribution of dielectrics to frequency and noise of NbTiN superconducting resonators. Appl. Phys. Lett. 92, 223502 (2008).
- (9) Barends, R. et al. Minimal resonator loss for circuit quantum electrodynamics. Appl. Phys. Lett. 97, 033507 (2010).
- (10) Wilson, C. M., Frunzio, L. & Prober, D. E. Time-resolved measurements of thermodynamic fluctuations of the particle number in a nondegenerate Fermi gas. Phys. Rev. Lett. 87, 067004 (2001).
- (11) de Visser, P. J. et al. Number fluctuations of sparse quasiparticles in a superconductor. Phys. Rev. Lett. 106, 167004 (2011).
- (12) Martinis, J. M., Ansmann, M. & Aumentado, J. Energy decay in superconducting Josephson-junction qubits from nonequilibrium quasiparticle excitations. Phys. Rev. Lett. 103, 097002 (2009).
- (13) Catelani, G. et al. Quasiparticle relaxation of superconducting qubits in the presence of flux. Phys. Rev. Lett. 106, 077002 (2011).
- (14) Lenander, M. et al. Measurement of energy decay in superconducting qubits from nonequilibrium quasiparticles. Phys. Rev. B 84, 024501 (2011).
- (15) Zgirski, M. et al. Evidence of long-lived quasiparticles trapped in superconducting point contacts. Phys. Rev. Lett. 106, 257003 (2011).
- (16) Barends, R. et al. Minimizing quasiparticle generation from stray infrared light in superconducting quantum circuits. Appl. Phys. Lett. 99, 113507 (2011).
- (17) Saira, O.-P., Kemppinen, A., Maisi, V. F. & Pekola, J. P. Vanishing quasiparticle density in a hybrid Al/Cu/Al single-electron transistor. Phys. Rev. B 85, 012504 (2012).
- (18) Ristè, D. et al. Millisecond charge-parity fluctuations and induced decoherence in a superconducting qubit. Nature Comm. in press (2013).
- (19) de Visser, P. J. et al. Microwave-induced excess quasiparticles in superconducting resonators measured through correlated conductivity fluctuations. Appl. Phys. Lett. 100, 162601 (2012).
- (20) Goldie, D. J. & Withington, S. Non-equilibrium superconductivity in quantum-sensing superconducting resonators. Supercond. Sci. Technol. 26, 015004 (2013).
- (21) Iacono, A., Freni, A., Neto, A. & Gerini, G. In-line X-slot element focal plane array of kinetic inductance detectors. In Proceedings of the European Conference on Antennas and Propagation (Rome, Italy, 2011).
- (22) Baselmans, J., Yates, S., Diener, P. & de Visser, P. Ultra low background cryogenic test facility for far-infrared radiation detectors. J. Low Temp. Phys. 167, 360–366 (2012).
- (23) Boyd, R. W. Photon bunching and the photon-noise-limited performance of infrared detectors. Infrared Phys. 22, 157–162 (1982).
- (24) Wilson, C. M. & Prober, D. E. Quasiparticle number fluctuations in superconductors. Phys. Rev. B 69, 094524 (2004).
- (25) Kozorezov, A. G. et al. Quasiparticle-phonon downconversion in nonequilibrium superconductors. Phys. Rev. B 61, 11807 (2000).
- (26) Gao, J. et al. Equivalence of the effects on the complex conductivity of superconductor due to temperature change and external pair breaking. J. Low Temp. Phys. 151, 557 (2008).
- (27) Karasik, B. S. & Cantor, R. Demonstration of high optical sensitivity in far-infrared hot-electron bolometer. Appl. Phys. Lett. 98, 193503 (2011).
- (28) Audley, M. D. et al. Measurements of the optical performance of bolometers for SPICA/SAFARI. Proc. of SPIE 8452, 84520B–1 – 84520B–12 (2012).
- (29) Stone, K. J. et al. Real time quasiparticle tunneling measurements on an illuminated quantum capacitance detector. Appl. Phys. Lett. 100, 263509 (2012).
- (30) Eom, B. H., Day, P. K., LeDuc, H. G. & Zmuidzinas, J. A wideband, low-noise superconducting amplifier with high dynamic range. Nature Phys. 8, 623–627 (2012).
Supplementary information for: ”Fluctuations in the electron system of a superconductor exposed to a photon flux”
P.J. de Visser, J.J.A. Baselmans, J. Bueno, N. Llombart and T.M. Klapwijk
P.J. de Visser
J.J.A. Baselmans
J. Bueno
N. Llombart
T.M. Klapwijk
In this supplementary document, we provide details on the experimental setup, derive relations that are used in the main article and provide additional experimental data.
I Optical system and radiation power
The photon source used in the experiment is a blackbody, which is formed by a 40 mm diameter copper cone, coated with carbon loaded epoxy (EPOTEK 920 1LB part A, with 3% by weight carbon black and 3% by weight EPOTEK 920 1LB part B), which is covered with 1 mm SiC grains. The temperature of the blackbody is varied in this experiment from 3.2 - 25 K. There are three metal-mesh filter stacks (QMC Instruments, Cardiff), the characteristics of which are given in the main article. The measured transmission of the whole filterstack as a function of optical frequency, , is shown in Fig. S1a (the same as in the bottom panel of Fig. 2a in the main text, but here on a linear scale).
Since there is no aperture limitation in between the blackbody and the detector, the optical throughput is assumed to be , with the speed of light. The total radiation power that arrives in front of the lens of the detector can now be calculated by numerically integrating Planck’s law over the throughput and the measured filter characteristic at each blackbody temperature . The radiation power is here given for one polarisation.
| (7) |
where is Planck’s constant and Boltzmann’s constant. The optical window around 1.54 THz, together with the blackbody temperature range of 3-25 K gives a large tuning range in radiation power, as shown in Fig. S1b. With the present device, we can verify the radiation power down to 100 aW using the measured quasiparticle recombination time (main article Fig. 5b). The trend of increasing optical responsivity and recombination time with decreasing microwave power, without any sign of saturation (main article Fig. 5a,b), suggests that the optical system is well characterised down to even lower radiation powers. The excess quasiparticles in the present device limit us to verify that.
The radiation power, calculated by Eq. 7, allows to calculate the different contributions to the noise equivalent power, as discussed in the main article. The photon-noise NEP is, given by
| (8) |
where the first term is due to the Poisson statistics of the photon stream, the second term due to photon bunching (giving a correction to Poisson statistics) and the third term is the recombination noise of the quasiparticles. is the efficiency from emission to detection of one mode and is the mode occupation rboyd1982b . The second term is much smaller than the Poisson term over the whole range of measured powers, as shown in Fig. S1c. The third term, the recombination noise, is also shown in Fig. S1c, which shows that the contribution due to recombination noise is small compared to photon noise, as discussed in the main article. The lines in Fig. S1c are calculated with %.
Right in front of the detector, after the last optical filter, we place a polariser to select the polarization for which the antenna is designed. The polariser consists of a copper wire grid on top of a 1.5 m thick Mylar film. The grid lines are 10 m wide and the spacing between the lines is 20 m.
The radiation power is focused by an elliptical silicon lens of 2 mm in diameter onto the antenna, which is in the second focus of the lens dfilipovic1993b . The major and minor axis of the ellips are 1.037 mm and 0.992 mm respectively. The lens has an anti-reflection coating of 130 m of Parylene C, which is not optimised for 1.54 THz. The antenna is an in-line X-slot antenna, designed to receive radiation in a broad band around 1.54 THz as described in Ref. aiacono2011b, . To obtain the optical efficiency, a simulation in CST Microwave Studio is performed of the whole structure: the lens with the coating, the antenna and a piece of coplanar waveguide transmission line. The aperture is chosen to be 30 degrees, the angle from which the detector can see the blackbody (single side angle). The optical efficiency is shown as a function of frequency in Fig. S2. The total efficiency is the multiplication of the front-to-back ratio, the spill over losses, the efficiency of an impedance mismatch between the antenna and the CPW line and the reflection losses at the anti-reflection coated lens surface. All together, we expect an efficiency of 48% for one polarisation in the filter transmission band, which is in good agreement with the measured optical efficiency of 488%.
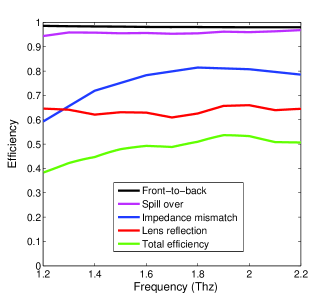
We like to note here that the antenna was not designed to have a perfect optical efficiency, but to have a large bandwidth. The agreement of the measured optical efficiency with the CST-simulation shows that the optical system is understood. Improving the optical efficiency is possible by adjusting the optical components.
II Experimental Details
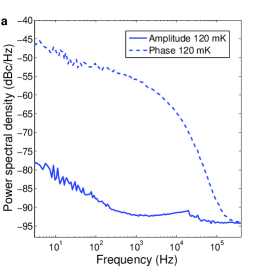
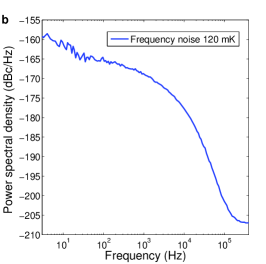
In Fig. 2c of the main article we have shown that one can choose to measure the response of the superconductor in either the phase or the amplitude direction with respect to the resonance circle. Fig. S3a shows both the amplitude and phase spectra at a bath temperature of 120 mK and a microwave power of -90 dBm. Is is evident that the phase noise is 30 dB higher, due to two level system (TLS) noise jgao2007b , which makes it impossible for this device to measure quasiparticle fluctuations in phase. Therefore we have only used the amplitude response to study quasiparticle fluctuations. To compare with previous research, we plot in Fig. S3b the frequency noise spectrum at 120 mK. The frequency noise at 1 kHz is -169 dBc/Hz, which is about 8 dB higher than reported before rbarends2009bb for Al on sapphire, most likely due to the two layer fabrication process for this device. It is known that frequency noise decreases for higher temperatures rbarends2008b . Therefore we have chosen to not operate at the lowest possible temperature, but at a bath temperature of 120 mK. A temperature of 120 mK is still low enough not to dominate the number of quasiparticles.
III Contributions to the amplitude noise spectrum
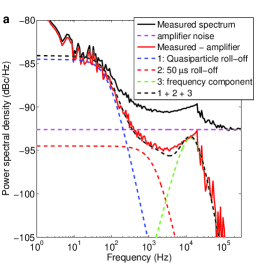
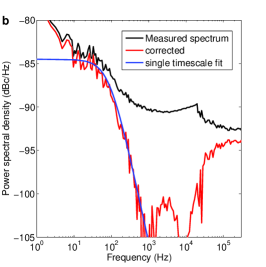
From Fig. 3a in the main article, it is evident that there are more contributions to the noise spectra than only the quasiparticle roll-off. In that figure, we already took into account the amplifier noise level, which will give a flat, white, noise spectrum. Fig. S4a shows as an example the measured amplitude power spectral density at the lowest radiation power and a microwave readout power of -92 dBm. Four contributions to the noise spectrum can be distinguished. Firstly, the amplifier noise, which gives a flat spectrum, the level of which can be determined through the noise level at frequencies of 200-300 kHz (-92.6 dBc/Hz in this case). The amplifier noise level is subtracted, to more clearly show the other three contributions. The second, and dominant, contribution is the roll-off due to quasiparticle fluctuations, with a level of -84.5 dBc/Hz and a characteristic time of 1.8 ms. This power spectral density has the form
| (9) |
with the level and the timescale. The third contribution is a second roll-off of the same form, with a timescale of about 50 s and a level which is 10 dB lower than the quasiparticle roll-off. This contribution is small and not so easily distinguishable here, but was observed more clearly in a similar resonator pdevisser2012b . We tentatively attribute this contribution to phonon-fluctuations. The fourth contribution is a bump around the resonator response time frequency (27 kHz). It can be shown jzmuidzinasbump that this phenomenon is consistent with mixing of frequency noise into the amplitude direction, due to a difference in the probe frequency and the resonant frequency of the resonator during the noise measurement. It can be modelled with the equation
| (10) |
with a scaling factor and where the star denotes the complex conjugate.
| (11) |
with the modulation frequency, the resonator ring frequency around which the bump will appear (27 kHz) and the detuning of the generator frequency from the resonant frequency . This detuning can occur in practice due to strong frequency noise or due to drift in either the generator frequency or the resonant frequency during the noise measurement.
Since we are only interested in modulation frequencies well within the quasiparticle recombination time bandwidth (100 Hz in this case), the other noise contributions do not play a role in determining the sensitivity (NEP) of the detector. However, these contributions limit the extraction of the quasiparticle recombination time and, because they contribute mostly at higher frequencies, give a bias towards shorter lifetimes if one fits the spectra with a single-lifetime spectrum. To get a better estimate of the actual quasiparticle recombination time, we subtract from the measured noise spectrum a level which we take from noise frequencies around 1-3 kHz. The thus corrected spectrum is fitted with a single timescale Lorentzian roll-off as shown in Fig. S4b. We perform this correction because fitting all noise contributions together would require too many fit parameters. We emphasise that we only do this correction to extract a more realistic recombination time. The NEP is calculated with the measured, uncorrected, noise spectra.
IV Derivation of the optical responsivity vs microwave power
Here we derive how the optical responsivity of the resonator amplitude, , changes as a function of microwave readout power. We limit ourselves to the regime where the number of quasiparticles is dominated by readout power dissipation. The number of quasiparticles due to the readout power, , is related to the quasiparticle recombination time and the absorbed readout power in the quasiparticle system , through . is the efficiency with which the absorbed microwave power creates quasiparticles. We will assume here that , with the power on the readout line (we will come back to this assumption later). Since we only derive proportionalities, we will use in the equations. and are related by skaplan1976
| (12) |
which also holds for excess quasiparticles at low temperature jgao2008c ; dgoldie2013 . is one constant to replace all the other constants in this equation. In steady state is related to as
| (13) |
We assume here that the number of quasiparticles created by the radiation is small (linear response regime) in which case determines , ie . That also means is expected to scale with the readout power as . The number of quasiparticles that is created by the optical signal is given by
| (14) |
with the optical efficiency and the pair breaking efficiency. The total number of quasiparticles is thus given by
| (15) |
We can now derive :
| (16) |
The resonator amplitude responsivity is now given by and is given by
| (17) |
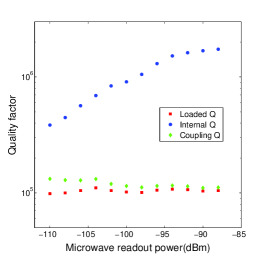
where is the kinetic inductance fraction the volume and , with the film thickness and the magnetic penetration depth. The quality factor was measured to be constant as function of readout power, as shown in Fig. S5 and also is constant. is a slow function of effective temperature and will change only little over the measured range jgao2008cb . Therefore we expect .
In this derivation we assumed that the absorbed microwave power in the quasiparticle system . In general this depends on the details of the microwave circuit, and and are related by jzmuidzinas2012b
| (18) |
where and are the internal and coupling quality factors, which are both easily measurable. is the quasiparticle quality factor, which is not known for this device, since is not limited by quasiparticle dissipation. One would expect to increase for lower dgoldie2013b , which would make the readout power dependence of the lifetime and the responsivity stronger. However, in general cannot be directly derived from dgoldie2013b , it depends on the shape of the driven quasiparticle distribution. We have therefore assumed for simplicity that is constant as a function of .
V Readout power dependence for high radiation powers
In the main article (Fig. 5) we have discussed the influence of the readout power on the optical response for the lowest radiation power, thus in the regime where the readout power dissipation dominates the number of quasiparticles. However, also in the regime where the optical signal dominates the number of quasiparticles the optical response is readout power dependent, as is shown in Fig. S6a for the highest measured radiation power (724 fW). Since the level of the noise spectrum depends on the responsivity (Eq. 2 of the main article), it does not surprise that the level of the photon noise roll-off also varies with the readout power, as shown in Fig. S6b. Additionally in Fig. S6b the amplifier noise level (the flat part at high frequencies) changes with readout power as expected.
To see up to how far the detector sensitivity changes, we plot (ie the NEP without the lifetime roll-off factor) in Fig. S6c, which corrects for the responsivity of the detector and only consist of the photon noise and amplifier noise. We observe that the NEP within the photon-noise roll-off is indeed similar now for all readout powers. In Fig. S6d we plot the NEP at the reference frequency of 20 Hz, together with an estimate of the amplifier contribution (taken at 300 kHz). If we subtract the amplifier contribution we see that the leftover photon noise contribution is approximately readout power independent. We conclude that as long as the quasiparticle fluctuations are dominated by photon noise, the readout power dependence of the responsivity does not influence the detector sensitivity (NEP). In practice that means that one can use the highest possible readout power when the detector is photon noise limited to suppress the amplifier noise. Why the responsivity is readout power dependent is a complex problem that requires simulation of the influence of both radiation power and readout power absorption, a start of which has recently been made for the readout power dissipation only dgoldie2013b .
Regarding the readout power, we make a few last remarks:
-
•
The maximum readout power before bifurcation is -88 dBm at the lowest radiation powers and increases to -78 dBm at the highest power of 724 fW.
-
•
In Fig. 4 and 1c of the main article we took the readout power at which the NEP is the lowest. These readout powers are (from low to high radiation power): -94 dBm, -96 dBm, -98 dBm, -92 dBm, -94 dBm, -96 dBm, -96 dBm, -88 dBm, -88 dBm, -86 dBm, -86 dBm, -78 dBm.
-
•
The increase in noise level upon crossing from generation-recombination noise to photon noise in Fig. 3a of the main article is only clear for a constant readout power as is shown in that figure. When different readout powers are used for different radiation powers, the changing responsivity changes the picture. We therefore did not quantitatively analyse this problem, because it requires a complex model as discussed before. The quasiparticle recombination time from the roll-off frequency is not influenced by the responsivity and therefore a more direct measure of the behaviour of the quasiparticle system.
References
- (1) Boyd, R. W. Photon bunching and the photon-noise-limited performance of infrared detectors. Infrared Phys. 22, 157–162 (1982).
- (2) Filipovic, D., Gearhart, S. & Rebeiz, G. Double-slot antennas on extended hemispherical and elliptical silicon dielectric lenses. IEEE Trans. on Microwave Theory and Tech. 41, 1738–1749 (1993).
- (3) Iacono, A., Freni, A., Neto, A. & Gerini, G. In-line X-slot element focal plane array of kinetic inductance detectors. In Proceedings of the European Conference on Antennas and Propagation (Rome, Italy, 2011).
- (4) Gao, J., Zmuidzinas, J., Mazin, B. A., LeDuc, H. G. & Day, P. K. Noise properties of superconducting coplanar waveguide microwave resonators. Appl. Phys. Lett. 90, 102507 (2007).
- (5) Barends, R. et al. Noise in NbTiN, Al and Ta superconducting resonators on silicon and sapphire substrates. IEEE Trans. on Appl. Supercond. 19, 936 (2009).
- (6) Barends, R. et al. Contribution of dielectrics to frequency and noise of NbTiN superconducting resonators. Appl. Phys. Lett. 92, 223502 (2008).
- (7) de Visser, P. J. et al. Microwave-induced excess quasiparticles in superconducting resonators measured through correlated conductivity fluctuations. Appl. Phys. Lett. 100, 162601 (2012).
- (8) Zmuidzinas, J., Gao, J., Day, P. K. & LeDuc, H. G. (unpublished).
- (9) Kaplan, S. B. et al. Quasiparticle and phonon lifetimes in superconductors. Phys. Rev. B 14, 4854–4873 (1976).
- (10) Gao, J. et al. Equivalence of the effects on the complex conductivity of superconductor due to temperature change and external pair breaking. J. Low Temp. Phys. 151, 557 (2008).
- (11) Goldie, D. J. & Withington, S. Non-equilibrium superconductivity in quantum-sensing superconducting resonators. Supercond. Sci. Technol. 26, 015004 (2013).
- (12) Zmuidzinas, J. Superconducting microresonators: Physics and applications. Ann. Rev. Condens. Matter Phys. 3, 169–214 (2012).