Proper Motions of H filaments in the Supernova Remnant RCW 86
Abstract
We present a proper motion study of the eastern shock-region of the supernova remnant RCW 86 (MSH 14-63, G315.4-2.3), based on optical observations carried out with VLT/FORS2 in 2007 and 2010. For both the northeastern and southeastern regions, we measure an average proper motion of H filaments of ″ yr-1, corresponding to km s-1 at 2.5 kpc. There is substantial variation in the derived proper motions, indicating shock velocities ranging from just below 700 km s-1 to above 2200 km s-1.
The optical proper motion is lower than the previously measured X-ray proper motion of northeastern region. The new measurements are consistent with the previously measured proton temperature of keV, assuming no cosmic-ray acceleration. However, within the uncertainties, moderately efficient ( 27 per cent) shock acceleration is still possible. The combination of optical proper motion and proton temperature rule out the possibility that RCW 86 has a distance less than 1.5 kpc.
The similarity of the proper motions in the northeast and southeast is peculiar, given the different densities and X-ray emission properties of the regions. The northeastern region has lower densities and the X-ray emission is synchrotron dominated, suggesting that the shock velocities should be higher than in the southeastern, thermal X-ray dominated, region. A possible solution is that the H emitting filaments are biased toward denser regions, with lower shock velocities. Alternatively, in the northeast the shock velocity may have decreased rapidly during the past 200 yr, and the X-ray synchrotron emission is an afterglow from a period when the shock velocity was higher.
keywords:
interstellar matter – optical: supernova remnants.1 Introduction
For decades, supernova remnants have been considered the main accelerators of Galactic cosmic rays. One of the earliest arguments for this was their energy budget: in order to maintain the Galactic cosmic-ray density, supernovae need to put a substantial amount of their kinetic energy into accelerating cosmic rays. As there are not many sources capable of providing these amounts of energy, there are few other candidates (for a list, see Butt, 2009). The idea that SNRs are the main sources of cosmic rays has been thoroughly investigated, both from the theoretical and observational perspective (Schure et al., 2012; Helder et al., 2012, for recent reviews).
One method of testing whether supernova remnants are efficiently accelerating cosmic rays, is by investigating the energy budget from the hot plasma in the remnants. This method compares the energy in thermal particles right behind the shock front to the total kinetic energy available (deduced from the shock speed). If the available kinetic energy is not fully used for heating particles, one can attribute the energy deficit to energy in non-thermal particles (e.g., Vink et al., 2010). This method has been used to determine the cosmic-ray pressure behind the shock fronts of four remnants: 1E 0102-7219, the Cygnus Loop, SNR 0509-67.5 and RCW 86, (Hughes et al., 2000; Salvesen et al., 2009; Helder et al., 2010, 2009, respectively). For the first two remnants, the temperatures are based on the electron temperature measured from X-ray spectra. This method has the additional difficulty that the electron temperature does not necessarily provide an adequate measure of the mean post-shock plasma temperature (Ghavamian et al., 2007).
The temperatures in the studies by Helder et al. (2010) and Helder et al. (2009) are based on the post-shock proton temperature. For Solar abundances, the proton temperature is more than half the mean plasma temperature. The proton temperatures in these studies were measured from the H line emission. For non-radiative shocks in partially neutral gas, this H line emission consists of both a narrow and a broad component superimposed. The narrow component is caused by direct excitation of the neutral hydrogen after being swept up by the shock. The broad component is emitted after charge exchange between the swept-up neutral hydrogen atoms and the hot post-shock protons. The width of this component is therefore a measure of the post-shock proton temperature (see Heng, 2010, for a review).
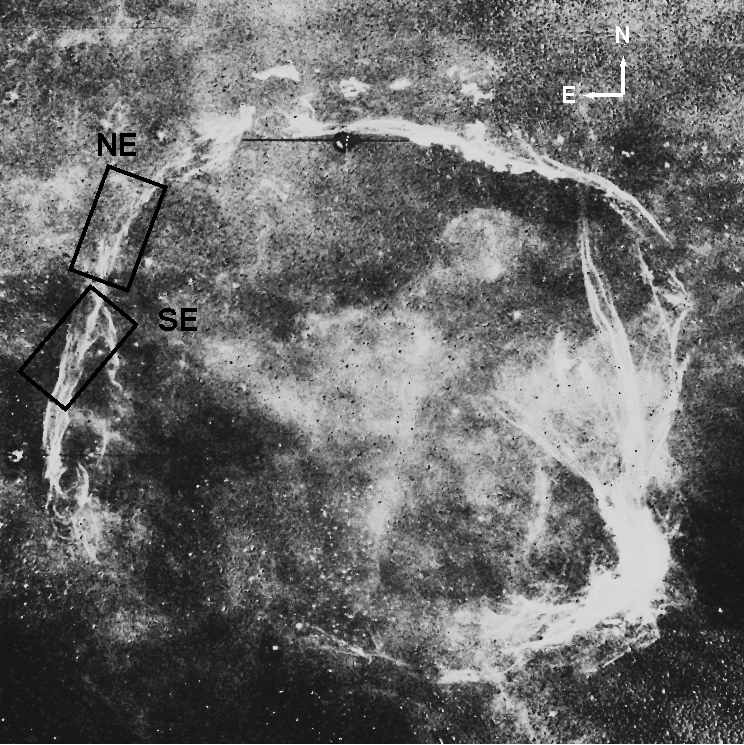
A disadvantage of the shock velocity measurements for northeastern part of RCW 86 by Helder et al. (2009) are that they are based on X-ray proper motion measurements. Because of the limited statistics of the X-ray images the proper motions were measured for large regions. In contrast, the temperature measurements based on H spectroscopy are measured at very specific locations that are relatively bright in H. It is, therefore, preferable to combine H-based temperature measurements with proper motions of specific H filaments. For that reason, we obtained new H images of the northeastern and southeastern parts of RCW 86 (MSH 14-63, G315.4-2.3, see Fig. 1) in order to measure the proper motions for those specific regions for which we had also measured the proton temperatures. We present those results here.
2 Data and results
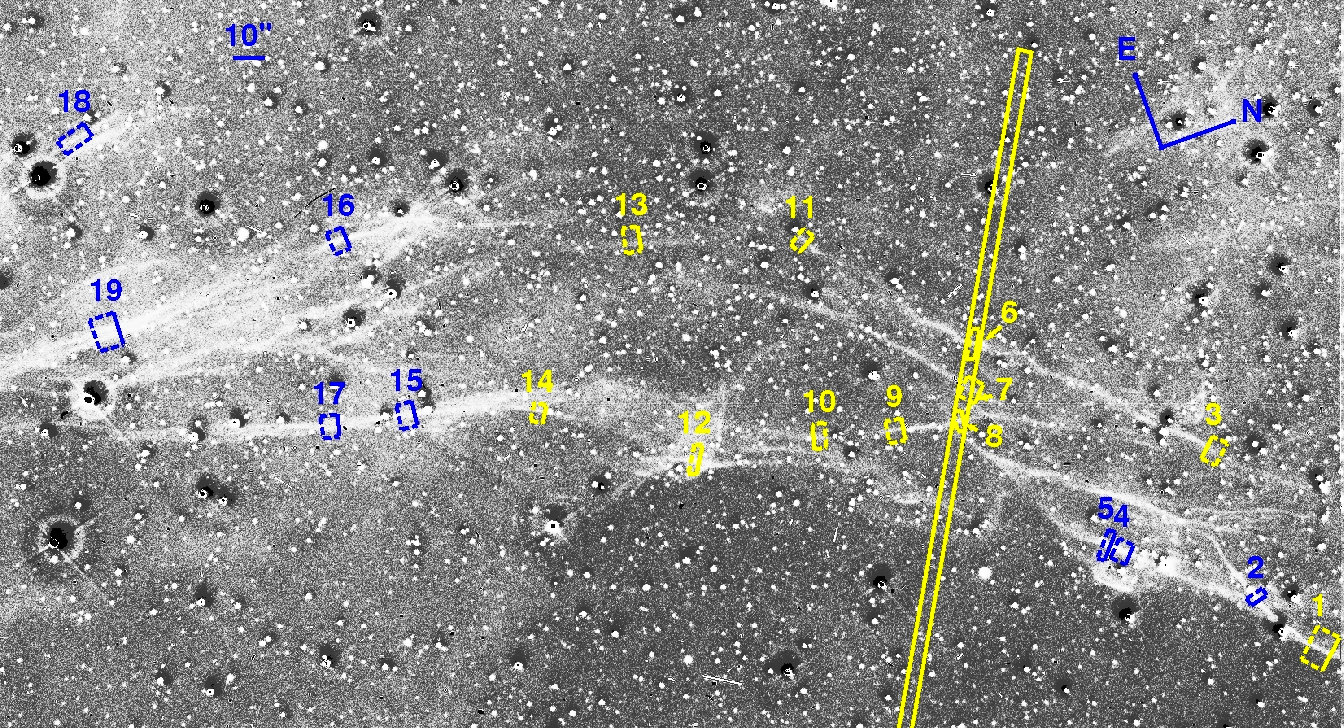
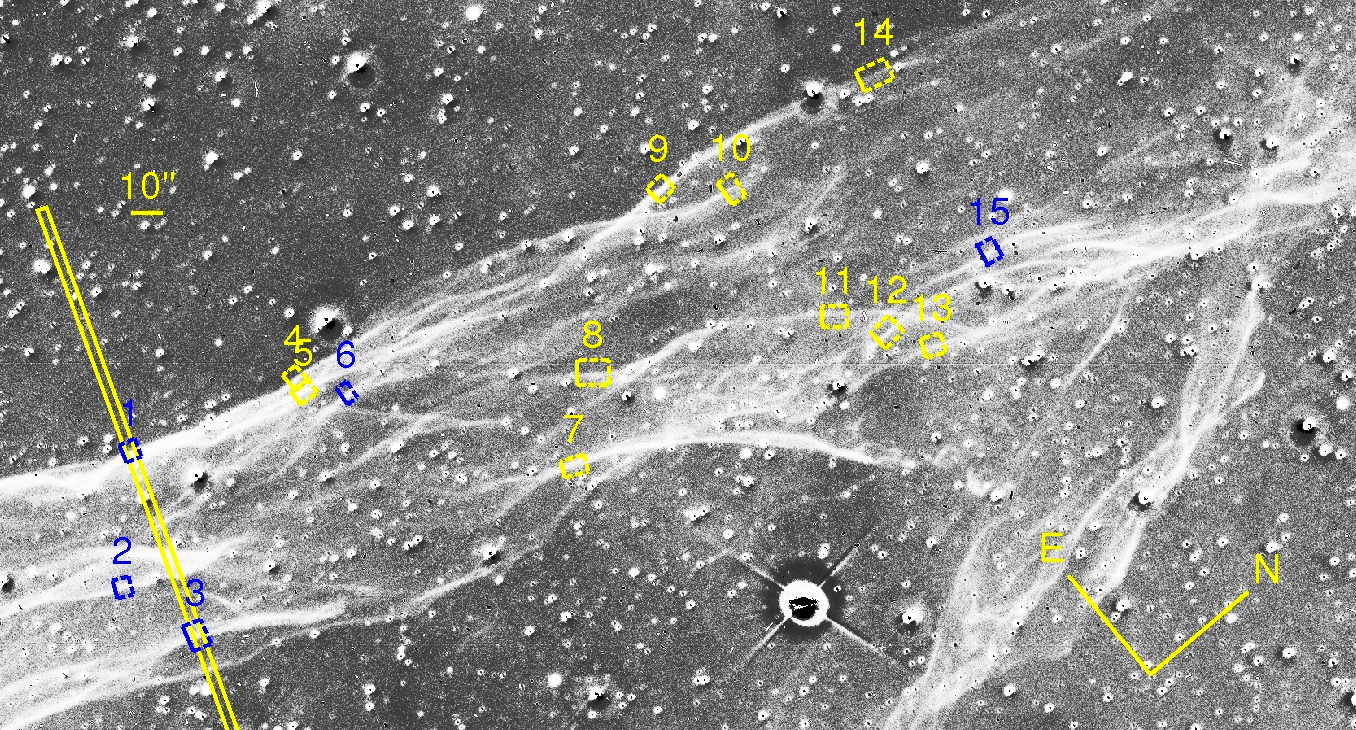
The two epochs of data for this study were obtained with VLT/FORS2 (Appenzeller et al., 1998). The first observation was done on 2007, February 25th and the second observation on 2010, April 5th. This gives a time baseline of 1135 days. For this study, we focus on the observations centred on the northeast (RA: 14:45:11, Dec: -62:17:43, J2000) and southeast (RA: 14:45:30, Dec: -62:25:21, J2000) of the remnant. Both observations include three images through an H filter (H_Alpha+83) for 10 minutes in total per epoch as well as three images through an H filter with a velocity offset of 4500 km s-1 (H_Alpha/4500+61), also for a total of 10 minutes per pointing per epoch. The three frames were spatially dithered to account for potential small-scale imperfections in the detector. The biases were subtracted and to correct for the uneven illumination across the detector we used sky flats. Then the frames were combined for each epoch and filter. The individual images were aligned using the interpol routine of the image subtraction package ISIS (Alard & Lupton, 1998). In this routine a two dimensional linear function is fitted to the positions of more than 350 stars per frame (exact number differs per frame) and the frames are remapped to match the corresponding stars in the reference frame. To subtract stars and other non-H background emission, we subtracted images through the H_Alpha/4500+61 continuum filter from the images through the H filter. The continuum images were scaled such that the resulting subtracted image would have the lowest standard deviation, bringing the subtracted sky emission down to zero. The resulting images are shown in Figure 2. We determined the scale of the images to be 0.252′′/pixel by matching the images with the USNO-B1.0 catalog (Monet et al., 2003) from which we picked isolated stars. We utilised the same stars to estimate the spatial accuracy of our image matching. We determined the pixel coordinates of the centroids of these stars in both images. These coordinates all matched within 0.25 pixels for the northeast, and 0.12 pixels for the southeast. We conservatively consider these offsets to be the systematical error on our proper motion measurements.
| Filament # | shift [″] | Vs | @ | 2.5 kpc |
| in 1135 days | km s-1 | stat. err. | ||
| 1 | 0.20 0.04 | 745 | 136 | |
| 2 | 0.14 0.07 | 543 | 280 | |
| 3 | 0.31 0.09 | 1172 | 347 | |
| 4 | 0.25 0.05 | 948 | 174 | |
| 5 | 0.28 0.05 | 1067 | 186 | |
| 6 | 0.49 0.07 | 1871 | 250 | |
| 7 | 0.31 0.10 | 1196 | 367 | |
| 8 | 0.35 0.06 | 1325 | 221 | |
| 9 | 0.34 0.05 | 1299 | 191 | |
| 10 | 0.08 0.11 | 317 | 437 | |
| 11 | 0.31 0.09 | 1192 | 351 | |
| 12 | 0.26 0.04 | 991 | 133 | |
| 13 | 0.39 0.12 | 1493 | 475 | |
| 14 | 0.21 0.10 | 800 | 371 | |
| 15 | 0.26 0.07 | 1001 | 256 | |
| 16 | 0.37 0.05 | 1422 | 175 | |
| 17 | 0.29 0.06 | 1096 | 219 | |
| 18 | 0.81 0.23 | 3071 | 878 | |
| 19 | 0.35 0.04 | 1349 | 151 | |
| Mean/std. dev. | 0.31/0.08 | 1204 | / | 575 |
| Filament # | shift [″] | Vs | @ | 2.5 kpc |
| in 1135 days | km s-1 | stat. err. | ||
| 1 | 0.40 0.04 | 1531 | 144 | |
| 2 | 0.13 0.04 | 478 | 137 | |
| 3 | 0.28 0.06 | 1082 | 225 | |
| 4 | 0.38 0.05 | 1446 | 179 | |
| 5 | 0.22 0.03 | 852 | 121 | |
| 6 | 0.35 0.05 | 1330 | 175 | |
| 7 | 0.43 0.06 | 1653 | 228 | |
| 8 | 0.38 0.04 | 1431 | 137 | |
| 9 | 0.38 0.04 | 1444 | 158 | |
| 10 | 0.37 0.07 | 1403 | 256 | |
| 11 | 0.24 0.13 | 910 | 501 | |
| 12 | 0.18 0.12 | 671 | 448 | |
| 13 | 0.33 0.06 | 1246 | 230 | |
| 14 | 0.49 0.07 | 1881 | 248 | |
| 15 | 0.32 0.08 | 1213 | 289 | |
| Mean/std. dev | 0.33/0.10 | 1240 | / | 374 |
We made a mask for each image, to flag pixels that contain either cosmic-ray streaks or stars. We used a median filter for detecting cosmic rays and faint stars, and we set a maximum luminosity to detect bright stars.
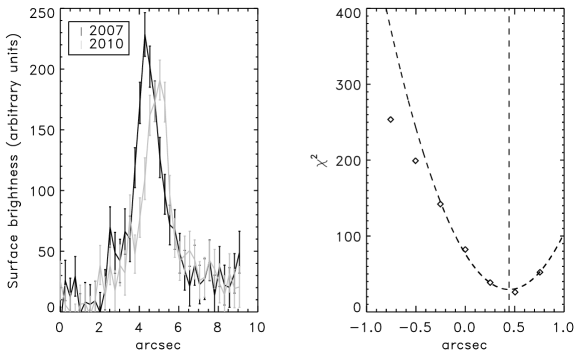
Since RCW 86 is located in the Galactic plane, the field is crowded with background stars. To measure the proper motions as accurately as possible, we avoided filaments with stars in their close vicinity. Keeping this in mind, we selected regions across several filaments. We also made sure to cover the filaments that were used for the spectra described in Helder et al. (2009) and Helder et al. (2011, regions 1 and 3 for the southeast and regions 6, 7 and 8 for the northeast, Figure 2). We extracted surface brightness profiles from these filaments. To correct for intrinsic brightness variations of the background of the images, we determined and subtracted the background in both the 2007 and 2010 profiles independently.
To calculate the proper motions, we shifted the profiles over one another in steps of 1 pixel, calculating the for each shift, assuming a constant error for all bins (Figure 3). We determine the best-fit shift by fitting a parabola to the 7 values surrounding the minimal . The surface brightness uncertainties were estimated, iteratively, from the dispersion of the residuals around the best fit model. This results per definition in . Utilising these surface-brightness uncertainty estimates, we estimate the 1- uncertainties on the best-fit proper motion, which correspond to . Tables 2 and 1 list the proper motions and 1- uncertainties resulting from this procedure.
3 Discussion
The H proper motion measurements for the eastern region of RCW 86 reported in our study provide some interesting results. First, the proper motions in the northeast do not agree with the X-ray proper motion of the X-ray synchrotron region. The X-ray proper motion reported by Helder et al. (2009) is ″ yr-1, whereas for the northeast the error-weighted average of all measured optical proper motions is ″ yr-1. This is a 2- deviation from the X-ray proper motion.
Second, we do not find a substantial difference in optical proper motion between the northeastern, X-ray synchrotron-emitting, part of the remnant shell and the southeastern shell, whose X-ray emission only shows evidence for thermal X-ray emission (e.g. Vink et al., 2006). For the southeast the error weighted average proper motion is ″ yr-1.
3.1 Implications for shock acceleration efficiency
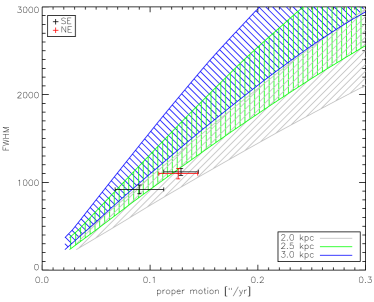
Both findings have implications for the particle acceleration properties of RCW 86. For a nominal distance of RCW 86 of 2.5 kpc, a proper motion of 0.10″ yr-1 corresponds to a shock velocity of 1180 km s-1. A shock with this velocity is expected to heat the protons to at least keV, with in case of full electron-ion equilibration and if protons and electrons are completely unequilibrated (i.e. the temperature is proportional to the particle mass, and all species have equal velocity distribution instead of equal energy distributions). This is consistent with the proton temperature of keV based on the width of the broad H line reported by Helder et al. (2009), as illustrated in Fig. 4. Note that for the southeastern part Helder et al. (2011) published two temperature measurements. For the northeastern part only one temperature was published.
Since there is no longer a discrepancy between the temperature expected from the proper motion and the measured proton temperature, there is also no need to infer that a significant fraction of the shock’s energy flux has been lost to cosmic-ray acceleration.
However there is sufficient uncertainty in the distance and proper motion to allow still for the possibility of (moderately) efficient shock acceleration: at the slit position for which the proton temperature was measured (filaments 6, 7, 8) the proper motion is ″ yr-1 (error weighted average, including systematic errors). If the distance to RCW 86 is at the high-end of the estimates, 3 kpc, this corresponds to km s-1. This translates into an upper limit on the ratio between measured and expected post-shock temperature of , corresponding to a limit on the post-shock cosmic-ray pressure of per cent, according to the two-fluid model of Vink et al. (2010). The 2- error on the reported proper motion allows in principle even for an upper limit on the shock velocity of km s-1, corresponding to keV, and an efficiency of per cent.
On the other hand the combination of measured proton temperature (Helder et al., 2009) and the proper motions reported here reinforces the distance estimates of kpc (Rosado et al., 1996; Sollerman et al., 2003), and make a distance between 1.0-1.5 kpc (Long & Blair, 1990; Bocchino et al., 2000) less likely, since for the measured proton temperature of keV, a shock velocity is required of at least 108070 km s-1. This is at odds with our proper motion measurements, which for 1.0-1.5 kpc imply shock velocities of only 400-700 km s-1.
3.2 Implications for the X-ray synchrotron emission
Although the efficient cosmic-ray acceleration in the northeast of RCW 86 is no longer necessary to explain the observations, the H proper motions pose some new challenges for understanding the properties of this supernova remnant.
First, the X-ray emission properties of the northeastern and southeastern filaments are quite distinct. The northeast is dominated by X-ray synchrotron emission with only weak X-ray line emission from part of the region. The weak line emission indicates a low ionisation age, implying a combination of low density and/or recently heated plasma. In contrast, the southeast filaments do not show any signs of X-ray synchrotron radiation, but have much brighter thermal X-ray emission than the northeast, indicating higher plasma densities and also larger ionisation ages (Vink et al., 2006). The H emission in the northeast is also fainter than in the southeast, consistent with the idea that in the northeast the shock moves through a lower density medium than in the southeast. Given the apparent contrast in densities, one expects also distinct shock velocities, as the shock is expected to slow down in denser regions. This is inconsistent with the low and similar H proper motions measured for the northeast and southeast.
The presence of X-ray synchrotron emission in the northeast is consistent with relatively high shock velocities. This was the reason for investigating the shock acceleration properties of the northeast shock by Helder et al. (2009). Diffusive shock acceleration models show that for synchrotron radiation with maximum photon energy limited by radiative losses, the cut-off photon energy is independent of magnetic field and scales as (Zirakashvili & Aharonian, 2007; Vink, 2012)
| (1) |
with ( 1) an efficiency factor with respect to optimal Bohm-diffusion (e.g. Reynolds, 1998). Indeed most supernova remnant shocks for which X-ray synchrotron radiation has been detected appear to have shock velocities in excess of 3000 km s-1 (Helder et al., 2012). Clearly the H proper motions reported here do not agree with this general trend, as for a distance of 2.5 kpc the proper motions should correspond to to keV. This low value is consistent with the lack of X-ray synchrotron radiation in the southeast, but is at odds with the prominence of X-ray synchrotron radiation from the northeast. Note that also the H.E.S.S. TeV -ray map of RCW 86 indicates a lack of TeV emission from the southeast (Aharonian et al., 2009).
Here, we offer two possible explanations for the presence of the X-ray synchrotron radiation from the northeastern region and its absence from the southeastern region.
First, it is possible that the overall shock velocity in the northeast is not well represented by the H proper motions, as suggested by Williams et al. (2011). Note that it is not uncommon for supernova shock speed measurements at different wave lengths to give contradictory answers in different wavelengths (Moffett et al., 1993). RCW 86 is characterised by large density contrasts, so perhaps we only detect H emission where locally the shock encounters denser gas, and (temporarily) slows down, thereby increasing in H brightness. In this context it is interesting to note that all along the southeastern shock H emission is present, whereas the northeastern shock region does not show evidence for H everywhere along the shock region. The strong variation in densities could in principle mean that the overall shock velocity in the northeast is closer to 3000 km s-1, consistent with the X-ray proper motions reported by Helder et al. (2009), but that the H emitting regions are much slower. Indeed, the measured proper motions show variation that cannot be explained by statistical measurement errors. For example, filament 18 has a proper motion that is 2- higher than the average proper motion, and indicates that locally the shock velocity may be higher than 2000 km s-1. In contrast, filament 1 corresponds to a 2.5- deviation on the low side km s-1. The problem of explaining the X-ray/optical proper motion discrepancy in the northeast with large variations in shock velocities is that shocks in the southeast also show significant variation in proper motion. In order to test this explanation it is important to obtain another X-ray proper motion measurement, now with a longer baseline and therefore reduced measurement error.
The second, alternative, explanation is that the H proper motions reported here are representative of the overall shock velocity in both the northeastern and southeastern regions, but that in the northeast the shock velocity was much higher in the recent past. Vink et al. (2006) reported for this region a magnetic field of G, consistent with the interpretation of GeV and TeV -ray observations of RCW 86 (Aharonian et al., 2009; Lemoine-Goumard et al., 2012). For these magnetic fields, a relativistic electron with an energy of 100 TeV has a synchrotron loss time of 180 yr. Therefore, it is possible that 200 yr ago, the shock velocity was higher than 3000 km s-1 and nowadays, the region is still glowing in X-ray synchrotron radiation. This does not necessarily imply that there was a problem with the X-ray proper motion, as the X-ray proper motion measures the velocity of the downstream plasma of the whole X-ray shell in the northeast, rather than the shock velocity. Although a long X-ray synchrotron loss time in combination with a low shock velocity offers an explanation for the X-ray synchrotron emission from the northeast, it does not offer an explanation for the absence of X-ray synchrotron radiation from the southeast. Given the higher density in the southeast the deceleration of the shock in the southeast should have been more severe, whereas the H proper motions for the two regions are comparable.
To complicate matters, one could also invoke magnetic field orientation as an additional ingredient for the presence or absence of X-ray synchrotron radiation. For example the geometry of the X-ray synchrotron emission from SN 1006 suggests that in this supernova remnant X-ray synchrotron emission only occurs when the magnetic field is parallel to the shock normal (Rothenflug et al., 2004). In RCW 86 the X-ray synchrotron emitting regions are roughly southwest-northeast aligned, more or less parallel to the Galactic plane. However, the morphology is not as clear as for SN 1006, and it does not agree with the idea that in the southwest the X-ray synchrotron emission is associated with the reverse shock, rather than with the forward shock (Rho et al., 2002).
A possible explanation for the different X-ray properties of the southeastern and northeastern regions could be offered by the hydrodynamic simulations of supernova remnants evolving in a wind blown cavity (Dwarkadas, 2005). RCW 86 is regarded to be such a supernova remnant (Vink et al., 1997; Vink et al., 2006; Williams et al., 2011). The simulations indicate that the shock velocity rapidly decreases once it starts interacting with the shell surrounding the cavity, but it recovers some of the shock velocity once it has penetrated the shell. The reason is that the initial interaction of the shock wave with the shell results in a slowing down of the shock, but as more of the material behind the shock transfers energy and momentum to the shell, it speeds up again. In the simulation presented by Dwarkadas (2005, case 2) the shell is encountered around 4000 yr, and as a result the shock velocity drops from km s-1, to a few hundred km s-1, but within a few hundred years the shock regains speed and continues with km s-1. These numbers are for the specific case simulated, but it is conceivable that in different regions of RCW 86 the supernova remnant shock is in different stages of interacting with the shell. In the northeast the shock could be approaching or just hitting the shell, and could therefore be rapidly decelerating. In the southeast this could have happened in the more distant past, and the shock may actually have picked-up speed again. In such a situation one can still expect X-ray synchrotron radiation in the northeast, but in southeast the shock slowed down too long ago to still have electrons present with energies in excess of 10 TeV.
This interpretation is not entirely satisfying, as one would expect somewhere on the eastern side to find a region that is in the stage of the interaction with the shell with the slowest shock velocities. Inspecting the variation in velocity over the filaments there is not an obvious south-north trend. Instead, we find that in the northeast the inner filaments (northeast 1, 2, 4, 10, 12, 14) to have the lowest velocities.
4 Conclusions
We measured proper motions of the H emitting shock fronts on the east side of the RCW 86 supernova remnant. Based on our study, we reach the following conclusions:
-
-
The shock velocities in the east part of the remnant display a large spread, varying from 700 km s-1 to above 2200 km s-1 assuming a distance of 2.5 kpc.
- -
-
-
Assuming a distance of 2.5 kpc, we do not need any cosmic-ray pressure to explain the proton temperature in the northeast of RCW 86.
-
-
Taking into account measurement and distance uncertainties, a moderately efficient shock acceleration is still possible, with 27 per cent of the post-shock pressure being provided by accelerated particles.
-
-
The combination of the proper motion and the post-shock proton temperature rules out a distance of less than 1.5 kpc for this remnant.
-
-
The proper motions of the filaments in the southeast and northeast are similar, which is surprising, given the very different nature of the dominant X-ray emission mechanism of these regions, namely synchrotron in the northeast and thermal X-ray emission in the southeast. We discuss two possible explanations for this. The first is that the H emitting parts of the shocks have slowed down, whereas the X-ray synchrotron emitting shocks are still moving fast through the ambient medium, as suggested by Williams et al. (2011). The second explanation is that the X-ray expansion measurement was inaccurate, and the entire northeast shock has slowed down recently by interaction with a dense shell, and is still glowing in X-ray synchrotron radiation. The southeast shock has also slowed down by the same shell but has already overcome this shell and the shock velocity has increased again. The two scenarios can be distinguished by obtaining a more accurate X-ray proper motion measurement with a new Chandra observation, providing a much longer baseline.
Acknowledgments
E.A.H. expresses her gratitude to Ana Chies Santos and Angela Adamo for discussions on the reduction of optical data. E.A.H. and D.N.B. are supported by SAO grants GO1-12070X and GO2-13064X. This research is based on observations collected with ESO telescopes at the Paranal Observatory under progamme IDs 079.D-0735(A) and 385.D-0483(A).
References
- Aharonian et al. (2009) Aharonian F., et al., 2009, ApJ, 692, 1500
- Alard & Lupton (1998) Alard C., Lupton R. H., 1998, ApJ, 503, 325
- Appenzeller et al. (1998) Appenzeller I., et al., 1998, The Messenger, 94, 1
- Bocchino et al. (2000) Bocchino F., Vink J., Favata F., Maggio A., Sciortino S., 2000, A&A, 360, 671
- Butt (2009) Butt Y., 2009, Nature, 460, 701
- Dwarkadas (2005) Dwarkadas V. V., 2005, ApJ, 630, 892
- Ghavamian et al. (2007) Ghavamian P., Laming J. M., Rakowski C. E., 2007, ApJ, 654, L69
- Ghavamian et al. (2001) Ghavamian P., Raymond J., Smith R. C., Hartigan P., 2001, ApJ, 547, 995
- Helder et al. (2010) Helder E. A., Kosenko D., Vink J., 2010, ApJ, 719, L140
- Helder et al. (2011) Helder E. A., Vink J., Bassa C. G., 2011, ApJ, 737, 85
- Helder et al. (2009) Helder E. A., Vink J., Bassa C. G., Bamba A., Bleeker J. A. M., Funk S., Ghavamian P., van der Heyden K. J., Verbunt F., Yamazaki R., 2009, Science, 325, 719
- Helder et al. (2012) Helder E. A., Vink J., Bykov A. M., Ohira Y., Raymond J. C., Terrier R., 2012, Space Sci. Rev., 173, 369
- Heng (2010) Heng K., 2010, PASA, 27, 23
- Hughes et al. (2000) Hughes J. P., Rakowski C. E., Decourchelle A., 2000, ApJ, 543, L61
- Lemoine-Goumard et al. (2012) Lemoine-Goumard M., Renaud M., Vink J., Allen G. E., Bamba A., Giordano F., Uchiyama Y., 2012, A&A, 545, A28
- Long & Blair (1990) Long K. S., Blair W. P., 1990, ApJ, 358, L13
- Moffett et al. (1993) Moffett D. A., Goss W. M., Reynolds S. P., 1993, AJ, 106, 1566
- Monet et al. (2003) Monet D. G., et al., 2003, AJ, 125, 984
- Reynolds (1998) Reynolds S. P., 1998, ApJ, 493, 375
- Rho et al. (2002) Rho J., Dyer K. K., Borkowski K. J., Reynolds S. P., 2002, ApJ, 581, 1116
- Rosado et al. (1996) Rosado M., Ambrocio-Cruz P., Le Coarer E., Marcelin M., 1996, A&A, 315, 243
- Rothenflug et al. (2004) Rothenflug R., Ballet J., Dubner G., Giacani E., Decourchelle A., Ferrando P., 2004, A&A, 425, 121
- Salvesen et al. (2009) Salvesen G., Raymond J. C., Edgar R. J., 2009, ApJ, 702, 327
- Schure et al. (2012) Schure K. M., Bell A. R., O’C Drury L., Bykov A. M., 2012, Space Sci. Rev., 173, 491
- Smith (1997) Smith R. C., 1997, AJ, 114, 2664
- Sollerman et al. (2003) Sollerman J., Ghavamian P., Lundqvist P., Smith R. C., 2003, A&A, 407, 249
- van Adelsberg et al. (2008) van Adelsberg M., Heng K., McCray R., Raymond J. C., 2008, ApJ, 689, 1089
- Vink (2012) Vink J., 2012, A&A Rev., 20, 49
- Vink et al. (2006) Vink J., Bleeker J., van der Heyden K., Bykov A., Bamba A., Yamazaki R., 2006, ApJ, 648, L33
- Vink et al. (1997) Vink J., Kaastra J. S., Bleeker J. A. M., 1997, A&A, 328, 628
- Vink et al. (2010) Vink J., Yamazaki R., Helder E. A., Schure K. M., 2010, ApJ, 722, 1727
- Williams et al. (2011) Williams B. J., Blair W. P., Blondin J. M., Borkowski K. J., Ghavamian P., Long K. S., Raymond J. C., Reynolds S. P., Rho J., Winkler P. F., 2011, ApJ, 741, 96
- Zirakashvili & Aharonian (2007) Zirakashvili V. N., Aharonian F., 2007, A&A, 465, 695