\titlealternative

The Role of Emotions in Contributors Activity: A Case Study of the Gentoo Community \authoralternativeDavid Garcia, Marcelo Serrano Zanetti and Frank Schweitzer

References

David Garcia    Marcelo Serrano Zanetti and Frank Schweitzer Chair of Systems Design – www.sg.ethz.ch – ETH Zurich

The Role of Emotions in Contributors Activity:
A Case Study of the Gentoo Community

David Garcia    Marcelo Serrano Zanetti and Frank Schweitzer Chair of Systems Design – www.sg.ethz.ch – ETH Zurich
Abstract
  • [3] We analyze the relation between the emotions and the activity of contributors in the Open Source Software project Gentoo. Our case study builds on extensive data sets from the project’s bug tracking platform bugzilla, to quantify the activity of contributors, and its mail archives, to quantify the emotions of contributors by means of sentiment analysis. The Gentoo project is known for a period of centralization within its bug triaging community. This was followed by considerable changes in community organization and performance after the sudden retirement of the central contributor. We analyze how this event correlates with the negative emotions, both in bilateral email discussions with the central contributor, and at the level of the whole community of contributors. We then extend our study to consider the activity patterns on Gentoo contributors in general. We find that contributors are more likely to become inactive when they express strong positive or negative emotions in the bug tracker, or when they deviate from the expected value of emotions in the mailing list. We use these insights to develop a Bayesian classifier that detects the risk of contributors leaving the project. Our analysis opens new perspectives for measuring online contributor motivation by means of sentiment analysis and for real-time predictions of contributor turnover in Open Source Software projects.
  • [4]
  • [2]
  • [5]
  • [6]
  • 1 Introduction

  • [7] Collaboration within an online environment is an everyday challenge for contributors of Open Source Software (OSS) projects. They need to interact with other contributors to decide about the direction of their project and, equally important, need to interact with users to learn about their demands. Communication within the contributor’s community and towards the user’s community both impact project reputation and the availability of resources, which are crucial to further develop the project. Thus, understanding how people interact, collaborate and communicate online is an important field of research that has the potential to improve the performance of OSS projects.
  • [8] The relevance of OSS projects goes beyond research, and reaches wide industrial applications. The current technological landscape is constantly influenced by large OSS projects that generate important software products. For example, the Apache server is used in more than 60%fragments60percent60\% of the websites111http://w3techs.com/technologies/details/ws-apache/all/all, and Firefox and Chrome have a combined market share of more than 50%fragments50percent50\%222http://www.w3counter.com/globalstats.php?year=2013&month=04. These are possible thanks to the efforts of OSS projects, in which potentially large amounts of contributors can participate by coding, proposing functionalities, or reporting and triaging bugs. All contributors benefit equally from the project, receiving the software product and its code as a result. These contributors are free to stop collaborating at any time; a decision that does not prevent them from profiting from the project and using its products. In this sense, an OSS community is an example of a public goods game [Andreoni1990], in which participants have no punishment for free-riding, and they equally benefit from the common good. This poses a paradox, as the game theoretical result of the “tragedy of the commons” [Hardin1968] implies that, when collaborators are purely rational, the expected outcome of the project is a complete failure.
  • [9] In proprietary software projects, developers, analysts, and testers are bound by legal contracts that provide a mechanism to cope with conflicts and guarantee a certain level of collaboration. On the other hand, OSS projects are mostly composed of volunteer contributors, whose collaboration scheme can be fragile and suffer in the presence of disagreements or loss of motivation. For example, the Pidgin project developed a program for instant messaging commonly used in LINUX distributions333http://www.pidgin.im/. After the release of a new version, users, developers and other contributors disagreed on a change related to its user interface, leading to a heated discussion and the expression of negative emotions444https://developer.pidgin.im/ticket/4986. As a result, the project was divided (i.e. forked) into two different projects, which is equivalent to a large exodus of contributors. This example illustrates the impact that the emotional climate of an OSS community has on its success. Certain level of positive emotions seems necessary to sustain the intrinsic motivation of the collaborators, and strong instances of negative emotions pose a threat that trigger the turnover of important contributors.
  • [10] The human factor of OSS projects composes the mechanism that make them possible, but also poses a threat that endangers their success. Often, the social component of the projects is analyzed through social network analysis [crowston2006, Ehrlich2007, He2012, Zanetti2013a], but the psychological component of OSS interaction has not been explored so far. Thanks to the development of tools for sentiment analysis [thelwall2012sentiment], we can quantify the emotions of OSS contributors, looking for relations between their activity and emotional expression. Furthermore, given the availability of large datasets of OSS development forums, this sentiment analysis can be extended to higher levels of aggregation in which collective emotions emerge from the interaction of individual contributors. This poses the opportunity to empirically analyze the conditions that lead to the turnover of OSS contributors, and to apply such findings in the creation of tools to monitor and predict the evolution of OSS projects [Crowston2012, serrano2012co, valetto2007using].
  • [11] In this article, we explore preconditions for contributor turnover, and their impact on the performance and cohesion of the community. We focus on the large Gentoo project, by analyzing two disjoint datasets spanning about 101010 years of activity and more than 35,000 contributors. The first dataset contains the records of bug triaging and processing (i.e. bug tracker) while the second contains messages exchanged within the developers’ mailing list. To these data, we apply sentiment analysis, looking for indicators to predict the turnover of contributors from an OSS community. Our quantitative results show that the emotional expression of a contributor is an indicator for the likelihood of a contributor to remain active in the project. Finally, we apply these results to formulate a real-time prediction of contributors leaving the project, providing a tool that enables timely reactions against undesirable turnover events.
  • [12]
  • [13]
  • 2 Related Work

  • [14]
  • [15]
  • 2.1 Social Dynamics of Open Source Software

  • [16] The social organization in open source communities has been addressed in a number of relevant works. In [Mockus2002tse], the focus was in division of labor. By analyzing a dataset composed of the Apache and Mozilla projects, the authors show that while coding efforts are concentrated on a few core-developers, maintenance activities, such as bug report triaging, are performed by a much larger community. In [crowston2006], this core periphery structure was also studied within a social network analysis framework. The social network framework was also recently applied by [He2012] for the study of the behavior of individuals within communities. Contributor motivation and its relationship to project performance is also an important topic, and was considered in a number of works reviewed in [lerner2002, gacek2004, krogh2006]. Finally, [cataldo2008] proposes a framework to analyze the congruence between technical and social organization within a software project. In this way, the authors wish to answer the question of which social organization structure is the best performing given a particular technological scenario. Or the analogous, how to structure a technical architecture in order to fit an established social organization.
  • [17]
  • [18]
  • 2.2 Emotions in Social Media

  • [19] The most common mechanisms for communication in OSS projects are forums and bug trackers, which are special cases of social media. This allows the application of sentiment analysis tools [thelwall2012sentiment], providing insights to the psychological experience [Kappas2013] of OSS contributors, rather than just their social interaction. This approach has been proved useful for the analysis of collective emotions in forum discussions [Chmiel2011], emotional interaction in chatting communities [Garas2012], and to test previous hypotheses from psychology in online data [Garcia2011, Garcia2012b]. The attention to sentiment analysis is increasing due to its multiple applications in finance and marketing. For example, mood measures from social media have been used to predict the stock market [Bollen2010, Deng2011]. Sentiment analysis has also been applied to customer emotions in Amazon product reviews [Garcia2011e], and to the viral spread of information in Twitter [Pfitzner2012].
  • [20] Different sentiment analysis tools are available, depending on the type of analysis and data to process. Supervised methods use training data to mine emotions and opinions from text [Paltoglou2010], and word category frequencies can be used to measure collective mood [Zhang2012, Bollen2010]. Regarding short and informal text, lexicon-based classification provides unsupervised methods to extract sentiment. The state-of-the-art tool in such situation is Sentistrength [thelwall2012sentiment, Thelwall2013], which we use in this article. The accuracy of its last version has been validated with human annotations of a wide variety of online communities [thelwall2012sentiment]. Among its previous applications, Sentistrength has been used to analyze emotions about political topics in Youtube and Twitter [Garcia2012a, Wu2011], product reviews [Garcia2011e], and Yahoo! answers [Kucuktunc2012].
  • [21]
  • [22]
  • 2.3 Social Resilience and Contributor Motivation

  • [23] The question of how groups are formed and disappear has been addressed for online social networks and scientific communities [Backstrom2006, Zheleva2009]. This highlights the relevance of trust networks in social recommender systems [Walter2009], and how social movements in Twitter grow and decay through spreading patterns and complex contagion [Gonzalez-Bailon2011]. The departure of individual users, commonly denoted as churn, has also been analyzed for the online communities like Yahoo! answers [Dror2012], and other social networks [Wu2013]. Furthermore, previous analysis provide insights on the decision of users to leave P2P networks [Herrera2007], discussion boards [Karnstedt2010], and online videogames [Kawale2009]. These previous works focused on the relation between social indicators, like amount of contacts, with the likelihood of users to leave an online community. While useful as a first approximation, these analyzes did not take into account emotional expression and interaction, which are related in the psychology literature to motivation and social interaction [hall1961psychology, lerner2002, krogh2006].
  • [24] The microscopic dynamics that drives the decisions of users to leave a community create the macroscopic effect of social resilience [Garcia2013a], or how strong is the community when facing disrupting periods. Such disrupting events have been characterized by text analysis on Facebook [Cvijikj2011], but their influence on the survival of an online community at large cannot be simply mapped to its social network [Garcia2013a]. The intrinsic motivation of the users and their individual decisions are key factors for the collective dynamics of the community. As an example, external incentives do not guarantee more efficient viral marketing campaigns [Michalski2012]. On the other hand, information spread can be motivated by emotional content [Pfitzner2012], leading to higher levels of user activity and interaction when emotions are involved.
  • [25]
  • [26]
  • 3 Gentoo Datasets

  • [27]
  • [28]
  • 3.1 Bug reports

  • [29] The Gentoo project adopts the Bugzilla as its bug tracking system [serrano2005]. It is composed of an online database555https://bugs.gentoo.org/ where each entry is organized around the notion of a bug report. A bug report status will change as its processing progresses towards a solution (e.g. pending, reproduced, closed, etc). In general, the modification of a bug report field (e.g. status) allows its author to leave simple text comments. Using the Bugzilla API, we collect the time series of comments, along with the unique username of its author and the unique id of the respective bug report. In Table 1, we summarize the main statistics of this dataset. To each of those comments, we apply the Sentistrength tool in order to quantify its positive and negative valence.
  • [30]
  • Table 1: Basic statistics of the datasets used for this study. We cover activity within Gentoo’s bug tracker and within the gentoo-dev mailing list.
    Statistics Gentoo Bugzilla gentoo-dev
    01/04/2002 04/01/2001
    Observation period to 04/26/2012 to 29/06/2012
    Messages 661,783 81,328
  • [31] Discussions
  • 140,216 14,070
    Contributors 36,555 4,664
  • [32]
  • [33]
  • 3.2 Developer mailing list

  • [34] While triaging and processing bug reports, contributors may rely on information exchange through mailing lists. In the case of Gentoo, this is mainly done via the gentoo-dev list666http://archives.gentoo.org/gentoo-dev/, which is the list subscribed by core-developers and code maintainers. Thus if contributors processing bug reports want to call the attention of a serious maintainer, that is the best place to start. Messages sent to this mailing list are stored in a database and can be retrieved at any time from their archive version, which is accessible via a HTML interface. Using this channel, we extract the time series of email messages sent to the gentoo-dev list, along with the unique userid of its author and message subject, which repeats for all messages sent to the same thread. Again, the textual content of each message is analyzed with Sentistrength yielding positive and negative valence scores (i.e. excluding content commented out with character “>>” at the start of each new line).
  • [35]
  • [36]
  • 3.3 Sentiment analysis

  • [37] We process all comments and messages in the bug reports and the developer’s mailing list using Sentistrength [thelwall2012sentiment]. Sentistrength is the state-of-the-art tool for lexicon-based analysis of social media messages, in particular for informal communication. It has been validated on test datasets including Digg and other fora on specialized topics, which are similar communication media as the Gentoo bug tracker and mailing list. When classifying the polarity of forum messages, Sentistrength has an accuracy above 88%fragments88percent88\% for Digg, and above 90%fragments90percent90\% in other fora [thelwall2012sentiment]. It has high correlation values with human raters on these communities, providing sentiment scores that would be indistinguishable from a human rater, and providing not only an accurate, but also a valid estimation of the sentiment. For these reasons, previous works have applied it to Yahoo! answers [Kucuktunc2012], Twitter messages [Pfitzner2012], and chatroom communication [Garas2012].
  • [38] Sentistrength uses a lexicon of emotional-bearing terms combined with the detection of negations, amplifiers and diminishers. Its output is composed of two values, a measure of positive sentiment p[+1,+5]fragmentsp[1,5]p\in[+1,+5], and a measure of negative sentiment n[1,5]fragmentsn[1,5]n\in[-1,-5]. Following the rationale of [thelwall2012sentiment], we can aggregate these two values to a measure of polarity. A message m𝑚m is classified as positive (s=+1fragmentss1s=+1) if p+n>0fragmentspn0p+n>0, negative (s=1fragmentss1s=-1) if p+n<0fragmentspn0p+n<0, or neutral (s=0fragmentss0s=0) if p=nfragmentspnp=n and both have an absolute value lower than 444. Comments with high and equal positive and negative sentiment do not map to this unidimensional simplification. Nevertheless, this approximation is valid in our data analysis, as only 265265265 messages were detected as in the cases of [+4,4]fragments[4,4][+4,-4] or [+5,5]fragments[5,5][+5,-5]. These messages compose 0.032%fragments0.032percent0.032\% of the total, and we discard them from our analysis.
  • [39]
  • Table 2: Message ratio per polarity within Gentoo’s bug tracker and within the gentoo-dev mailing list.
    Polarity Gentoo Bugzilla gentoo-dev
    positive 0.28 0.28
    neutral 0.56 0.49
    negative 0.16 0.23
  • [40]
  • [41]
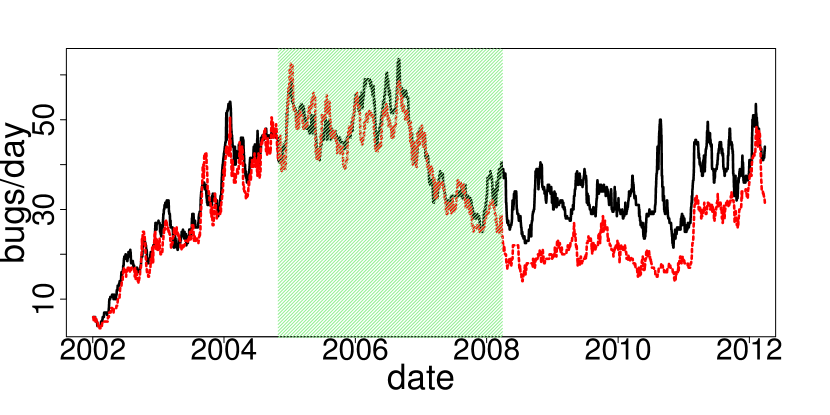
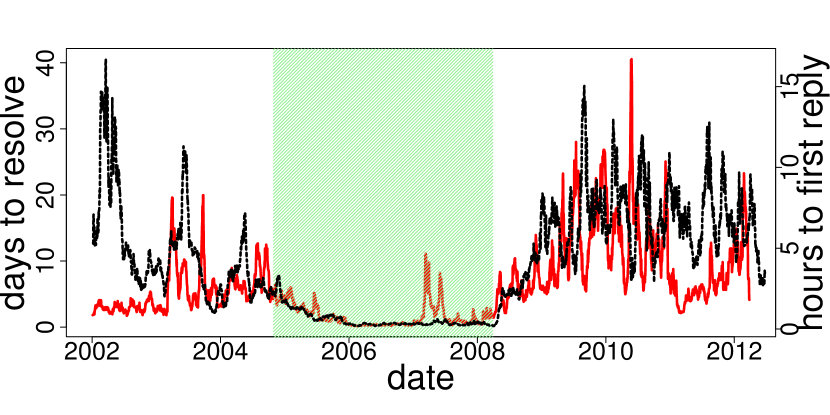
  • 4 The departure of a central contributor

  • [42] In this section we quantify and discuss the role of emotions in a case study focused on the Gentoo-Linux project. The Gentoo project is of particular interest due to a well documented centralization event followed by significant changes in community performance [Zanetti2013b]. In that work, we focus on the evolution of social organization within Gentoo’s bug triaging community. Using a quantitative methodology based on social network analysis [Zanetti2012, Zanetti2013a], we show that we can monitor drastic changes in social organization which are usually associated with increased risks. More specifically, the bug triaging community of Gentoo came to rely on a single person (i.e. named Alice) to help them in processing bug reports. This is in accordance with previous findings relating centrality to preference in collaboration [He2012]. Based on Alice’s activity, we divide the timespan of our dataset into three observation periods P1fragmentsP1P1, P2fragmentsP2P2, P3fragmentsP3P3. In period P1fragmentsP1P1, between January 2002 and October 27, 2004, Alice was not yet active and the community was growing. During the second period P2fragmentsP2P2 starting on October 28 2004, Alice gradually became the most central contributor. She unexpectedly left the community after her last contribution on March 29 2008, which marks the start of the third period P3fragmentsP3P3 in which Alice was not active anymore. In the next we discuss Alice’s impact on community performance and the possible effects of emotions on her motivation to leave the project.
  • [43]
  • [44]
  • 4.1 Effect in performance

  • [45] During P2fragmentsP2P2, Alice concentrated most of the work related to bug triaging on herself, and as a result, the time to first reply and finally solve open bug reports were minimized. These are important metrics that correlate to the likelihood of a bug reporter in becoming a long time contributor to the project [mockus2012]. The main issue about Alice’s impact was that – due to personal conflicts, and dissatisfaction with the social environment of the project as a whole – she left the community suddenly. As we show in [Zanetti2013b], after Alice’s retirement (i.e. period P3fragmentsP3P3) the community never managed to achieve the same levels of performance. Thus, besides monitoring changes in community social organization and its implied risks, we wish for quantitative measures that could give an early indication to individual loss of motivation or activity.
  • [46]
  • Refer to caption
  • [47] Refer to caption
  • Figure 1: Time series of performance metrics. On top, the median values of bugs reported (black curve) and solved (red curve) per day. On bottom, the median time to solve (red curve) and give the first reply (black curve) to a bug report. The green interval highlights P2fragmentsP2P2, the period when Alice was active.
  • [48]
  • [49]
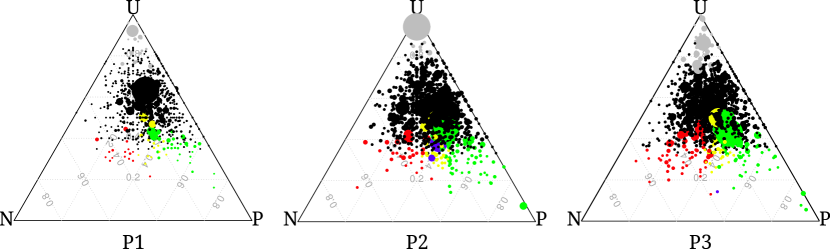
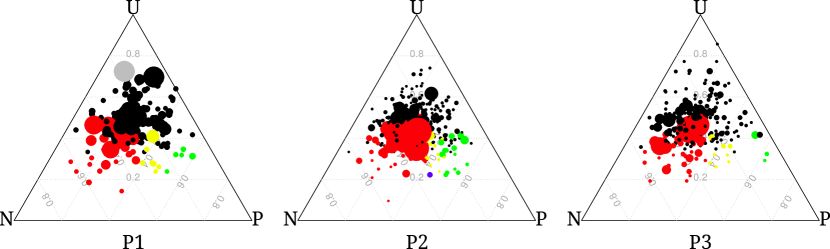
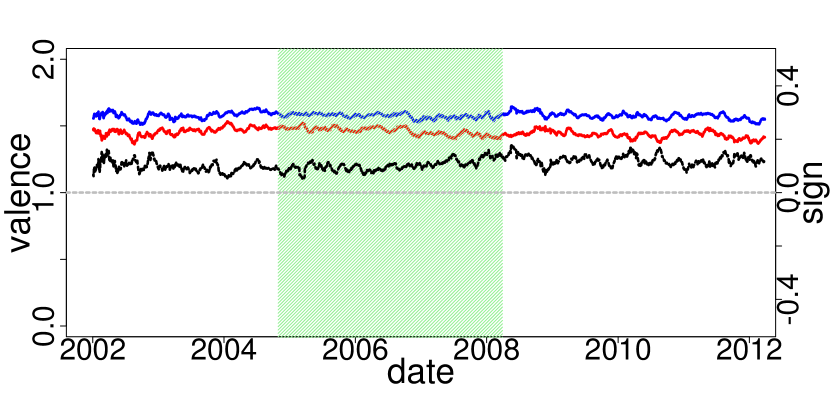
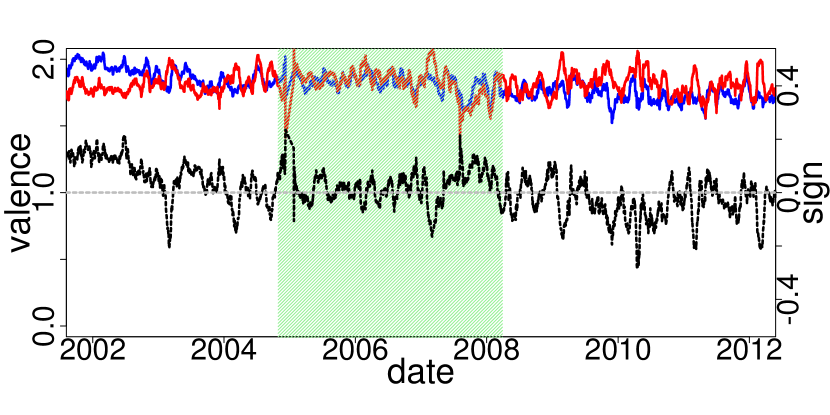
  • 4.2 Changes in collective emotions

  • [50] To measure the collective emotions in the discussions associated with comments to a bug report or e-mails to a thread in the mailing list, we aggregate the emotional values of the messages in the discussion. In this way, for the set of messages in a discussion MdfragmentsM𝑑M_{d}, we calculate the ratios of positive Pd=mMdsm=1|Md|fragmentsP𝑑fragmentsfragmentsmM𝑑s𝑚1fragments|M𝑑|P_{d}=\frac{\sum_{m\in M_{d}}s_{m}=1}{|M_{d}|} , negative Nd=mMssm=1|Md|fragmentsN𝑑fragmentsfragmentsmM𝑠s𝑚1fragments|M𝑑|N_{d}=\frac{\sum_{m\in M_{s}}s_{m}=-1}{|M_{d}|}, and neutral Ud=mMssm=0|Ms|fragmentsU𝑑fragmentsfragmentsmM𝑠s𝑚0fragments|M𝑠|U_{d}=\frac{\sum_{m\in M_{s}}s_{m}=0}{|M_{s}|} messages. These measurements map the discussions to a simplex on the plane [Garcia2012a], where each discussion has a distance to the vertices of a triangle proportional to PdfragmentsP𝑑P_{d}, NdfragmentsN𝑑N_{d}, and UdfragmentsU𝑑U_{d}. Figure 2 shows this representation separately for bug tracker and the mailing list, where each discussion d𝑑d is a point of size proportional to |Md|fragments|M𝑑||M_{d}|.
  • [51] The ratio of the overall emotional expression in each medium (i.e. bug tracker or mailing list), P¯,N¯,U¯fragments¯𝑃,¯𝑁,¯𝑈\bar{P},\bar{N},\bar{U}, allow us to compare the emotions of a discussion with this ground state of the Gentoo community. We perform a set of nonparametric statistical tests to classify each discussion, consisting on three χ2fragmentsχ2\chi^{2} tests at the 95%fragments95percent95\% confidence interval:
  • [52]
    1. 1.

      Test of UdU¯fragmentsU𝑑similar-to-or-equals¯𝑈U_{d}\simeq\bar{U}: if this hypothesis cannot be rejected, the discussion is not considered to include collective emotions, and it is classified as neutral. If the Ud>U¯fragmentsU𝑑¯𝑈U_{d}>\bar{U} hypothesis is supported, we classify the discussion as underemotional. Examples of this kind of discussions are exchanges of computer code or error logs, which serve a technical purpose but do not compose emotional interaction. If the hypothesis Ud<U¯fragmentsU𝑑¯𝑈U_{d}<\bar{U}, is supported, the discussion contained collective emotions, and the next two tests are evaluated to classify the emotions in this discussion.

    2. 2.

      Test of PdP¯fragmentsP𝑑similar-to-or-equals¯𝑃P_{d}\simeq\bar{P}: if the null hypothesis can be rejected and the data supports Pd>P¯fragmentsP𝑑¯𝑃P_{d}>\bar{P}, we classify the discussion as positive.

    3. 3.

      Test of NdN¯fragmentsN𝑑similar-to-or-equals¯𝑁N_{d}\simeq\bar{N}: in the same way as the previous point, if the data supports Nd>N¯fragmentsN𝑑¯𝑁N_{d}>\bar{N}, we classify the discussion as negative.

  • [53] The above set of tests allows us to detect discussions that simultaneously contain positive and negative emotions, which will pass the second and third test. We classify these discussions as bipolar, representing collective emotions in which the authors of messages are polarized in different emotional states [Schweitzer2010]. Additionally, a discussion might pass the first test, but not the second nor the third. These discussions contain more emotional content than the average of the community, but there is not enough data to classify the polarity of the emotions expressed in it. We classify these as undetermined.
  • [54]
  • Refer to caption
  • [55]
  • [56] Refer to caption
  • Figure 2: Triangular representation of the emotions in Gentoo discussions in bug tracker (top) and the developer mailing list (bottom). Points represent discussions with at least 202020 messages, with a size proportional to the amount of messages in the discussion, at a distance to the triangle vertices proportional to the ratios of positive, negative and neutral messages. Points are colored according to the classification of the discussion (i.e. black for neutral, green for positive, red for negative, gray for underemotional, blue for bipolar and yellow for undetermined).
  • [57] Our statistical analysis highlights the presence of strong positive discussions in the bug reports, represented by points close to the lower left corner of the triangle. In these discussions, positive collective emotions are usually created as the result of fixing a software issue. The bug report system also shows some instances of underemotional discussions, represented by gray points close to the upper corner of the triangle. These threads are large exchanges of error logs and program outputs, and do not constitute a significant source of emotional interaction.
  • [58] The lower row of Figure 2 shows the collective emotions in the discussions of the developer’s mailing list (i.e. gentoo-dev). The structure of the emotions in these discussions is significantly different when compared against their bug reports counterpart: there are very few instances of positive discussions, and there are large discussions that elicited negative collective emotions.
  • [59] These differences are possible due to the fact that these two communication channels (i.g. bug tracker and mailing list) shows very different styles of emotional interaction. In the bug tracker, positive emotions prevail. Users, developers and other contributors need to interact focusing on solving existing software issues. Thus, bug reports must be written as clear as possible. Moreover, contributors might need to write back to bug reporters in order to gather further information. This needs to be done in a smooth way that will lead to the identification of the locus of software issue as fast as possible. On the mailing list the situation can be quite different. Specially in the case of the developers’ private list, large instances of negative emotions can be observed. Likely, this is due to disagreements in collaboration processes and on competing agendas specifying how work and software should be organized.
  • [60] The representation of collective emotions in Figure 2 is useful to detect discussions that could trigger the decision of contributors to stop contributing to the OSS community. When comparing the three intervals depending on Alice’s presence, it is difficult to find differences in this representation. Periods P2fragmentsP2P2 and P3fragmentsP3P3 seem slightly more emotional, with some instances of bipolar discussions. For the case of the mailing list, negative emotions appear to be more salient in P2fragmentsP2P2 and P3fragmentsP3P3, but these observations require a quantitative validation. For that reason, we compute the time series of emotions in messages, using a moving average with T=30fragmentsT30T=30 days range. Thus, MTfragmentsM𝑇M_{T} represents all messages found within such a time window. This allows us to calculate the respective mean positivity p(t)=mMTpm/|MT|fragmentsp(t)fragmentsmM𝑇p𝑚|M𝑇|p(t)=\sum_{m\in M_{T}}p_{m}/|M_{T}|, mean negativity n(t)=mMTnm/|MT|fragmentsn(t)fragmentsmM𝑇n𝑚|M𝑇|n(t)=-\sum_{m\in M_{T}}n_{m}/|M_{T}|, and mean polarity s(t)=min|MT|sm/|MT|fragmentss(t)fragmentsmin|M𝑇|s𝑚|M𝑇|s(t)=\sum_{min|M_{T}|}s_{m}/|M_{T}| of messages.
  • [61]
  • Refer to caption
    Refer to caption
    Figure 3: Moving average applied to the time series of emotional expression within Gentoo Bugzilla (top) and gentoo-dev (bottom). The red curve shows the daily mean negativity in the messages, the blue curve shows the mean positivity, and the black curve represents the mean polarity of all the messages. The green interval highlights P2fragmentsP2P2, the period when Alice was active.
  • [62] Figure 3 shows these time series for the bug reports and for the developer’s mailing list, divided into the three periods mentioned above. It can be noticed that there is no clear effect of the presence or absence of Alice in the bug tracker, but the developer’s mailing list seems to change. Before Alice’s presence, the mean polarity used to have positive values, and during her activity this was close to 00. After her departure, there seems to be a period of stronger negativity. We statistically tested this observations, performing χ2fragmentsχ2\chi^{2} test on the values of s(t)fragmentss(t)s(t) across periods.
  • [63] The results of these tests are reported in Table 3, supporting our observation that – in the mailing list – P3fragmentsP3P3 had more negative emotions than the periods P1fragmentsP1P1 and P2fragmentsP2P2 together. During that period, the community went through a complete reorganization, catalyzed by the creation of the bug wranglers project777http://www.gentoo.org/proj/en/qa/bug-wranglers/. This was an initiative specially meant to cope with Alice’s sudden retirement. Thus, the negativity observed during P3fragmentsP3P3 is likely to be due to the community struggle in restructuring its procedures. What about Alice’s presence during P2fragmentsP2P2? Did Alice experience different sentiment expression within the bug tracker and mailing list? We separate the discussions in which Alice took part, from the remaining taking place within that period, and again calculated the different proportions of polarities. We show in Table 3 that the discussions in the mailing list that contained Alice’s messages were indeed more negative and less positive than the discussions not containing her messages, while the proportions of neutral polarity were roughly the same. Now focusing on the bug tracker, we observed that the proportion of negative polarity were roughly the same in Alice’s discussions when compared to the remaining discussions. Moreover, Alice’s discussions were more neutral and less positive.
  • [64]
  • Table 3: Test for statistical significance of differences in proportion of polarities. N𝑁N represents the proportion of negative messages, P𝑃P for positive ones and U𝑈U for neutral ones. The null hypothesis is always Prop1fragmentsProp1Prop_{1}=Prop2fragmentsProp2Prop_{2}. The subscripts P1-P2 and P3 corresponds to the analysis per period, while without Alice and with Alice to the analysis per thread.
    Gentoo Bugzilla
  • [65]
    p-value of null hypothesis alternative hypothesis estimate
    1.04e033fragments1.04e0331.04e-033 NP1-P2fragmentsNP1-P2N_{\textrm{P1-P2}} >> NP3fragmentsNP3N_{\textrm{P3}} 0.0110.0110.011
    2.12e003fragments2.12e0032.12e-003 UP1-P2fragmentsUP1-P2U_{\textrm{P1-P2}} >> UP3fragmentsUP3U_{\textrm{P3}} 0.0030.0030.003
    1.29e040fragments1.29e0401.29e-040 PP1-P2fragmentsPP1-P2P_{\textrm{P1-P2}} << PP3fragmentsPP3P_{\textrm{P3}} 0.0140.0140.014
    2.00e002fragments2.00e0022.00e-002 Nwithout AlicefragmentsNwithout AliceN_{\textrm{without Alice}} <>fragments<> Nwith AlicefragmentsNwith AliceN_{\textrm{with Alice}} 0.0030.0030.003
    2.06e130fragments2.06e1302.06e-130 Uwithout AlicefragmentsUwithout AliceU_{\textrm{without Alice}} << Uwith AlicefragmentsUwith AliceU_{\textrm{with Alice}} 0.0450.0450.045
    6.62e188fragments6.62e1886.62e-188 Pwithout AlicefragmentsPwithout AliceP_{\textrm{without Alice}} >> Pwith AlicefragmentsPwith AliceP_{\textrm{with Alice}} 0.0490.0490.049
  • [66]
    gentoo-dev
  • [67]
    p-value of null hypothesis alternative hypothesis estimate
    1.49e021fragments1.49e0211.49e-021 NP1-P2fragmentsNP1-P2N_{\textrm{P1-P2}} << NP3fragmentsNP3N_{\textrm{P3}} 0.0330.0330.033
    5.08e006fragments5.08e0065.08e-006 UP1-P2fragmentsUP1-P2U_{\textrm{P1-P2}} << UP3fragmentsUP3U_{\textrm{P3}} 0.0170.0170.017
    7.61e046fragments7.61e0467.61e-046 PP1-P2fragmentsPP1-P2P_{\textrm{P1-P2}} >> PP3fragmentsPP3P_{\textrm{P3}} 0.0500.0500.050
    1.61e026fragments1.61e0261.61e-026 Nwithout AlicefragmentsNwithout AliceN_{\textrm{without Alice}} << Nwith AlicefragmentsNwith AliceN_{\textrm{with Alice}} 0.0660.0660.066
    5.50e001fragments5.50e0015.50e-001 Uwithout AlicefragmentsUwithout AliceU_{\textrm{without Alice}} <>fragments<> Uwith AlicefragmentsUwith AliceU_{\textrm{with Alice}} 0.0040.0040.004
    8.56e023fragments8.56e0238.56e-023 Pwithout AlicefragmentsPwithout AliceP_{\textrm{without Alice}} >> Pwith AlicefragmentsPwith AliceP_{\textrm{with Alice}} 0.0010.0010.001
  • [68]
  • [69]
  • 5 Emotions and inactivity

  • [70] The above analysis of the departure of Alice serves as an example of the interplay between emotions and activity in the Gentoo community. In this section, we extend that analysis to contributors in general, exploring the role of emotions in their activity patterns. We continue by developing a method to predict long periods where an individual contributor is inactive.
  • [71]
  • [72]
  • 5.1 Activity modes

  • [73] For the case of Alice, determining when she became inactive is a trivial task, as she had no activity after a certain date. This is not necessarily the case for contributors in general, who might be inactive for a long period and then become active again. In general, contributors do not have a standard mechanism to inform the rest of the community if they are active or not, and the only way to detect their inactivity is when they do not produce messages for a period of time. To detect if a contributor became inactive, we use the theory of interevent time distributions [Barabasi2005, Wu2010], which divides human communication in two modes: A bursty, correlated mode in which the time between the actions of a human is very short; and an uncorrelated mode that corresponds to the long times between bursts of activity. The correlated mode can be detected when the interevent times of a human follow a power-law distribution [Barabasi2005, Garas2012], which emerges when humans reply to each other. The uncorrelated mode can be detected as an exponentially decaying regime, which can be explained as the result of a Poisson process of decoupled actions that start activity bursts [Wu2010].
  • [74] For both datasets, we measured the interevent times τ𝜏\tau between the messages of each contributor, and characterized the maximum inactivity period of each one through the maximum interevent time τmaxfragmentsτfragmentsmax\tau_{max}. Figure 4 shows the distribution of τmaxfragmentsτfragmentsmax\tau_{max} for the mailing list and the bug tracker, with power-law fits to the head of the distributions. It can be noticed that these power-law regimes are not valid after a certain value, where both distributions show a tail that decreases much faster than a power-law. This shows the division between the two modes of activity mentioned above: the head of the distributions correspond to the correlated mode of active contributors, while their tails represent the uncorrelated time intervals when contributors are inactive. We found that the point between both modes is approximately τ=30fragmentsτ30\tau=30 days. This indicates that when a contributor does not create any new message for a month, its behavior is uncoupled from the rest and it can be considered as inactive.
  • [75]
  • Refer to caption Refer to caption

    Figure 4: Distributions of the maximum interevent times per contributor in the bug tracker (left) and the mailing list (right). The distributions are plotted in a log-log scale with exponentially increasing bins, and power-law fits to the head of the distributions. Dashed vertical lines show the mark at τmax=30fragmentsτfragmentsmax30\tau_{max}=30 days, where there is a regime change.
  • [76]
  • [77]
  • 5.2 Contributor emotions

  • [78] To produce the dataset that classifies contributor activity, we do the following: We collect all messages written by each contributor u𝑢u, sorting messages by date. Then we iterate over the messages, starting from the earliest. If the contributor only posted a single message, we discard this one time contributor from our analysis. If the contributor posted more than one message, for each message mutfragmentsm𝑢𝑡m^{u}_{t} posted at time t𝑡t, we measure the time interval τ𝜏\tau between it and his next message mut+τfragmentsm𝑢fragmentstτm^{u}_{t+\tau}. If this time interval is shorter than 303030 days, we label the interval IutfragmentsI𝑢𝑡I^{u}_{t} as ACT, meaning the contributor is active. Otherwise, we label the interval as INA, meaning that the contributor started a period of inactivity according to the theory explained above. For this analysis, we discard the last message posted by each contributor.
  • [79] For each interval of contributor u𝑢u, we compute the mean positivity score PufragmentsP𝑢P_{u} and mean negativity score NufragmentsN𝑢N_{u} of the messages of the contributor in the 555 days preceding the interval. This way, each data point is an interval between messages of the same contributor, with real-time measurements of the emotions expressed by that contributor in the days before the interval takes place. Our aim is to provide a predictor that identifies when a contributor is going to become inactive, as a tool that can warn community managers about the risk of losing contributors. This is not a simple task, as the ratios of each type of interval are very unevenly distributed. The prior probability of an interval being labeled as INA is 0.0880.0880.088 in the bug tracker, and 0.0750.0750.075 in the mailing list.
  • [80]
  • Refer to caption Refer to caption

    Refer to caption Refer to caption

    Figure 5: Conditional distributions of contributor emotions P(Nu|I)fragmentsP(N𝑢|I)P(N_{u}|I) and P(Pu|I)fragmentsP(P𝑢|I)P(P_{u}|I)) in the bug tracker (top) and the mailing list (bottom) for I=ACTfragmentsIACTI=\text{ACT} (blue) and I=INAfragmentsIINAI=\text{INA} (red). Distributions were smoothed through a Gaussian kernel of width 0.350.350.35.
  • [81] We calculate the conditional distributions of emotions given the label of an interval, P(Nu|I)fragmentsP(N𝑢|I)P(N_{u}|I) and P(Pu|I)fragmentsP(P𝑢|I)P(P_{u}|I), which we show in Figure 5 for both datasets. An initial inspection shows the differences between the expression of emotions when a contributor is going to become inactive and when not. For both datasets, the distribution of emotional expression followed by an interval labeled as INA has larger variance than when followed by intervals labeled as ACT, showing signs of bimodality. Wilcoxon tests reveal that the conditional distributions of both emotions in the bug tracker are significantly different (p<1e15fragmentsp1e15p<1e-15). In the mailing list, this is the case only for NufragmentsN𝑢N_{u} (p<1e15fragmentsp1e15p<1e-15), while the null hypothesis could not be rejected (p=0.21fragmentsp0.21p=0.21) for PufragmentsP𝑢P_{u}. This highlights the role of negative expression among developers, which differs more when one is going to become inactive, in comparison with active periods. Nevertheless, for the case of the mailing list, the failure to reject the null hypothesis for PufragmentsP𝑢P_{u} does not imply that it is not informative, as we show below.
  • [82]
  • [83]
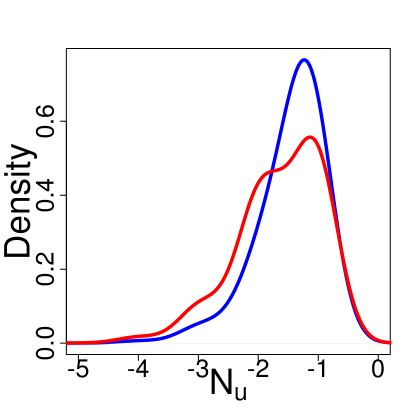
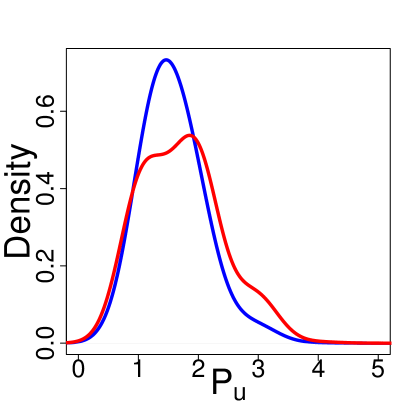
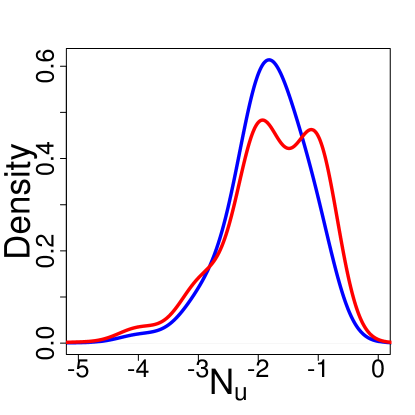
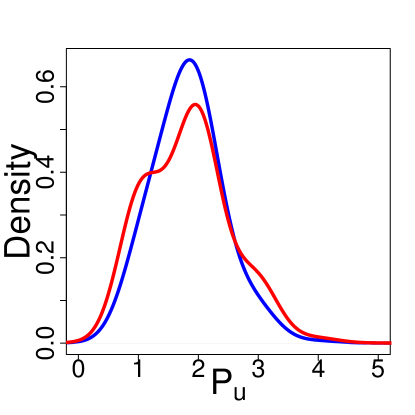
  • 5.3 Activity tendencies

  • [84] A notable difference in the distributions of Figure 5 is the range where P(Nu|I=INA)>P(Nu|I=ACT)fragmentsP(N𝑢|IINA)P(N𝑢|IACT)P(N_{u}|I=\text{INA})>P(N_{u}|I=\text{ACT}) and P(Pu|I=INA)>P(Pu|I=ACT)fragmentsP(P𝑢|IINA)P(P𝑢|IACT)P(P_{u}|I=\text{INA})>P(P_{u}|I=\text{ACT}). For the case of the bug tracker, this condition is present only when NufragmentsN𝑢N_{u} and PufragmentsP𝑢P_{u} are above a certain value (i.e. in terms of absolute valence), while for the case of the mailing list, this is also true when NufragmentsN𝑢N_{u} and PufragmentsP𝑢P_{u} have a sufficiently low absolute value. This indicates that strong emotions in the bug tracker, and deviations from the mean emotions in the mailing list inform about the likelihood of a contributor becoming inactive. To measure these effects, we compute the posterior distribution of a contributor becoming inactive at given time, considering his emotional expression in the last five days as
  • [85]
    P(I=INA|Nu)=P(Nu|I=INA)P(I=INA)P(Nu)fragmentsP(IINA|N𝑢)fragmentsP(N𝑢|IINA)P(IINA)fragmentsP(N𝑢)P(I=\text{INA}|N_{u})=\frac{P(N_{u}|I=\text{INA})\cdot P(I=\text{INA})}{P(N_{u})} (1)
  • [86] and its equivalent for PufragmentsP𝑢P_{u}. We bin PufragmentsP𝑢P_{u} and NufragmentsN𝑢N_{u} in five bins, using the ranges [1,5]fragments[1,5][1,5] and [1,5]fragments[1,5][-1,-5] respectively, computing confidence intervals for the posterior distribution. Figure 6 shows the posterior likelihood of becoming inactive for the first four bins, as the fifth one was not giving significant values due to the low probability of having |Pu|>4fragments|P𝑢|4|P_{u}|>4 and |Nu|>4fragments|N𝑢|4|N_{u}|>4. Our observation of the difference of the influence of emotions in both communication channels becomes clear: the likelihood of becoming inactive increases with PufragmentsP𝑢P_{u} and NufragmentsN𝑢N_{u} in the case of the bug tracker, while it grows with the distance to the mean for the case of the mailing list.
  • [87]
  • Refer to caption Refer to caption

    Figure 6: Likelihood of an interval to be labeled as INA given contributor emotions, P(I=INA|Nu)fragmentsP(IINA|N𝑢)P(I=\text{INA}|N_{u}) (red) and P(I=INA|Pu)fragmentsP(IINA|P𝑢)P(I=\text{INA}|P_{u}) (green), for the bug tracker (left) and the mailing list (right). Error bars show confidence intervals, the horizontal dashed lines indicate P(I=INA)fragmentsP(IINA)P(I=\text{INA}) and vertical bars the means of NufragmentsN𝑢N_{u} and PufragmentsP𝑢P_{u} in each dataset.
  • [88] The distinctive v-shape of the likelihood for the emotions in the mailing list (Figure 6 right) implies that lack of emotions can also serve as an indicator for contributors becoming inactive, but only when shared with others through the mailing list. It is remarkable that both NufragmentsN𝑢N_{u} and PufragmentsP𝑢P_{u} are informative to discriminate periods of inactivity in both datasets, suggesting that the decision to become inactive is more related to emotional intensity in general, rather than to positive or negative emotions alone. This is in line with the psychological theory which states that certain levels of arousal, or emotion intensity, are motivators for activity [Schweitzer2010].
  • [89]
  • [90]
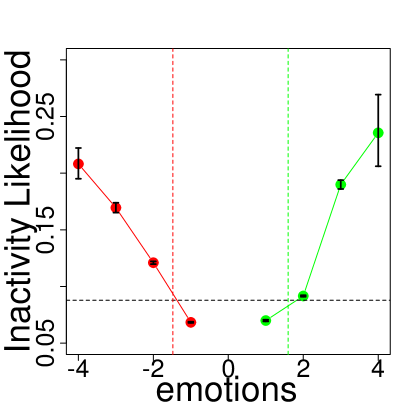
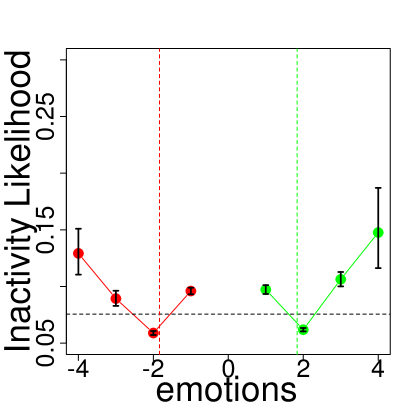
  • 5.4 Real-time prediction

    We apply the Bayesian analysis explained above to predict when contributors are going to start periods of inactivity, solely based on the emotional content of their messages. Given the results shown in Figure 6, we apply two different models:

    1. 1.

      bug tracker: if |Nu|>Θ1fragments|N𝑢|Θ1|N_{u}|>\Theta_{1} or |Pu|>Θ1fragments|P𝑢|Θ1|P_{u}|>\Theta_{1}, then the next interval is predicted to be INA, and ACT otherwise.

    2. 2.

      mailing list: if |NuNu¯|>Θ2fragments|N𝑢¯fragmentsN𝑢|Θ2|N_{u}-\bar{N_{u}}|>\Theta_{2} or |PuPu¯|>Θ2fragments|P𝑢¯fragmentsP𝑢|Θ2|P_{u}-\bar{P_{u}}|>\Theta_{2}, then the next interval is predicted to be INA, and ACT otherwise, where Nu¯¯fragmentsN𝑢\bar{N_{u}} and Pu¯¯fragmentsP𝑢\bar{P_{u}} are the average values of emotions expressed by this contributor.

  • [91] We apply the above predictors with Θ1=1.9fragmentsΘ11.9\Theta_{1}=1.9 and Θ2=0.8fragmentsΘ20.8\Theta_{2}=0.8 to each point in our datasets, and compute values of Precision and Recall [Hooimeijer2007] over 202020 bootstrapped samples, to ensure the robustness of our predictor. Table 4 reports the means and standard deviations of Precision and Recall for each class and dataset. Both predictors have Precision significantly higher than the prior probabilities in the respective classes. In particular, the Precision of the minority class, INA, is sufficiently above the prior probability P(I=INA)fragmentsP(IINA)P(I=\text{INA}), showing that our method produce meaningful results when using contributor emotions to predict when these are at risk of becoming inactive. In addition, the values of Recall for both classes are well above 0.60.60.6, correctly classifying most of the existing instances.
  • [92]
  • Table 4: Results of the prediction of contributors becoming inactive or remaining active in both datasets. Standard deviations of Precision and Recall values are calculated over 202020 bootstrapped samples of the datasets.
    Dataset measure Active Inactive
  • [93]
  • Prior probability 0.9120.9120.912 0.0880.0880.088
    Precision 0.947±0.019fragments0.947plus-or-minus0.0190.947\pm 0.019 0.156±0.015fragments0.156plus-or-minus0.0150.156\pm 0.015
    Gentoo Bugzilla Recall 0.673±0.087fragments0.673plus-or-minus0.0870.673\pm 0.087 0.625±0.013fragments0.625plus-or-minus0.0130.625\pm 0.013
  • [94]
  • Prior probability 0.9240.9240.924 0.0750.0750.075
    Precision 0.954±0.019fragments0.954plus-or-minus0.0190.954\pm 0.019 0.129±0.025fragments0.129plus-or-minus0.0250.129\pm 0.025
    gentoo-dev Recall 0.655±0.073fragments0.655plus-or-minus0.0730.655\pm 0.073 0.635±0.022fragments0.635plus-or-minus0.0220.635\pm 0.022
  • [95]
  • [96]
  • 6 Conclusions

  • [97] Based on a case study of the Gentoo project, we analyzed the relation between emotions and activity of its contributors. We gathered two disjoint datasets of communication within the community: (i) the bug reports stored in its bug tracking system bugzilla, and (ii) the messages posted in the developer’s mailing list. We provided a sentiment analysis of the messages written by all the contributors and related the emotional expressions to the activity patterns.
  • Conversion to HTML had a Fatal error and exited abruptly. This document may be truncated or damaged.