Weak Hard X-ray Emission from Two Broad Absorption Line Quasars Observed with NuSTAR: Compton-thick Absorption or Intrinsic X-ray Weakness?
Abstract
We present NuSTAR hard X-ray observations of two X-ray weak broad absorption line (BAL) quasars, PG 1004+130 (radio loud) and PG 1700+518 (radio quiet). Many BAL quasars appear X-ray weak, probably due to absorption by the shielding gas between the nucleus and the accretion-disk wind. The two targets are among the optically brightest BAL quasars, yet they are known to be significantly X-ray weak at rest-frame 2–10 keV (16–120 times fainter than typical quasars). We would expect to obtain –600 hard X-ray ( keV) photons with NuSTAR, provided that these photons are not significantly absorbed ( cm-2). However, both BAL quasars are only detected in the softer NuSTAR bands (e.g., 4–20 keV) but not in its harder bands (e.g., 20–30 keV), suggesting that either the shielding gas is highly Compton-thick or the two targets are intrinsically X-ray weak. We constrain the column densities for both to be cm-2 if the weak hard X-ray emission is caused by obscuration from the shielding gas. We discuss a few possibilities for how PG 1004+130 could have Compton-thick shielding gas without strong Fe K line emission; dilution from jet-linked X-ray emission is one likely explanation. We also discuss the intrinsic X-ray weakness scenario based on a coronal-quenching model relevant to the shielding gas and disk wind of BAL quasars. Motivated by our NuSTAR results, we perform a Chandra stacking analysis with the Large Bright Quasar Survey BAL quasar sample and place statistical constraints upon the fraction of intrinsically X-ray weak BAL quasars; this fraction is likely .
Subject headings:
accretion, accretion discs – galaxies: active – galaxies: nuclei – quasars: absorption lines – quasars: emission lines – X-rays: general1. INTRODUCTION
1.1. Quasar Outflows and the X-ray Properties of Broad Absorption Line Quasars
Fast outflows are a common feature of active galactic nuclei (AGNs) over more than four orders of magnitude in luminosity (e.g., Reynolds, 1997; Crenshaw et al., 1999; Laor & Brandt, 2002; Ganguly & Brotherton, 2008; Gibson et al., 2009). AGN outflows appear to be a substantial component of the nuclear environment, and their ubiquity suggests that mass ejection is probably linked to or even required for mass accretion onto a supermassive black hole (SMBH). For example, outflows could provide a mechanism for expelling angular momentum from the accreting material (e.g., Emmering et al., 1992; Konigl & Kartje, 1994). Moreover, outflows in luminous AGNs may play an important role in the feedback of SMBHs into typical massive galaxies (e.g., Di Matteo et al., 2005; Chartas et al., 2009; Sturm et al., 2011; Borguet et al., 2013; Rupke & Veilleux, 2013). The outflowing material could drive away sufficient gas from the host galaxy to quench both star formation and SMBH growth, leading to the observed relations between the mass of the SMBH and the properties of the galaxy bulge (e.g., Gültekin et al., 2009).
The strongest observational signature of outflows from luminous AGNs (i.e., quasars) is broad absorption lines (BALs; Lynds 1967) in the ultraviolet (UV); these are seen in of optically selected quasars (e.g., Hewett & Foltz, 2003; Trump et al., 2006; Gibson et al., 2009; Allen et al., 2011). Aside from dust reddening, BAL quasars generally have indistinguishable continuum spectral energy distributions (SEDs) from non-BAL quasars from the infrared (IR) to the UV (e.g., Gallagher et al., 2007; Lazarova et al., 2012). It has been suggested that all/most quasars have BAL winds, with BALs being observed only when inclination angles are large and the line of sight passes through the outflowing wind (e.g., Weymann et al. 1991; Ogle et al. 1999; DiPompeo et al. 2013). The intrinsic fraction of BAL quasars, after correcting for selection effects, is (see, e.g., Gibson et al. 2009 and references therein), suggesting that the wind has an average covering factor of .111There is likely a range of covering factors of BAL winds, and is the average value. Quasars with winds having larger covering factors would have larger chances of being observed as BAL quasars. An alternative hypothesis is that BAL quasars represent an early evolutionary stage of quasars and/or the appearance as a BAL quasar might be related to the duty cycle of SMBH growth (e.g., Becker et al., 2000; Gregg et al., 2006).
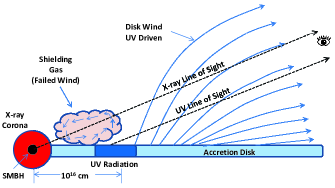
A promising scenario for BAL quasar outflows is the accretion-disk wind model, where the wind is launched from the disk at –1017 cm and is radiatively driven by UV line pressure (e.g., Murray et al., 1995; Proga et al., 2000). Figure 1 is a schematic illustration of the model. UV absorption-line profiles predicted by this model are consistent with observations of BAL quasars (e.g., Proga & Kallman, 2004). Since line-driving becomes less efficient when the ionization state of the gas is too high, the disk-wind model has invoked “shielding” material to prevent the wind from being overionized by the extreme UV (EUV) and soft X-ray radiation from the innermost accretion disk and its corona. One proposed origin for the shielding gas is a “failed wind”, which is located at the base of the UV-absorbing wind and consists of material that does not reach escape velocity due to overionization (e.g., Proga & Kallman, 2004; Sim et al., 2010). The detailed geometry of the shielding gas is still uncertain (e.g., it could also perhaps “hug” the UV-absorbing wind).
Under the above scenario, AGNs with observable disk winds would appear X-ray weak due to absorption by the shielding gas. Indeed, BAL quasars are in general X-ray weak, and X-ray absorption is often seen (e.g., Gallagher et al., 2002, 2006; Gibson et al., 2009). Moreover, the observed X-ray weakness of BAL quasars is correlated with the absorption strength and maximum velocity of the UV C IV BALs (e.g., Gallagher et al., 2006; Gibson et al., 2009; Wu et al., 2010), suggesting that the shielding gas does play a role in shaping the properties of the UV wind. The X-ray absorption in BAL quasars often appears complex (i.e., not just a simple photoelectric absorption cutoff but an ionized or partially covering absorber); the measured absorption column densities () are typically in the range of to cm-2, although absorption constraints usually have significant uncertainties due to limited photon statistics and poorly constrained absorption complexity (e.g., Gallagher et al., 2001, 2002; Fan et al., 2009). X-ray absorption variability has been observed in a few BAL quasars on timescales of years (e.g., Gallagher et al., 2004; Miller et al., 2006; Chartas et al., 2009; Saez et al., 2012), indicating that the shielding gas can be a dynamical structure subject to rotational and outflow/inflow motions, but the details of the dynamics remain unclear.222Substantial BAL variability is also seen in BAL quasars on multi-year timescales (e.g., Gibson et al., 2008b, 2010; Capellupo et al., 2011, 2012; Filiz Ak et al., 2012), but unfortunately correlations between X-ray and UV absorption variability have not been systematically explored. Significant flux variability has also been seen in a few objects (e.g., Gallagher et al., 2004). However, when compared with the quasar population in general, BAL quasars do not show exceptional X-ray variability (Saez et al., 2012). Overall, the nature of the shielding gas in BAL quasars remains poorly constrained.
With the current X-ray spectra of BAL quasars observed by ASCA, Chandra, or XMM-Newton, the X-ray absorption column density can be constrained up to cm-2. At higher column densities, even photons at energies of –10 keV are severely absorbed, and the observed X-ray spectra may be dominated by a scattered/reflected component. It is thus difficult to determine the absorption properties for heavily obscured ( cm-2) or Compton-thick ( cm-2; see, e.g., Comastri 2004 for a review) objects. Supplemented with multiwavelength data, the level of X-ray weakness can be estimated by comparing the SEDs of BAL quasars to those of typical quasars (e.g., Gallagher et al., 2001, 2007; Miller et al., 2006). Specifically, in such comparisons the X-ray-to-optical power-law slope parameter () is often used (e.g., Gallagher et al., 2002, 2006), which is a measure of the soft X-ray (2 keV) luminosity of a quasar relative to its optical/UV luminosity. This parameter is known to be correlated with the 2500 Å monochromatic luminosity () of the quasar (e.g., Steffen et al., 2006), and thus , defined as the difference between the observed and the one expected from (), indicates the level X-ray weakness of the source.
For many BAL quasars, the observed X-ray weakness can be attributed entirely to absorption. It is clear that their keV photons have penetrated the obscuring material, and, after correcting for the moderate absorption, their X-ray fluxes recover to nominal levels (). In these cases, the absorption-corrected 2 keV flux, and thus and , are generally estimated assuming a power-law spectrum (e.g., with a nominal photon index ) and normalizing it to the hard X-ray (e.g., rest-frame keV) continuum (e.g., Gallagher et al., 2006; Fan et al., 2009). For some of the sources with better spectra, absorption corrections can be derived directly via spectral fitting (e.g., Gallagher et al., 2002; Grupe et al., 2003; Shemmer et al., 2005; Giustini et al., 2008). It has also been found that the effective photon index determined from hardness ratios is correlated with the level of X-ray weakness (), i.e., X-ray weaker sources are harder, suggesting that absorption plays an important role in causing the X-ray weakness of the general BAL quasar population (e.g., Gallagher et al., 2006).
On the other hand, some BAL quasars show significant X-ray weakness which cannot be accounted for by the apparent X-ray absorption determined using keV data. In these cases the X-ray continuum levels are still factors of –20 lower than the expected SED levels after absorption corrections ( to ; e.g., Gallagher et al. 2006). The nature of the X-ray weakness for such objects is uncertain. It is possible that they are heavily obscured, and the observed X-ray spectra are dominated by the scattered/reflected component. Alternatively, these objects could be intrinsically X-ray weak compared to typical quasars, not emitting X-rays at a nominal level (e.g., Gallagher et al., 2001; Leighly et al., 2007b; Gibson et al., 2008a; Wu et al., 2011). An example of a mechanism that could cause intrinsic X-ray weakness is wind quenching of the accretion-disk corona, as proposed by Proga (2005), where the coronal X-ray emission is suppressed when the failed disk wind falls into the corona and makes it “too dense, too opaque, and consequently too cold”. A few BAL quasars have been suggested to have Compton-thick absorption (e.g., Mathur et al., 2000; Clavel et al., 2006). These studies are based on the weak/non detection of the source in the X-ray band, making detailed spectral analysis infeasible. Therefore the scenario of intrinsic X-ray weakness cannot be excluded.
An open question is whether even stronger X-ray absorption could be present in X-ray weak BAL quasars, or if instead some of these quasars are actually intrinsically X-ray weak. One way to address this is to observe at higher energies where the X-rays are considerably more penetrating. For example, the BeppoSAX observation of the BAL quasar Mrk 231 revealed an absorption column density of cm-2, with only the –50 keV X-rays observed by BeppoSAX able to penetrate the obscuring gas (Braito et al., 2004); this discovery was later apparently confirmed by the Suzaku data in the 15–30 keV band (Piconcelli et al., 2013).333Note, however, that recent NuSTAR observations of Mrk 231 are not consistent with the BeppoSAX results, perhaps due to source contamination in the large beam of the earlier observations (S. Teng et al. 2013, in prep.). With the successful launch of the Nuclear Spectroscopic Telescope Array (NuSTAR; Harrison et al. 2013) on 2012 Jun 13, it is possible to investigate this question systematically. NuSTAR is the first focusing telescope in orbit observing in the hard X-ray (3–79 keV) band; it provides about two orders-of-magnitude improvement in keV sensitivity over previous hard X-ray missions, as well as accurate source positions (). A NuSTAR survey of significantly X-ray weak BAL quasars can detect X-rays penetrating the absorber at keV unless the absorber is very Compton-thick, and thereby better constrain the nature of the shielding gas and the disk-wind mechanism.
1.2. The Two Targeted Broad Absorption Line Quasars
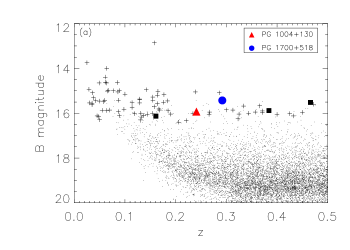
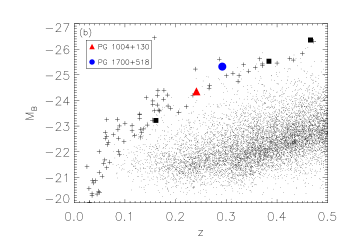
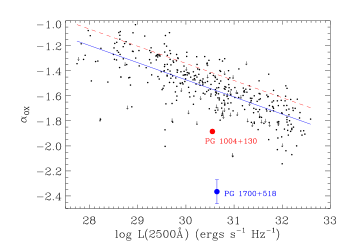
As a pilot program, we selected two well studied BAL quasars, PG 1004+130 and PG 1700+518, that appear X-ray weak and observed them with NuSTAR. We selected these two targets from the 87 Palomar-Green (PG) quasars (Schmidt & Green, 1983) at . These PG quasars represent one of the best-studied samples of luminous quasars in the nearby universe, and the more luminous PG quasars are also representative local counterparts of quasars (including BAL quasars) at higher redshifts (e.g., ) from the Sloan Digital Sky Survey (SDSS; York et al. 2000) in terms of luminosity. Five BAL quasars have been classified within this PG quasar sample (see Footnote 4 of Brandt et al., 2000), two of which (PG 1001+054 and PG 2112+059) show soft X-ray weakness that was considered to be accounted for by moderate absorption (e.g., Gallagher et al., 2001, 2004; Schartel et al., 2005).444We later examined the XMM-Newton data for PG 1001+054, and found that the ionized absorption derived from spectral fitting (Schartel et al., 2005) is not sufficient to explain the X-ray weakness (still a factor weaker after absorption correction). The other three are also X-ray weak but the nature of their X-ray weakness is not as well understood; among these three, we chose the two lower redshift objects as our targets here (PG 1004+130 at and PG 1700+518 at ; the other object is PG 0043+039 at ). PG 1004+130 and PG 1700+518 are among the optically brightest BAL quasars known; see Figure 2. Also shown in Figure 2 are the 87 PG quasars and the SDSS Data Release 7 (DR7; Abazajian et al. 2009) quasars from the catalog in Schneider et al. (2010).
PG 1004+130 and PG 1700+518 show clearly detected BALs (e.g., Pettini & Boksenberg, 1985; Wills et al., 1999; Brandt et al., 2000; Young et al., 2007). Aside from dust reddening in PG 1700+518, their optical and UV spectra (continua and emission lines, excluding the BAL regions) appear normal compared to typical quasars. PG 1700+518 is also sub-classified as a low-ionization BAL (LoBAL) quasar.555 BAL quasars are broadly classified as high-ionization BAL (HiBAL) and LoBAL quasars. LoBAL quasars are a subset () of BAL quasars that have BALs from ions at lower ionization states such as Mg II or Al III (e.g., Weymann et al., 1991; Sprayberry & Foltz, 1992). They often show signs of dust reddening and are X-ray weaker than HiBAL quasars (e.g., Green et al., 2001; Gallagher et al., 2006; Gibson et al., 2009). Both objects are well studied and have superb multiwavelength coverage (e.g., Ogle et al., 1999; Schmidt & Hines, 1999; Wills et al., 1999; Brandt et al., 2000; Miller et al., 2006; Young et al., 2007). PG 1004+130 is radio loud with a radio-loudness parameter (); such radio-loud BAL quasars are relatively rare (e.g., Shankar et al., 2008; Miller et al., 2009). PG 1700+518 is radio quiet ().
In the X-ray band, PG 1004+130 and PG 1700+518 do not show the expected level of X-ray emission (determined using the – relation) for a luminous quasar at energies below –10 keV. The Chandra and XMM-Newton spectra of PG 1004+130 show modest X-ray absorption ( cm-2) with a partial-covering absorbed power-law model, and the derived photon index is consistent with the typical value for radio-loud quasars (; e.g., Page et al. 2005); however, the X-ray continuum flux after correction for this absorption is still times lower than that expected from its optical/UV flux (Miller et al., 2006, 2011). PG 1700+518 has been observed by XMM-Newton with a ks exposure. The spectrum is flat () compared to the typical photon index of for radio-quiet quasars (e.g., Reeves et al., 1997; Page et al., 2005; Just et al., 2007; Shemmer et al., 2008; Scott et al., 2011), and the absorption column density was constrained to be cm-2 with an absorbed power-law model (Ballo et al., 2011). After correction for this strong absorption, PG 1700+518 is still times X-ray weaker than expected. It was also weakly detected in a ks exposure by Chandra ( counts in the 0.5–8 keV band; Saez et al. 2012). Note that in these calculations the optical/UV fluxes of these two quasars have not been corrected for any intrinsic reddening, which would render them even X-ray weaker.
As mentioned in Section 1.1 above, absorption column densities constrained by X-ray data below –10 keV could be biased for objects that are heavily obscured or even Compton-thick, as the observed X-ray spectra are probably dominated by the scattered/reflected component. Given the expected underlying X-ray continua assuming normal quasar SEDs for PG 1004+130 and PG 1700+518 (i.e., the underlying 2 keV luminosities satisfying the – relation), if we were able to detect direct nuclear hard X-rays with NuSTAR, we would expect to obtain -600 hard X-ray ( keV) counts. Therefore, PG 1004+130 and PG 1700+518 are ideal targets for an initial sampling of the hard X-ray ( keV) properties of X-ray weak BAL quasars.
1.3. Paper Layout and General Definitions
This paper is organized as follows. In Section 2 we describe the NuSTAR observations and our data-analysis approach. We present photometric and spectroscopic properties of the two targets when available. In Section 3 we present multiwavelength properties of the two targets, which show weak hard X-ray emission compared to typical quasars. In Section 4 we infer the absorption column densities from the data assuming that the weak hard X-ray emission is caused by obscuration by the shield gas, and we discuss physical implications and issues related to the Fe K line. We also discuss the possibility of the two targets being intrinsically X-ray weak based on a coronal-quenching model. We summarize in Section 5.
Throughout this paper, we use J2000.0 coordinates and a cosmology with km s-1 Mpc-1, , and (e.g., Komatsu et al., 2011). For the spectral modeling, we use the cosmic abundances of Anders & Grevesse (1989) and the photoelectric absorption cross-sections of Balucinska-Church & McCammon (1992). We adopt the terminology that has been used in previous studies to describe X-ray weakness (e.g., Laor et al., 1997; Brandt et al., 2000; Gallagher et al., 2001; Leighly et al., 2007b; Gibson et al., 2008a): the term “X-ray weak” indicates that the observed X-ray emission is significantly weaker than that expected from the optical–UV continuum SED, while the term “intrinsically X-ray weak” refers to one possible cause for the observed X-ray weakness where the object simply does not produce X-ray emission at a nominal level (one other apparent cause would be absorption).
2. NUSTAR OBSERVATIONS AND DATA ANALYSIS
2.1. NuSTAR Observations and Photometric Properties
NuSTAR carries two co-aligned X-ray telescopes with a focal length of 10.15 m focusing hard X-ray photons (3–79 keV) onto two shielded focal plane modules (FPMs A and B; Harrison et al. 2013). Each FPM consists of four CdZnTe pixel sensors placed in a two-by-two array, providing a field of view at 10 keV. NuSTAR has excellent angular resolution compared to previous hard X-ray missions, with a half-power diameter (HPD) of and a full width at half maximum (FWHM) of independent of energy.
PG 1004+130 and PG 1700+518 were observed by NuSTAR with exposure times of ks and ks, respectively. The details of the observations are listed in Table 1. We processed the data using the NuSTAR Data Analysis Software (NuSTARDAS) v0.9.0 with NuSTAR CALDB 20121126. Cleaned calibrated event files were created using the nupipeline script. For each source in each of the two FPMs, we created X-ray images in five bands: 4–10 keV, 4–20 keV, 10–20 keV, 20–30 keV, and 30–79 keV using the Chandra Interactive Analysis of Observations (CIAO)666See http://cxc.harvard.edu/ciao/ for details on CIAO. v4.4 tool dmcopy. The images are oversampled, and the pixel size is . We searched for sources in these images using the CIAO tool wavdetect (Freeman et al., 2002) with a false-positive probability threshold of 10-6 and wavelet scales of 2, 4, 8, and 16 pixels. PG 1004+130 is relatively bright, and it is detected in multiple bands in both FPMs. PG 1700+518 appears to be faint, and it is detected only in the 4–20 keV image of FPM A. The background in FPM B around the source position of PG 1700+518 is –40% higher than that in FPM A at lower energies ( keV), rendering the source undetectable in this FPM. This higher level of background in FPM B is caused by a larger level of stray light at the position of the source due to unfocused aperture leakage (Harrison et al., 2013).
We adopted X-ray positions based on the wavdetect detection in the 4–20 keV band, which appears to be the most sensitive band among the five bands we studied, and the positions appear good upon visual inspections. For faint sources, NuSTAR provides positional accuracy to better than 5″. The X-ray position of PG 1004+130 in FPM A is 3.1″ away from its optical position, and in FPM B the offset is 0.1″. For PG 1700+518 in FPM A, the X-ray position is 1.5″ away from the optical position. Overall, NuSTAR provided accurate X-ray positions for these two BAL quasars, and the positional offsets are within expectations for faint sources. This assures us that the X-ray emission detected comes from our two targets. Neither of the two objects is detected in the 20–30 keV or 30–79 keV bands. More than 100 net counts would be expected for either source in the 20–30 keV band if it had a typical quasar SED (i.e., a 2 keV luminosity given by the – relation and a power-law X-ray continuum with ). This suggests that their hard X-ray photons did not penetrate the obscuring material or they are intrinsically X-ray weak. No serendipitous sources were detected in the fields of view of the NuSTAR observations. The 4–20 keV images of PG 1004+130 and PG 1700+518 in FPM A are shown in Figure 3, centered on the X-ray source positions.
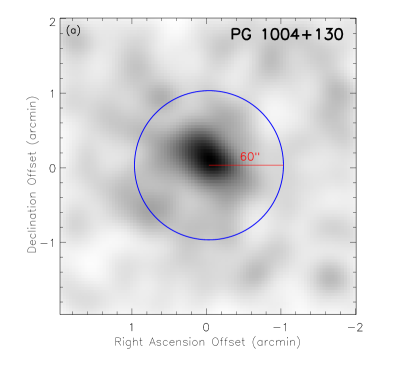
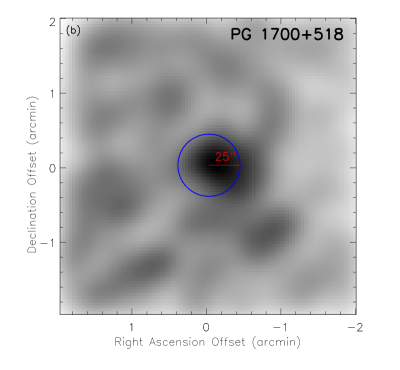
We performed aperture photometry to extract source counts in the NuSTAR bands. Background counts were extracted from an annular region centered on the X-ray position with inner radius 120″ and outer radius 180″. Different choices of the background-extraction region (e.g., a circular region in the source vicinity but outside the 120″-radius aperture) do not appear to affect the background estimate systematically, and the number of background counts generally fluctuates at the level. For the relatively bright source, PG 1004+130, we used a 60″-radius circular aperture to extract source counts; this aperture approximates the encircled-energy fraction (EEF) contour of the point spread function (PSF). Extended jet emission from PG 1004+130 has been detected by Chandra (Miller et al., 2006), and it is included in the NuSTAR aperture extraction here. However, the observed X-ray flux from the extended jet is only of the nuclear flux (Miller et al., 2006), and therefore it does not affect our analysis of the nuclear emission.777Note that the unresolved nuclear emission may have a more significant contribution from jet-linked X-rays created on sub-kpc scales; see Section 4.1.2 below. PG 1700+518 is only weakly detected in FPM A, and thus we chose a smaller source-extraction region to optimize the signal-to-noise ratio. We used a circular aperture with a radius of 25″, corresponding to an EEF of .
For both sources in each band, we derived their aperture-corrected net (background-subtracted) counts. We calculated a binomial no-source probability, , to assess the significance of the source signal, defined as
| (1) |
In the above equation, is the total number of counts in the source-extraction region; , where is the total number of counts in the background region; , where is the area scaling factor between the background and source regions. represents the probability of observing the source counts by chance (due to a background fluctuation) under the assumption that there is no source at the relevant location. It has been used to filter out low-significance sources and create reliable catalogs of Chandra sources (e.g., Broos et al., 2007; Xue et al., 2011; Luo et al., 2013). For our two targets here, if the value in a band is smaller than 0.01 (), we considered the source to be detected and calculated the 1 errors on the net counts, which were derived from the 1 errors (Gehrels, 1986) on the extracted source and background counts following the numerical method in Section 1.7.3 of Lyons (1991). If the value is larger than 0.01, we considered the source undetected in this band and derived an upper limit on the source counts using the Bayesian approach of Kraft et al. (1991) for a 90% confidence level. Under this criterion, PG 1004+130 and PG 1700+518 are detected in the 4–10 keV, 4–20 keV, and 10–20 keV bands (except for PG 1700+518 in FPM B). The source counts and upper limits of the two targets are listed in Table 2.
Using the band ratio, defined here as the ratio between the observed 10–20 keV and 4–10 keV counts, we derived an effective photon index () for a power-law model with the Galactic absorption column density (Table 1). We utilized the NuSTAR spectral response files (produced by the pipeline extraction of the spectrum at the source location) and the fakeit command in XSPEC (version 12.8.0; Arnaud 1996) to calibrate the relation between the effective photon index and band ratio. Similarly, we calibrated a count-rate-to-flux conversion factor that depends on the effective photon index assuming a power-law model, and then converted the source count rates to fluxes. The 1 error for was derived using the errors on the counts, and flux errors were derived using the errors on the counts and .
The effective photon indices and fluxes of the two targets are shown in Table 2. PG 1004+130 appears to be a fairly soft X-ray source with , while PG 1700+518 has a hard X-ray spectrum with . The small value (although with a large uncertainty) for PG 1700+518 suggests that significant absorption ( cm-2) and likely also Compton reflection is present. Note that a column density of cm-2 was derived from the XMM-Newton data with an absorbed power-law model (Ballo et al., 2011). The X-ray luminosities in the 4–20 keV band (listed in Table 2) for the two objects are erg s-1 and erg s-1, smaller than expectations for typical quasars ( erg s-1). The photometric properties of PG 1004+130 in FPMs A and B appear consistent. For PG 1700+518, the upper limits on the counts and fluxes in FPM B are consistent with those measurements in FPM A.
2.2. NuSTAR Spectral Analysis for PG 1004+130
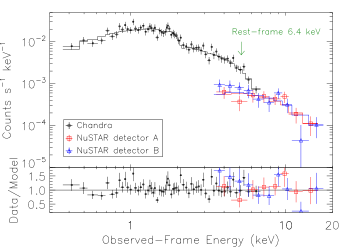
Spectral analysis for the NuSTAR spectra of PG 1700+518 is not feasible as the extracted spectra are dominated by background. However, we were able to perform basic spectral analysis for PG 1004+130. We extracted spectra of PG 1004+130 in FPMs A and B using the NuSTARDAS script nuproducts. The same source- and background-extraction regions as used for the photometry above were adopted, and PSF corrections have been applied to the Auxiliary Response Files (ARFs). To extend the spectral coverage to lower energies ( keV), we fit the NuSTAR data jointly with a Chandra spectrum. The 41.6 ks Chandra observation of PG 1004+130 with the S3 CCD of the Advanced CCD Imaging Spectrometer (ACIS; Garmire et al. 2003) was described in detail in Miller et al. (2006). We extracted the Chandra spectrum using the CIAO tool specextract, with a circular source aperture of 4″ in radius and a source-free background annulus of 12″–20″ in radius. All the spectra were grouped with a signal-to-noise ratio of 5, and we fit the 0.3–8 keV Chandra and 3–20 keV NuSTAR spectra together with a partial-covering absorber model as suggested by Miller et al. (2006). The XSPEC model used was zpcfabs*zpowerlw*wabs, where zpcfabs is a partial-covering absorption model, zpowerlw is an underlying power-law spectrum, and wabs is to account for Galactic absorption. The spectral-shape parameters for the model (absorption column density , covering factor , and photon index ) were free to vary but tied for the three spectra, and we let the normalization parameters for the three spectra vary to allow for possible flux variation and cross-calibration uncertainties.
The joint spectra overlaid with the best-fit model are displayed in Figure 4. The best-fit model is statistically acceptable, with a null-hypothesis probability of 0.39 (). The model parameters are cm-2, , and ; the quoted errors are at the 90% confidence level for one parameter of interest (). These parameters are comparable to those derived in Miller et al. (2006) using the Chandra data alone. The intrinsic photon index, , is consistent with the typical of radio-loud quasars (e.g., Page et al., 2005). We also tried to fit only the hard X-ray data (4–20 keV) with a simple power-law model modified by Galactic absorption. The derived photon index is for either the NuSTAR data alone or the NuSTAR plus Chandra data set, consistent with the value estimated from the band ratio for PG 1004+130 (Table 2). The apparent moderate absorption and soft spectral shape of PG 1004+130 do not suggest Compton-thick absorption. However, the apparent absorption is not sufficient to explain the X-ray weakness of this object, and a Compton-thick absorber may still be present, if the observed spectra are dominated by a fraction of the jet X-ray emission that is not obscured by the absorber (see the further discussion in Section 4.1.2 below).
In the best-fit partial-covering absorber model, the normalization parameters for the NuSTAR spectra in FPMs A and B are only 42% and 46% of that for the Chandra spectrum, indicating that the 3–8 keV flux of PG 1004+130 observed by NuSTAR has dropped by a factor of compared to the Chandra observation in 2005. The NuSTAR fluxes derived from the best-fit model are consistent with those derived from the photometric approach above (Table 2) within the 1 errors, suggesting that the flux discrepancy is not likely caused by uncertainties introduced during the XSPEC fitting. There was a simultaneous Swift XRT observation of PG 1004+130 during the NuSTAR observation. However, the XRT exposure is only 2.0 ks, and PG 1004+130 is not detected. The upper limit on the XRT flux does not provide useful constraints on the X-ray variability. PG 1004+130 is known to be variable in the X-ray band. The 2–8 keV Chandra flux is times the XMM-Newton flux observed in 2003, and it is times the 2–8 keV flux limit inferred from the 1980 Einstein 0.5–4.5 keV nondetection (Elvis & Fabbiano, 1984; Miller et al., 2006). Therefore, it is likely that the X-ray flux of PG 1004+130 has decreased by a factor of in the 2012 NuSTAR observation compared to its Chandra flux in 2005. We caution that variability between NuSTAR and Chandra observations might also affect the best-fitting model above, since we tied the spectral-shape parameters in the modeling and spectral variability has been observed in several BAL quasars (although it is not well constrained; e.g., Gallagher et al. 2004; Saez et al. 2012).
We note that there is no apparent Fe K line emission at rest-frame 6.4 keV (5.2 keV in the observed frame) shown in the spectra in Figure 4, as has been generally observed in X-ray spectra dominated by a reflection component (e.g., Turner et al., 1997; Bassani et al., 1999; Comastri, 2004; LaMassa et al., 2011). Adding a narrow line at 6.4 keV with a fixed width of 0.01 keV does not improve the fit. The 90% confidence-level upper limit on the rest-frame Fe K line equivalent width (EW) is eV. There is no evidence for a He-like or H-like Fe K line at 6.7 keV or 7.0 keV either.
3. SPECTRAL ENERGY DISTRIBUTIONS
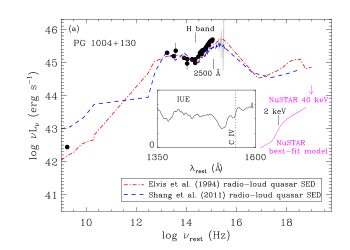
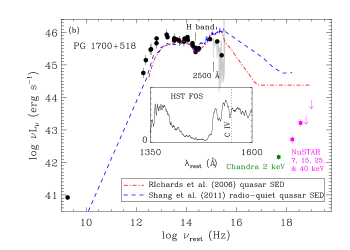
We constructed radio-to-X-ray SEDs for PG 1004+130 and PG 1700+518, which have superb multiwavelength coverage. We collected photometric data from the literature (Neugebauer et al., 1979, 1987; Schmidt & Green, 1983; White & Becker, 1992; Haas et al., 2003; Serjeant & Hatziminaoglou, 2009), the NRAO VLA Sky Survey (NVSS; Condon et al. 1998), the Wide-field Infrared Survey Explorer (WISE; Wright et al. 2010), the Two Micron All Sky Survey (2MASS; Skrutskie et al. 2006), the SDSS, and/or the Galaxy Evolution Explorer (GALEX; Martin et al. 2005) catalogs. We adopted the and/or band magnitudes from Guyon et al. (2006), which have the host-galaxy contribution removed via two-dimensional fitting of the images. We also obtained Hubble Space Telescope (HST) GHRS and International Ultraviolet Explorer (IUE) UV spectra for PG 1004+130 from the Mikulski Archive for Space Telescopes (MAST)888http://archive.stsci.edu/., and an HST FOS spectrum for PG 1700+518 from Evans & Koratkar (2004). The optical and UV data have been corrected for Galactic extinction following the dereddening approach presented in Calzetti et al. (2000). For PG 1004+130, we adopted the best-fit X-ray spectral model (with the NuSTAR normalization) determined in Section 2.2 along with the upper limit on the 40 keV NuSTAR luminosity derived from the photometric information in Table 2. For PG 1700+518, we used the 2 keV Chandra luminosity (Saez et al., 2012),999The keV X-ray emission of PG 1700+518 likely has a small contribution from its star-forming activity (; Ballo et al. 2011), which does not affect our analyses here. 7 keV and 15 keV NuSTAR luminosities, and 25 keV and 40 keV NuSTAR luminosity upper limits; the NuSTAR data are again derived from the photometric information in Table 2. The rest-frame SEDs are shown in Figure 5. The C IV BAL features of these two quasars are also shown in Figure 5 as inset panels: the broad C IV troughs are clearly visible with the one in PG 1700+518 being deeper and broader.
To compare the SEDs of these two BAL quasars to those of typical quasars, we overlaid in Figure 5 the composite radio-loud (for PG 1004+130) quasar SEDs from Elvis et al. (1994) and Shang et al. (2011) or radio-quiet (for PG 1700+518) quasar SEDs from Richards et al. (2006) and Shang et al. (2011).101010For radio-quiet quasars, the Elvis et al. (1994) sample is biased toward X-ray bright quasars, and the Elvis et al. (2012) XMM-COSMOS sample consists mainly of less-luminous AGNs, and thus these composite SEDs were not adopted here; using these composite SEDs would make the X-ray emission of PG 1700+518 even weaker compared to the quasar samples. The Shang et al. (2011) radio-quiet SED is also biased toward X-ray bright quasars, although not as significantly as the one in Elvis et al. (1994). The X-ray continuum in the Richards et al. (2006) composite SED was derived from the – relation and is thus consistent with our interpretation of the underlying quasar X-ray spectra here. We extrapolated the Richards et al. (2006) SED to higher energies assuming a power law to provide a fair comparison with the observed NuSTAR data; studies of high-redshift quasars (e.g., Page et al., 2005; Shemmer et al., 2008) indicate that their rest-frame –40 keV continua generally follow such a power law. The composite SEDs were normalized to the observed SEDs at the band, where the SEDs are largely free of intrinsic reddening and the data have been corrected for host-galaxy contamination (Guyon et al., 2006). The composite quasar SEDs from different studies agree well in general except that the Shang et al. (2011) radio-quiet SED is biased toward X-ray bright quasars. From the radio to the UV, the continuum SEDs of our two targets agree well with the composite SEDs. The SED of PG 1700+518 shows intrinsic reddening in the optical and UV, which is consistent with previous findings that BAL quasars, and especially LoBAL quasars, are in general redder than non-BAL quasars (e.g., Brotherton et al., 2001; Trump et al., 2006; Gallagher et al., 2007; Gibson et al., 2009). By comparing the PG 1700+518 SED to the composite SEDs, we estimated the reddening to be , in agreement with the average value for LoBAL quasars (e.g., Gibson et al., 2009).
Both BAL quasars are significantly X-ray weak compared to typical quasars. We computed the parameter, defined as , for quantitative comparison. The rest-frame 2500 Å flux density () was determined by interpolating/extrapolating the optical–UV photometric data points. For PG 1700+518, the dust reddening was not corrected; reddening correction would increase the 2500 Å flux density by (i.e., more negative ). The rest-frame 2 keV flux density was derived from the best-fit spectral model (see Section 2.2 above) for PG 1004+130, and it was adopted from the weighted-average value of Chandra and XMM-Newton observations in Ballo et al. (2011) and Saez et al. (2012) for PG 1700+518. The values are and for PG 1004+130 and PG 1700+518, respectively. The – plot is shown in Figure 6.
For comparison, the Steffen et al. (2006) – relation for radio-quiet quasars predicts for PG 1700+518. PG 1004+130 is radio loud, and the Steffen et al. (2006) relation is not applicable. We thus adjusted the expected value by accounting for the excess X-ray luminosity expected for a radio-loud quasar with the radio loudness of PG 1004+130 (see the relation in Section 4 of Miller et al. 2011). The resulting expected value for PG 1004+130 is . Therefore, although the continuum radio-to-UV SEDs of these two BAL quasars resemble those of typical quasars, their soft X-ray ( keV) luminosities are (for PG 1004+130, with a 1 range of 3–76) and (for PG 1700+518, with a 1 range of 36–400) times lower than the typical values. After corrections for apparent X-ray absorption determined from keV data, their soft X-ray luminosities are still 11 and 12 times lower than expected (see Section 1.2).
It has been suggested that there is an additional correlation between and the Eddington ratio (e.g., Lusso et al., 2010), where is lower (i.e., more X-ray weak) when the Eddington ratio is higher. However, the correlation suggests super-Eddington accretion for (also lacking sampling in this regime), which does not appear to be the case for our two targets (see Section 4.1.2 for their Eddington ratios).
In the hard X-ray bands probed by NuSTAR, the luminosities of PG 1004+130 and PG 1700+518 are also below expectations. At rest-frame 20 keV, the NuSTAR luminosities are more than an order of magnitude lower than those of typical quasars; even at rest-frame 40 keV, where the NuSTAR sensitivity to faint sources is lower, the 90% confidence-level upper limits on the luminosities are still a few times smaller than expectations. If these two BAL quasars are able to produce X-ray emission as typical quasars do, the NuSTAR data indicate that Compton-thick obscuration is present that blocks not only the soft X-rays but also the hard X-rays.
4. DISCUSSION
Given the NuSTAR and multiwavelength data presented above for the two BAL quasars targeted, it appears that either (1) there is highly Compton-thick obscuration and even the hard X-rays probed by NuSTAR cannot penetrate the obscuring material, or (2) these objects are intrinsically X-ray weak. In the following, we discuss these two scenarios in more detail.
4.1. Compton-thick Absorption?
4.1.1 Absorption Column-Density Constraints
For many BAL quasars, the observed X-ray weakness can be fully accounted for by absorption (see Section 1.1). The estimated absorption column densities for these objects have a continuous distribution between cm-2 and cm-2, and thus we expect that there should probably be objects with higher column densities (e.g., – cm-2) as well. Furthermore, one of our targets, PG 1700+518, shows an effective photon index of , suggesting significant absorption. Therefore, it is natural to consider the possibility of Compton-thick absorption for objects that show significant hard X-ray weakness. The underlying X-ray continua of these objects would then be comparable to those of typical quasars, but their observed X-ray spectra would probably be dominated by the scattered/reflected component.
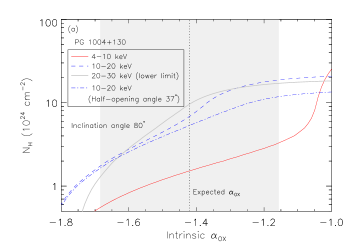
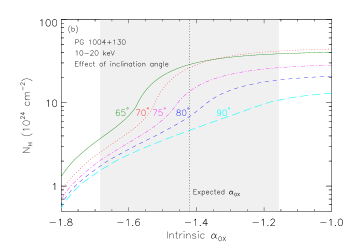
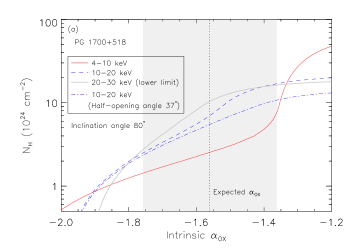
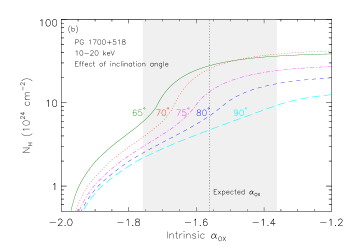
In this scenario, we can estimate the expected absorption column density for PG 1004+130 and PG 1700+518 based on the ratio of the observed broad-band X-ray flux and the expected intrinsic 20 keV flux density for a given value of (cf. Gallagher et al. 1999); to obtain this intrinsic 20 keV flux density, we determined the intrinsic 2 keV flux density using and extrapolated to 20 keV assuming a power-law spectrum with .111111The parameter has also been defined at energies higher than 2 keV (e.g., 10 keV; Young et al. 2010). The – relation with defined at 2 keV has a relatively small dispersion due to the small errors in the 2 keV flux measurements, and it is therefore adopted here. The intrinsic 20 keV flux density predicted with defined at 10 keV would lead to consistent results within the errors. The relation between this observed ratio and the column density was calibrated using the MYTorus model (Murphy & Yaqoob, 2009)121212See http://www.mytorus.com/ for details. implemented in XSPEC. The MYTorus model computes the transmitted and scattered X-ray spectra from a toroidal-shaped absorber/reprocessor in a physical and self-consistent way, and it was designed to model X-ray spectra in the Compton-thick regime. The model was calculated for neutral material. However, for our purpose of constraining the basic absorption column density in these BAL quasars, the model is likely also applicable to ionized material, as high-energy X-ray attenuation is dominated by Compton scattering (not photoelectric absorption) in the Compton-thick regime. Two important geometrical parameters of the MYTorus model are the half-opening angle of the obscuring medium and the inclination angle (0° corresponds to a face-on viewing angle). The default half-opening angle was set to 60° (corresponding to a covering factor of 0.5), and we assumed an inclination angle of 80° (large inclination angles are generally expected for BAL quasars; see Section 1.1). We also explored the effects of different inclination angles and a different geometry with a half-opening angle of 37° (corresponding to a covering factor of 0.8). The other parameters of the model, such as the relative cross-normalization factors of different components, were set as the default values (see Section 8.2 of the MYTorus manual).
We derived column-density constraints using the NuSTAR fluxes in three bands, 4–10 keV, 10–20 keV, and 20–30 keV (see Table 2), under a range of assumed values. Since neither object is detected in the 20–30 keV band, the column densities constrained in this band are 90% confidence-level lower limits. The results are displayed in Figures 7 and 8. The harder bands (e.g., 10–20 keV) probed by NuSTAR generally provide much tighter constraints than the softer bands (e.g., 4–10 keV).131313The column density inferred from the 4–10 keV data is smaller than the 10–20 keV one, indicating that the X-ray weakness is less prominent in the 4–10 keV band and the observed spectral shape differs from the one predicted by the MYTorus model. This is probably due to additional 4–10 keV continuum emission from a jet (for radio-loud objects) or a scattering medium. The different geometric assumptions (half-opening angle and inclination angle) also affect the results somewhat. Note that the highest column density available in the MYTorus model is cm-2, and thus any constraint above this value was derived from extrapolation and may have a large uncertainty. Nevertheless, Compton-thick absorption appears required for any typical assumption about the intrinsic value. For the values expected from the – relation (see Section 3), shown as the vertical dotted lines in Figures 7 and 8, the 10–20 keV NuSTAR data indicate cm-2 for PG 1004+130 and cm-2 for PG 1700+518, for a half-opening angle of 60° and an inclination angle of 80°. These column densities correspond to Thomson optical depths of . The uncertainty of the estimated was determined from the scatter in the expected value which is much more significant than the uncertainty of the observed flux. At cm-2, the observed spectrum computed from the MYTorus model is completely dominated by the scattered component; it appears flat with a high-energy hump peaking around observed-frame 20 keV (e.g., see Figure 6.1 of the MYTorus manual), and the observed 10–20 keV flux is absorbed by a factor of .
The parameterization of the MYTorus model cannot, of course, fully reproduce the complex absorption environments of these BAL quasars, but we consider it to be the best available approximation for the purpose of deriving basic column-density constraints. If the observed X-ray emission has contributions from additional continuum components that were not considered in the MYTorus modeling, our estimation of the column density above would likely be an underestimate as the scattered/reflected component associated with the absorber would be weaker than the observed emission. Examples of possible additional X-ray components include jet emission and the nuclear continuum scattered by a large-scale medium; see Section 4.1.3 below for details.
4.1.2 Physical Implications of Compton-thick Absorption
In the disk-wind scenario for BAL quasars, the outflowing wind is mainly radiatively driven by UV line pressure. In some models (e.g., Murray et al., 1995; Proga et al., 2000), the UV radiation originates from the center of the AGN and is filtered by the X-ray shielding gas. This assumption requires the shielding gas not be Compton thick; otherwise, the UV radiation would also be blocked and the wind would lose its driving force. In other models (e.g., Proga & Kallman, 2004), this assumption is relaxed, and the UV radiation is allowed to be produced exterior to the shielding gas (e.g., see Figure 1); our finding of potential Compton-thick absorption in these two BAL quasars supports this latter geometry. Given the surface-temperature distribution of a standard accretion disk (Shakura & Sunyaev, 1973), the radius of the disk region that emits most strongly in the UV can be estimated as
| (2) |
where is the accretion efficiency and is the accretion rate in units of the Eddington accretion rate (Eddington ratio). The black-hole masses () for PG 1004+130 and PG 1700+518 are (Vestergaard & Peterson, 2006) and (Peterson et al., 2004), respectively (the radius does not depend strongly on the black-hole mass, and thus the uncertainty on the mass estimate does not affect the derived compactness of the absorber significantly). Their bolometric luminosities can be calculated using the normalized Elvis et al. (1994) or Richards et al. (2006) composite SEDs in Figure 5, and they are erg s-1 for PG 1004+130 and erg s-1 for PG 1700+518. The Eddington ratios are then for PG 1004+130 and for PG 1700+518. The derived UV-emitting radii are ( cm) for PG 1004+130 and ( cm) for PG 1700+518, where is the Schwarzschild radius. Therefore, Compton-thick absorption constrains the absorbing medium (i.e., shielding gas) to be compact, located within cm of the SMBH. Recent microlensing studies (e.g., Pooley et al., 2007; Blackburne et al., 2011; Jiménez-Vicente et al., 2012) suggest that the optical/UV emitting regions of quasar accretion disks are –30 times larger than those predicted from the standard accretion-disk model, and thus the above constraint on the compactness of the absorbing medium could be relaxed.
PG 1004+130 is a radio-loud quasar. Under the assumption that its intrinsic X-ray emission is normal, most ( based on its radio loudness) of its X-ray emission should come from the radio jets (see Section 4 of Miller et al., 2011). The observed X-ray weakness thus implies that the jet emission is also heavily absorbed. Based on an X-ray survey of 21 radio-loud BAL quasars, Miller et al. (2009) concluded that jet emission is likely partially absorbed in these objects. Therefore, it is possible that the underlying jet emission of PG 1004+130 is mostly absorbed by the same Compton-thick material (i.e., the shielding gas) that blocks the other nuclear X-ray emission. The observed X-ray spectra may even be dominated by the unobscured portion of the jet emission if the nuclear emission is strongly absorbed. Such a jet-dominated X-ray spectrum can explain the soft spectral shape (; see Section 2.2) observed that is consistent with those for radio-loud quasars, and it may also be responsible for the nondetection of the Fe K line (see details below).
4.1.3 Dilution of Fe K Line Emission in PG 1004+130 by Jet-Linked X-rays?
For a Compton-thick AGN with obscuration by neutral matter, a strong narrow Fe K emission line at 6.4 keV with an EW of order 1–2 keV is expected if the continuum is reflection dominated (e.g., Ghisellini et al., 1994; Matt et al., 1996). A strong Fe K line is observed in the majority of the known Compton-thick AGN population (e.g., Turner et al., 1997; Bassani et al., 1999; Comastri, 2004; LaMassa et al., 2011). There is no Fe K line detected in the spectra of PG 1004+130; the upper limit on the EW is eV (see Section 2.2). For PG 1700+518, no Fe K line is detected either, though the XMM-Newton spectrum cannot constrain an upper limit due to the dominating high background at high energies, which prevents even a detection of the continuum in the Fe K band (Ballo et al., 2011). Therefore, PG 1004+130 appears to be an unusual Compton-thick AGN without a strong Fe K line.
However, PG 1004+130 is a luminous radio-loud type 1 BAL quasar, and the physical nature (e.g., location, geometry, and ionization state) of Compton-thick absorption in such objects might differ from those in local type 2 Seyfert galaxies. One plausible cause for PG 1004+130 lacking a strong Fe K line is that the line is diluted by a jet-linked X-ray continuum which could dominate over the scattered/reflected nuclear continuum (cf. Miller et al. 2006). Jet dilution of the Fe K line has been observed in the general population of radio-loud AGNs (e.g., Eracleous et al., 2000; Grandi et al., 2006). In the Compton-thick regime, the Fe K line flux drops rapidly (although the line EW increases) when increases, especially at large inclination angles (e.g., Yaqoob et al., 2010). Therefore, the EW of the Fe K line could be reduced substantially by any increase of the continuum level. Utilizing the MYTorus model above including the default Fe K emission-line component and assuming cm-2, we estimated that (the fraction that would make PG 1004+130 times X-ray weaker than expected; see Section 3) of the intrinsic jet continuum that is not absorbed could dilute the EW of the Fe K line from keV to eV. If the covering factor of the shielding gas is smaller than the MYTorus default value (0.5), which is likely the case given the small covering factor of the disk wind (; see Section 1.1), the EW of the Fe K line could be even smaller (e.g., Ikeda et al., 2009). We caution that with the dilution from the jet emission, the column density estimated in Section 4.1.1 is likely a lower limit.
For completeness, we mention below a few additional possible explanations for the lack of a strong Fe K line from PG 1004+130, which might also be applicable for other BAL quasars.
-
1.
The strong Fe K line could be diluted by the scattered continuum from a highly ionized Compton-thin medium that surrounds the SMBH on a larger scale than the Compton-thick material (e.g., Murphy, 2009; Yaqoob & Murphy, 2009).141414Also see the presentation at http://cxc.harvard.edu/ChandraDecade/pro-ceedings/session_13.html#talk57. We note that the scattering geometry in the X-ray may differ significantly from that studied spectropolarimetrically in the optical (e.g., the broad emission-line region or the shielding gas itself could be responsible for the scattered light seen in the optical; Ogle et al. 1999; Schmidt & Hines 1999; Young et al. 2007). The scattering medium must be highly ionized so that there is no strong Fe K line produced in the scattering process (see more discussion about ionization state in point 2 below). In the disk-wind model of BAL quasars, the Compton-thin scattering medium could be the hot low-density outflow in the polar region (e.g., Proga & Kallman, 2004), although the column density and covering factor of the outflow shown in the simulation results of Proga & Kallman (2004) are probably insufficient to produce the scattering fraction for diluting the line EW to the eV level, and the simulations were not designed for radio-loud objects with jets (such as PG 1004+130) either. With such continuum dilution, the column density estimated in Section 4.1.1 is again likely a lower limit.
-
2.
The strength and centroid energy of the Fe K line depend on the ionization state of the scattering/reflecting medium (e.g., Matt et al., 1993; Ross et al., 1996; Kallman et al., 2004; Ross & Fabian, 2005; García et al., 2011). As the ionization parameter () increases, the EW of the line generally decreases and the centroid energy increases; for a highly ionized medium (), the EW of the Fe K line can drop below 100 eV (e.g., García et al., 2011). In the disk-wind model of BAL quasars, the scattering/reflecting medium is the shielding gas at the base of the disk wind, and it is likely ionized and could be highly ionized with –6 (e.g., Proga & Kallman, 2004).151515Given the ionizing luminosity estimated from the intrinsic SED (Figure 5a), the location of the absorber ( cm), the estimated column density ( cm-2), and an assumed size of the absorber ( cm), we estimated the ionization parameter to be ; this is likely an overestimate, as we neglected the effects of Compton scattering in the estimate and also the absorber could be located further out. Therefore, a BAL quasar may be Compton-thick but without a strong Fe K line due to highly ionized Compton-thick absorption, although it would appear difficult to ionize highly a Compton-thick medium due to the effects of Compton scattering (e.g., see Section 3 of Schurch et al. 2009).
-
3.
The strong narrow Fe K line could be affected by line broadening (or smeared out in the extreme case) if the absorber/reflector has outflow motion and consists of multiple velocity components. While the kinematics of the X-ray absorbing component of the disk wind are still uncertain, broadening and shifting of the Fe K emission line has perhaps been seen in BAL quasars (e.g., Oshima et al., 2001; Chartas et al., 2007; Sim et al., 2012).
We consider these explanations less likely than jet-linked dilution but still possible.
Of course, it is also possible that PG 1004+130 is not Compton-thick and thus does not have a prominent Fe K line feature. In this case, it would not produce X-ray emission as typical quasars do and would be intrinsically X-ray weak, as discussed in the next subsection.
4.2. Intrinsic X-ray Weakness?
4.2.1 Intrinsic X-ray Weakness in BAL Quasars and Physical Implications
PG 1004+130 and PG 1700+518 could also be intrinsically X-ray weak. A small fraction of quasars have been suggested to be intrinsically X-ray weak (e.g., Gallagher et al., 2001; Sabra & Hamann, 2001; Leighly et al., 2007b; Wu et al., 2011; Miniutti et al., 2012). One of the best-studied cases is the narrow-line type 1 quasar PHL 1811, which is rapidly X-ray variable by a high amplitude but always appears X-ray weak and shows no evidence for intrinsic X-ray absorption (Leighly et al., 2007b). A systematic survey for such intrinsically X-ray weak quasars demonstrated that these objects are rare in optically selected (non-BAL) quasar samples; the fraction of SDSS quasars with is (Gibson et al., 2008a).
Many BAL quasars are X-ray weak due to absorption (see Section 1.1), and thus they are often excluded in searches for intrinsically X-ray weak quasars (e.g., Gibson et al., 2008a; Wu et al., 2011). However, intrinsic X-ray weakness is in fact an attractive possibility to account for the BAL nature in the disk-wind scenario. As introduced in Section 1.1, to launch successfully a wind through the UV line-driving mechanism, the soft X-ray emission from the nucleus must be shielded to prevent the wind from being overionized. If the nucleus were incapable of producing strong X-ray emission, the wind could be launched with little/no shielding, and then a BAL quasar would be observed if the viewing angle were appropriate. It is clear that some BAL quasars do emit X-rays at a nominal level as their X-ray fluxes recover to expected levels after absorption corrections (see Section 1.1). However, there are other BAL quasars, including PG 1004+130 and PG 1700+518, that still appear X-ray weak after basic absorption corrections; these are candidates for being intrinsically X-ray weak quasars.
The nature of intrinsic X-ray weakness remains unclear. Possible explanations generally invoke mechanisms that weaken or destroy the X-ray emitting accretion-disk corona (see, e.g., the discussions in Leighly et al. 2007b and Miniutti et al. 2012). One specific mechanism relevant to BAL quasars was proposed by Proga (2005), who suggested that part of the accretion-disk outflow (i.e., a dense, highly ionized “failed wind” produced by overionization) could fall into (see Figure 1 for the velocity field) the corona and thereby suppress its X-ray emission. With the presence of dense gas from the outflow, the coronal magnetic field becomes insufficient to liberate and transport energy from the disk to heat the corona via magnetized bubbles, and also relativistic electrons in the corona will cool efficiently via bremsstrahlung instead of inverse-Compton radiation (bremsstrahlung is less effective in making hard X-rays). We caution that the natures of both the “failed wind” and the corona remain uncertain, and therefore there are inevitable uncertainties associated with the interaction of these two components
Considering the modeled dynamical nature of the outflow (e.g., Proga et al., 2000) and the above coronal-quenching model, we suggest that there may even be a cyclical mechanism that switches on/off the coronal X-ray emission: after the quenching of the coronal X-ray emission, the wind can be successfully launched and there will be no “failed wind” falling into the corona; the corona thus recovers to a standard X-ray emitting mode, and overionizes the inner portion of wind which will then again fall into the corona and suppress its X-ray emission. The outflow is expected to settle down to a steady state over a timescale of years (e.g., Proga et al., 2000), and thus we might expect the above mechanism to operate over a timescale of years or longer. Such a cyclical mechanism could be used to explain why some BAL quasars are X-ray normal (after absorption corrections) and some are perhaps intrinsically X-ray weak, and it may be responsible for the significant X-ray flux and spectral variability observed in some BAL quasars (e.g., PG 2112+059; Gallagher et al., 2004). If BAL winds exist in all/most quasars, such a mechanism could also be responsible for the strong X-ray variability seen from some non-BAL quasars when they have entered X-ray weak states due to quenched coronal emission (e.g., PHL 1092; Miniutti et al., 2012).
PG 1004+130 and PG 1700+518 appear to have some intrinsic X-ray absorption regardless of whether they are intrinsically X-ray weak. For PG 1004+130, the column density derived from spectral modeling is cm-2 (see Section 2.2). For PG 1700+518, the XMM-Newton data reveal a column density of a few cm-2 (Ballo et al., 2011); significant absorption is also indicated by the small effective photon index () derived using the NuSTAR band ratio (see Section 2.1). Within the above coronal-quenching mechanism, the apparent absorption could still be attributed to the shielding gas in BAL quasars as there may be a period when the coronal X-ray emission is quenched while the shielding gas has not fully disappeared. The values of are both for these two BAL quasars after corrections for apparent absorption (Miller et al., 2006; Ballo et al., 2011), indicating that they are times intrinsically X-ray weaker than expected. Intrinsic X-ray weakness would naturally explain the lack of a strong Fe K line in PG 1004+130, as the observed X-ray spectra are not scattering/reflection dominated. For the radio-loud object, PG 1004+130, the intrinsic X-ray weakness scenario implies that the radio jet does not produce X-ray emission at a nominal level either ( times weaker). Although unusual, a small fraction of radio-loud quasars appear to be providing little/no excess X-ray emission compared to their radio-quiet counterparts (see, e.g., Figure 7 of Miller et al., 2011). The likely large inclination angle of PG 1004+130 (; e.g., Wills et al. 1999; Miller et al. 2006) could be one factor that reduces the observed X-ray emission compared to other radio-loud quasars due to a lack of relativistic beaming.
4.2.2 Intrinsic X-ray Weakness and Emission-Line Properties
Intrinsic X-ray weakness in quasars may affect the appearance of the optical–UV emission lines by modifying the photoionization properties of the emission-line region. PHL 1811, for example, has unusual line emission: its high-ionization lines (e.g., C IV and Si IV ) are very weak, there is no evidence for forbidden or semiforbidden lines (e.g., [O III] ), and the Fe II and Fe III pseudo-continuum in the near-UV is very strong (Leighly et al., 2007a). The PHL 1811 analogs investigated by Wu et al. (2011) have similar emission-line properties and are also X-ray weak quasar candidates. Such unusual emission lines can probably be attributed to a soft ionizing continuum (UV nominal but X-ray weak; e.g., Leighly et al. 2007a). For PG 1004+130 and PG 1700+518, the C IV and Si IV lines are strongly absorbed due to their BAL nature (e.g., Wills et al., 1999; Brandt et al., 2000), rendering reliable line-strength measurements impossible. PG 1004+130 shows normal [O III] emission; PG 1700+518 is a narrow-line type 1 quasar (as for PHL 1811) and shows no visible [O III] line (e.g., Boroson & Green, 1992). Their optical emission-line properties in general do not appear unusual compared to other PG quasars when considering “Eigenvector 1” correlations (e.g., Boroson & Green, 1992; Brandt & Boller, 1998).
It is difficult to determine if PG 1004+130 and PG 1700+518 share the same usual emission-line properties as PHL 1811 when the weakness of their high-ionization lines cannot be constrained. However, even if they have generally normal line emission, the intrinsic X-ray weakness scenario may still work, based on the following consideration. For a typical quasar, the ionizing continuum is dominated by EUV emission, which is largely unobservable and is often estimated via interpolating the UV and X-ray photometric data points assuming a power-law spectrum (e.g., see the composite quasar SEDs in Figure 5; also adopted in Leighly et al. 2007a). The coronal-quenching mechanism discussed above could perhaps mainly reduce the keV X-ray emission while leaving the EUV radiation from the accretion disk largely the same. Although the significantly weakened X-ray emission would certainly affect the ionization state of the emission-line region somewhat, it is possible that the appearance of the emission lines is affected less dramatically due to ionization from EUV photons; further photoionization calculations of emission lines are required to assess this in detail.
4.2.3 Statistical Constraints on the Fraction of Intrinsically X-ray Weak BAL Quasars
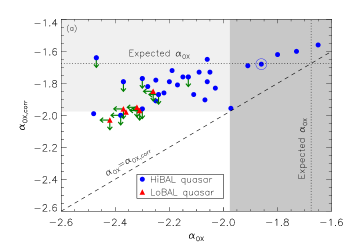
Motivated by our NuSTAR results, we derived basic statistical constraints upon the fraction of intrinsically X-ray weak BAL quasars from the relatively well-studied Large Bright Quasar Survey (LBQS) BAL quasar sample in Gallagher et al. (2006). These are distant BAL quasars at –3; at their mean redshift of , the 0.5–8 keV Chandra observations are probing the rest-frame –24 keV band, close to the hard X-ray band observed by NuSTAR. These quasars are all radio quiet except for one, and thus we do not expect significant jet-linked contributions to the X-ray emission as for the case of PG 1004+130. We searched for intrinsically X-ray weak quasar candidates in these sample sources by comparing their and (the absorption-corrected ; derived by assuming a power-law spectrum and normalizing it to the rest-frame keV continuum) values from Gallagher et al. (2006)161616We reinvestigated the source detections in the Gallagher et al. (2006) sample by running wavdetect at low significance levels and then examining the source significances with the binomial probability approach (see Equation 1). Two quasars not detected in the 2–8 keV band in Gallagher et al. (2006) were detected, and we computed their values instead of using upper limits. to the expected values derived from the Steffen et al. (2006) – relation. These quasars have a limited range of (with standard deviation dex), and thus we adopted the mean expected value () and its 90% confidence-level uncertainty (; from Figure 5 of Gibson et al. 2008a) in the comparison. We also performed the comparison by deriving and for each object individually, and we got consistent results with those below.
Figure 9a shows the vs. plot for the 35 BAL quasars in the sample. The shaded regions indicate the expected mean for this sample and its 90% uncertainty. Sources that lie near the slanted dashed line ( soft spectra, while heavily obscured or Compton-thick spectra are usually hard) and outside the shaded regions (being X-ray weak) are candidates for being intrinsically X-ray weak quasars. A significant fraction of the sources lie above the line, indicating that X-ray absorption is likely present. Only six objects have values in the expected range for typical quasars (dark-shaded region). However, after absorption corrections, 15 additional objects have values within the expected range (light-shaded region), indicating that they probably have nominal underlying X-ray emission. There are four objects below the light-shaded region (two measurements and two upper limits), and another ten in the light-shaded region have upper limits on . We consider these 14 objects as possible candidates for being intrinsically X-ray weak quasars, and thus the fraction is (i.e., ) among BAL quasars.
Such a constraint is relatively loose as 12 of the 14 candidates have only upper limits on . We performed a Chandra stacking analysis to obtain the average X-ray properties of these 12 sources (cf. Section 4.2 of Wu et al., 2011). We added the total counts and background counts of the sources extracted from EEF apertures and larger annular background regions, respectively, in the observed 0.5–2 keV (soft) and 2–8 keV (hard) bands. For each band, we computed the binomial no-source probability (see Equation 1) to determine if the stacked source is detected. Using the Portable, Interactive, Multi-Mission Simulator (PIMMS),171717http://cxc.harvard.edu/toolkit/pimms.jsp. we derived the effective photon index from the ratio between the soft-band and hard-band counts. We adopted the average values of redshift, Galactic absorption column density, and (there was only a small spread in , with standard deviation dex) to compute the and parameters ( was derived using the hard-band flux and assuming ) for this subsample.
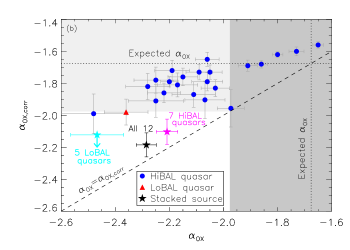
The stacking results are listed in Table 3, and the stacked data point is shown as the black star in Figure 9b. The stacked source is detected in both the soft and hard bands, with net counts of and after aperture corrections, respectively, and it has . Given the high luminosity ( erg s-1) in the soft band, the observed soft X-ray spectrum (covering rest-frame –6 keV) should have negligible contribution from any host-galaxy emission. It appears that the stacked source is a candidate for being intrinsically X-ray weak, as it is close to the slanted dashed line in the unshaded region (having a fairly soft X-ray spectrum and being X-ray weak). As a first-order estimate, we consider that about half (six) of the 12 quasars being stacked are probably softer () than the stacked signal, and the other half are harder (). All these objects are outside the dark-shaded region (X-ray weak based on ), while the six having a soft spectrum () would lie close to the = line if they could be detected individually. Therefore, we expect that at least six () of the 35 BAL quasars are candidates for being intrinsically X-ray weak. Combined with the upper limit, we constrain the fraction to be –40%. Deeper Chandra observations of these 12 objects that detect them individually could significantly narrow the estimated range of this fraction.
Among the 12 stacked objects, there are seven HiBAL and five LoBAL quasars (see Footnote 5). As LoBAL quasars are X-ray weaker than HiBAL quasars in general, we stacked these two groups separately, and the results are also shown in Table 3 and Figure 9b. The stacked signal of the 12 objects is dominated by the seven HiBAL quasars, but both of these groups of seven HiBAL quasars and five LoBAL quasars could contain intrinsically X-ray weak quasars, given their stacked X-ray properties and the positions of the stacked sources in the vs. plot.
The fraction of intrinsically X-ray weak objects among BAL quasars estimated here (–40%) is considerably larger than the fraction of intrinsically X-ray weak objects among non-BAL quasars (Gibson et al., 2008a). If non-BAL quasars also have BAL winds lying out of the line of sight (see Section 1.1), the significant difference in the fractions would suggest that intrinsically X-ray weak quasars are preferentially seen as BAL quasars. One possible scenario is that although the average covering factor of the BAL wind is (see Section 1.1), the wind in an intrinsically X-ray weak quasar has a considerably larger covering factor, as it is likely easier to launch the wind when the nuclear X-ray emission is weak. Therefore, we would tend to observe BALs preferentially in the spectra of intrinsically X-ray weak quasars.
Compared to the SDSS BAL quasar sample, the LBQS BAL quasars have somewhat higher optical luminosities (by dex on average) and stronger BAL features, and they are preferentially X-ray weaker (e.g., see Section 4.6.2 of Gibson et al. 2009). The weaker X-ray emission and stronger BAL features of LBQS BAL quasars could be related to more absorption/coronal-quenching and thus stronger radiatively driven winds. As the nature of intrinsic X-ray weakness is highly uncertain, we caution that the constraints on the fraction (–40%) derived from the LBQS sample might not be applicable to the SDSS or other BAL quasar samples, and further X-ray studies of large BAL quasar samples are required to constrain the fraction better.
5. SUMMARY, IMPLICATIONS, AND FUTURE WORK
5.1. Summary and Implications
In this paper, we have investigated the hard X-ray emission observed by NuSTAR from two optically bright BAL quasars, PG 1004+130 and PG 1700+518, and we have discussed the nature of their weak hard X-ray emission. The key points from this work are summarized below:
-
1.
PG 1004+130 and PG 1700+518 have been observed by NuSTAR with exposure times of ks and ks, respectively. PG 1004+130 was detected in both FPMs A and B, while PG 1700+518 was only detected in FPM A. The X-ray positions of both objects are in good agreement with their optical positions (), indicating the detections are reliable. See Section 2.1.
-
2.
We provided aperture-photometry results for the two targets in five NuSTAR bands: 4–10 keV, 4–20 keV, 10–20 keV, 20–30 keV, and 30–79 keV. The X-ray luminosities in the 4–20 keV band are erg s-1 for PG 1004+130 and erg s-1 for PG 1700+518. We also derived an effective power-law photon index based on the NuSTAR band ratio. PG 1004+130 is soft with , and PG 1700+518 is hard with . See Section 2.1.
-
3.
We jointly analyzed the NuSTAR and Chandra spectra for PG 1004+130. The spectra were modeled with a partial-covering absorber model. The resulting absorption is moderate, cm-2, and it is insufficient to explain the X-ray weakness of this quasar. Furthermore, it is likely that the 3–8 keV flux has decreased by a factor of in the 2012 NuSTAR observation compared to its Chandra flux in 2005. There is no Fe K emission line detected at rest-frame 6.4 keV, with an upper limit on the rest-frame EW of eV. See Section 2.2.
-
4.
We constructed radio-to-X-ray SEDs for PG 1004+130 and PG 1700+518. From the radio to the UV, the continuum SEDs of the two targets agree with composite quasar SEDs (aside from dust reddening in PG 1700+518). Besides the significant X-ray weakness around rest-frame 2 keV, these two objects also appear more than an order of magnitude less luminous than typical quasars at rest-frame 20 keV, and even the 40 keV luminosity upper limits are below expectations. This hard X-ray weakness implies that the two BAL quasars either have Compton-thick absorption or are intrinsically X-ray weak. See Section 3.
-
5.
We derived column-density constraints using the MYTorus model, under the assumption that the weak hard X-ray emission is caused by absorption. For both objects, Compton-thick absorption appears required for any typical assumption about the intrinsic value. The derived column densities are cm-2 for both BAL quasars, corresponding to Thomson optical depths of . Compton-thick absorption in the disk-wind model requires the shielding gas to be located within cm of the SMBH (assuming a standard accretion disk) to prevent blocking of the UV radiation that drives the outflowing wind. We discussed jet-linked dilution and a few other possibilities that could cause the lack of a strong Fe K line in PG 1004+130. See Section 4.1.
-
6.
We discussed an intrinsic X-ray weakness scenario that may relax the X-ray shielding requirement for launching the accretion-disk wind in BAL quasars. PG 1004+130 and PG 1700+518 are times intrinsically X-ray weaker than typical quasars under this scenario. Based on the Proga (2005) coronal-quenching model, we suggested a cyclical mechanism that could switch on/off the coronal X-ray emission and be responsible for a mix of intrinsically X-ray normal and intrinsically X-ray weak BAL quasars. Motivated by our NuSTAR results, we estimated the fraction of intrinsically X-ray weak BAL quasars to be –40% via a Chandra stacking analysis with the LBQS BAL quasar sample. See Section 4.2.
Irrespective of its cause, the hard X-ray weakness of these two BAL quasars discovered by NuSTAR has implications for the detection and characterization of AGNs in deep X-ray surveys. PG 1004+130 and PG 1700+518 are among the most optically luminous BAL quasars known at low redshift (Figure 2), and in each object substantial SMBH growth is clearly occuring. However, we expect that PG 1700+518 could not be detected in a 600 ks NuSTAR survey181818The deepest NuSTAR survey currently proposed, the NuSTAR Extended Chandra Deep Field-South survey, will have an exposure of –800 ks. if placed at . In the deepest Chandra survey to date, the 4 Ms Chandra Deep Field-South (e.g., Xue et al., 2011), PG 1700+518 would be detectable if placed at high redshifts (e.g., ), as Chandra is actually probing the hard X-ray bands at these redshifts. However, with counts detected, the Chandra data could not constrain its intrinsic spectrum accurately, and the derived X-ray properties would have a large uncertainty (e.g., the derived X-ray luminosity and the amount of SMBH growth would be an order of magnitude lower than the real values). Therefore, detection completeness and AGN characterization in deep X-ray surveys should be interpreted carefully, considering the likely existence of X-ray weak BAL and related quasars in the local and distant universe (e.g., Alexander et al., 2008; Burlon et al., 2011). In this case, a UV-excess selection of bright quasars that are X-ray weak could be utilized to search for and study the distant counterparts of PG 1004+130 and PG 1700+518.
5.2. Future Work
Given the limited data for the two targets studied here, we cannot strongly prefer the Compton-thick absorption scenario or the intrinsic X-ray weakness scenario. A NuSTAR survey of a large sample of BAL quasars showing similar X-ray weakness (i.e., being significantly X-ray weak even after corrections for apparent absorption) may help to discriminate between these two scenarios. If heavy absorption is responsible for the X-ray weakness, a continuous distribution of column densities would be expected, probably ranging from cm-2 to being significantly Compton-thick ( cm-2). If all the observed survey targets show weak hard X-ray emission like PG 1004+130 and PG 1700+518, this would indicate an unlikely scenario where we had found an isolated population of highly Compton-thick objects via soft X-ray selection, and thus we would consider that intrinsic X-ray weakness is probably the correct resolution. Alternatively, obtaining a hard X-ray spectrum for a similar object with sufficient counts that allows more detailed spectral analysis may also provide some useful constraints that would shed light on the nature of these BAL quasars.
We hypothesized a cyclical mechanism in Section 4.2.1 that could explain why some BAL quasars are intrinsically X-ray normal and others are perhaps intrinsically X-ray weak. Further numerical simulations that carefully treat the temporal evolution of the X-ray shielding gas will be required to assess this dynamical model. An X-ray variability study of a large sample of BAL quasars over a long timescale (years) may also help to assess whether BAL quasars vary between X-ray normal and X-ray weak states (see, e.g., Saez et al., 2012). This could be achieved by snapshot monitoring observations of a sample of X-ray weak BAL quasars using Chandra, XMM-Newton, and/or NuSTAR which would provide multi-epoch and large-bandpass coverage.
We estimated the fraction of intrinsically X-ray weak BAL quasars (–40%) in Section 4.2.3. This constraint could likely be tightened significantly if we could obtain Chandra hard-band (2–8 keV; –24 keV in the rest frame) flux measurements of the 12 sources with only relatively weak upper-limit information presently. These objects likely contain strong candidates for intrinsically X-ray weak quasars based on the stacking analysis. They were previously observed by Chandra with 5–7 ks exposures (Gallagher et al., 2006). It could be a useful investment to obtain additional –30 ks Chandra observations that will improve the hard-band detection limit by a factor of and detect a significant fraction of these 12 sources individually.
We acknowledge support from the California Institute of Technology (Caltech) NuSTAR subcontract 44A-1092750 (BL, WNB), NASA ADP grant NNX10AC99G (BL, WNB), the Leverhulme trust and the Science Technology and Facilities Council (DMA), Basal-CATA grant PFB-06/2007 and CONICYT-Chile grants FONDECYT 1101024 and Anillo ACT1101 (FEB), and CONICYT-Chile grant FONDECYT 3120198 (CS). We thank M. Young for help with the planning of this project and K. Forster for help with the NuSTAR data access, and we thank M. Balokovic, K. Boydstun, T. N. Lu, B. P. Miller, Jianfeng Wu, and T. Yaqoob for helpful discussions. We thank the referee, S. C. Gallagher, for carefully reviewing the manuscript and providing helpful comments.
This work was supported under NASA Contract No. NNG08FD60C, and made use of data from the NuSTAR mission, a project led by Caltech, managed by the Jet Propulsion Laboratory, and funded by the National Aeronautics and Space Administration. We thank the NuSTAR Operations, Software and Calibration teams for support with the execution and analysis of these observations. This research has made use of NuSTARDAS jointly developed by the ASI Science Data Center (ASDC, Italy) and Caltech (USA).
References
- Abazajian et al. (2009) Abazajian, K. N., Adelman-McCarthy, J. K., Agüeros, M. A., et al. 2009, ApJS, 182, 543
- Alexander et al. (2008) Alexander, D. M., Chary, R.-R., Pope, A., et al. 2008, ApJ, 687, 835
- Allen et al. (2011) Allen, J. T., Hewett, P. C., Maddox, N., Richards, G. T., & Belokurov, V. 2011, MNRAS, 410, 860
- Anders & Grevesse (1989) Anders, E., & Grevesse, N. 1989, Geochim. Cosmochim. Acta, 53, 197
- Arnaud (1996) Arnaud, K. A. 1996, in ASP Conf. Ser., Vol. 101, Astronomical Data Analysis Software and Systems V, ed. G. H. Jacoby & J. Barnes, 17
- Ballo et al. (2011) Ballo, L., Piconcelli, E., Vignali, C., & Schartel, N. 2011, MNRAS, 415, 2600
- Balucinska-Church & McCammon (1992) Balucinska-Church, M., & McCammon, D. 1992, ApJ, 400, 699
- Bassani et al. (1999) Bassani, L., Dadina, M., Maiolino, R., et al. 1999, ApJS, 121, 473
- Becker et al. (2000) Becker, R. H., White, R. L., Gregg, M. D., et al. 2000, ApJ, 538, 72
- Blackburne et al. (2011) Blackburne, J. A., Pooley, D., Rappaport, S., & Schechter, P. L. 2011, ApJ, 729, 34
- Borguet et al. (2013) Borguet, B. C. J., Arav, N., Edmonds, D., Chamberlain, C., & Benn, C. 2013, ApJ, 762, 49
- Boroson & Green (1992) Boroson, T. A., & Green, R. F. 1992, ApJS, 80, 109
- Braito et al. (2004) Braito, V., Della Ceca, R., Piconcelli, E., et al. 2004, A&A, 420, 79
- Brandt & Boller (1998) Brandt, N., & Boller, T. 1998, Astronomische Nachrichten, 319, 7
- Brandt et al. (2000) Brandt, W. N., Laor, A., & Wills, B. J. 2000, ApJ, 528, 637
- Broos et al. (2007) Broos, P. S., Feigelson, E. D., Townsley, L. K., et al. 2007, ApJS, 169, 353
- Brotherton et al. (2001) Brotherton, M. S., Arav, N., Becker, R. H., et al. 2001, ApJ, 546, 134
- Burlon et al. (2011) Burlon, D., Ajello, M., Greiner, J., et al. 2011, ApJ, 728, 58
- Calzetti et al. (2000) Calzetti, D., Armus, L., Bohlin, R. C., Kinney, A. L., Koornneef, J., & Storchi-Bergmann, T. 2000, ApJ, 533, 682
- Capellupo et al. (2011) Capellupo, D. M., Hamann, F., Shields, J. C., Rodríguez Hidalgo, P., & Barlow, T. A. 2011, MNRAS, 413, 908
- Capellupo et al. (2012) —. 2012, MNRAS, 422, 3249
- Chartas et al. (2007) Chartas, G., Eracleous, M., Dai, X., Agol, E., & Gallagher, S. 2007, ApJ, 661, 678
- Chartas et al. (2009) Chartas, G., Saez, C., Brandt, W. N., Giustini, M., & Garmire, G. P. 2009, ApJ, 706, 644
- Clavel et al. (2006) Clavel, J., Schartel, N., & Tomas, L. 2006, A&A, 446, 439
- Comastri (2004) Comastri, A. 2004, in Astrophysics and Space Science Library, Vol. 308, Supermassive Black Holes in the Distant Universe, ed. A. J. Barger, 245
- Condon et al. (1998) Condon, J. J., Cotton, W. D., Greisen, E. W., et al. 1998, AJ, 115, 1693
- Crenshaw et al. (1999) Crenshaw, D. M., Kraemer, S. B., Boggess, A., Maran, S. P., Mushotzky, R. F., & Wu, C.-C. 1999, ApJ, 516, 750
- Di Matteo et al. (2005) Di Matteo, T., Springel, V., & Hernquist, L. 2005, Nature, 433, 604
- Dickey & Lockman (1990) Dickey, J. M., & Lockman, F. J. 1990, ARA&A, 28, 215
- DiPompeo et al. (2013) DiPompeo, M. A., Brotherton, M. S., & De Breuck, C. 2013, MNRAS, 428, 1565
- Elvis & Fabbiano (1984) Elvis, M., & Fabbiano, G. 1984, ApJ, 280, 91
- Elvis et al. (2012) Elvis, M., Hao, H., Civano, F., et al. 2012, ApJ, 759, 6
- Elvis et al. (1994) Elvis, M., Wilkes, B. J., McDowell, J. C., et al. 1994, ApJS, 95, 1
- Emmering et al. (1992) Emmering, R. T., Blandford, R. D., & Shlosman, I. 1992, ApJ, 385, 460
- Eracleous et al. (2000) Eracleous, M., Sambruna, R., & Mushotzky, R. F. 2000, ApJ, 537, 654
- Evans & Koratkar (2004) Evans, I. N., & Koratkar, A. P. 2004, ApJS, 150, 73
- Fan et al. (2009) Fan, L. L., Wang, H. Y., Wang, T., et al. 2009, ApJ, 690, 1006
- Filiz Ak et al. (2012) Filiz Ak, N., Brandt, W. N., Hall, P. B., et al. 2012, ApJ, 757, 114
- Freeman et al. (2002) Freeman, P. E., Kashyap, V., Rosner, R., & Lamb, D. Q. 2002, ApJS, 138, 185
- Gallagher et al. (2002) Gallagher, S. C., Brandt, W. N., Chartas, G., & Garmire, G. P. 2002, ApJ, 567, 37
- Gallagher et al. (2006) Gallagher, S. C., Brandt, W. N., Chartas, G., et al. 2006, ApJ, 644, 709
- Gallagher et al. (2001) Gallagher, S. C., Brandt, W. N., Laor, A., et al. 2001, ApJ, 546, 795
- Gallagher et al. (1999) Gallagher, S. C., Brandt, W. N., Sambruna, R. M., Mathur, S., & Yamasaki, N. 1999, ApJ, 519, 549
- Gallagher et al. (2004) Gallagher, S. C., Brandt, W. N., Wills, B. J., et al. 2004, ApJ, 603, 425
- Gallagher et al. (2007) Gallagher, S. C., Hines, D. C., Blaylock, M., et al. 2007, ApJ, 665, 157
- Ganguly & Brotherton (2008) Ganguly, R., & Brotherton, M. S. 2008, ApJ, 672, 102
- García et al. (2011) García, J., Kallman, T. R., & Mushotzky, R. F. 2011, ApJ, 731, 131
- Garmire et al. (2003) Garmire, G. P., Bautz, M. W., Ford, P. G., Nousek, J. A., & Ricker, Jr., G. R. 2003, Proc. SPIE, 4851, 28
- Gehrels (1986) Gehrels, N. 1986, ApJ, 303, 336
- Ghisellini et al. (1994) Ghisellini, G., Haardt, F., & Matt, G. 1994, MNRAS, 267, 743
- Gibson et al. (2010) Gibson, R. R., Brandt, W. N., Gallagher, S. C., Hewett, P. C., & Schneider, D. P. 2010, ApJ, 713, 220
- Gibson et al. (2008a) Gibson, R. R., Brandt, W. N., & Schneider, D. P. 2008a, ApJ, 685, 773
- Gibson et al. (2008b) Gibson, R. R., Brandt, W. N., Schneider, D. P., & Gallagher, S. C. 2008b, ApJ, 675, 985
- Gibson et al. (2009) Gibson, R. R., Jiang, L., Brandt, W. N., et al. 2009, ApJ, 692, 758
- Giustini et al. (2008) Giustini, M., Cappi, M., & Vignali, C. 2008, A&A, 491, 425
- Grandi et al. (2006) Grandi, P., Malaguti, G., & Fiocchi, M. 2006, ApJ, 642, 113
- Green et al. (2001) Green, P. J., Aldcroft, T. L., Mathur, S., Wilkes, B. J., & Elvis, M. 2001, ApJ, 558, 109
- Gregg et al. (2006) Gregg, M. D., Becker, R. H., & de Vries, W. 2006, ApJ, 641, 210
- Grupe et al. (2003) Grupe, D., Mathur, S., & Elvis, M. 2003, AJ, 126, 1159
- Gültekin et al. (2009) Gültekin, K., Richstone, D. O., Gebhardt, K., et al. 2009, ApJ, 698, 198
- Guyon et al. (2006) Guyon, O., Sanders, D. B., & Stockton, A. 2006, ApJS, 166, 89
- Haas et al. (2003) Haas, M., Klaas, U., Müller, S. A. H., et al. 2003, A&A, 402, 87
- Harrison et al. (2013) Harrison, F. A., Craig, W. W., Christensen, F. E., et al. 2013, ApJ, 770, 103
- Hewett & Foltz (2003) Hewett, P. C., & Foltz, C. B. 2003, AJ, 125, 1784
- Ikeda et al. (2009) Ikeda, S., Awaki, H., & Terashima, Y. 2009, ApJ, 692, 608
- Jiménez-Vicente et al. (2012) Jiménez-Vicente, J., Mediavilla, E., Muñoz, J. A., & Kochanek, C. S. 2012, ApJ, 751, 106
- Just et al. (2007) Just, D. W., Brandt, W. N., Shemmer, O., et al. 2007, ApJ, 665, 1004
- Kallman et al. (2004) Kallman, T. R., Palmeri, P., Bautista, M. A., Mendoza, C., & Krolik, J. H. 2004, ApJS, 155, 675
- Komatsu et al. (2011) Komatsu, E., Smith, K. M., Dunkley, J., et al. 2011, ApJS, 192, 18
- Konigl & Kartje (1994) Konigl, A., & Kartje, J. F. 1994, ApJ, 434, 446
- Kraft et al. (1991) Kraft, R. P., Burrows, D. N., & Nousek, J. A. 1991, ApJ, 374, 344
- LaMassa et al. (2011) LaMassa, S. M., Heckman, T. M., Ptak, A., et al. 2011, ApJ, 729, 52
- Laor & Brandt (2002) Laor, A., & Brandt, W. N. 2002, ApJ, 569, 641
- Laor et al. (1997) Laor, A., Fiore, F., Elvis, M., Wilkes, B. J., & McDowell, J. C. 1997, ApJ, 477, 93
- Lazarova et al. (2012) Lazarova, M. S., Canalizo, G., Lacy, M., & Sajina, A. 2012, ApJ, 755, 29
- Leighly et al. (2007a) Leighly, K. M., Halpern, J. P., Jenkins, E. B., & Casebeer, D. 2007a, ApJS, 173, 1
- Leighly et al. (2007b) Leighly, K. M., Halpern, J. P., Jenkins, E. B., et al. 2007b, ApJ, 663, 103
- Luo et al. (2013) Luo, B., Fabbiano, G., Strader, J., et al. 2013, ApJS, 204, 14
- Lusso et al. (2010) Lusso, E., Comastri, A., Vignali, C., et al. 2010, A&A, 512, A34
- Lynds (1967) Lynds, C. R. 1967, ApJ, 147, 396
- Lyons (1991) Lyons, L. 1991, Data Analysis for Physical Science Students (Cambridge: Cambridge Univ. Press)
- Martin et al. (2005) Martin, D. C., Fanson, J., Schiminovich, D., et al. 2005, ApJ, 619, L1
- Mathur et al. (2000) Mathur, S., Green, P. J., Arav, N., et al. 2000, ApJ, 533, L79
- Matt et al. (1996) Matt, G., Brandt, W. N., & Fabian, A. C. 1996, MNRAS, 280, 823
- Matt et al. (1993) Matt, G., Fabian, A. C., & Ross, R. R. 1993, MNRAS, 262, 179
- Miller et al. (2006) Miller, B. P., Brandt, W. N., Gallagher, S. C., et al. 2006, ApJ, 652, 163
- Miller et al. (2009) Miller, B. P., Brandt, W. N., Gibson, R. R., Garmire, G. P., & Shemmer, O. 2009, ApJ, 702, 911
- Miller et al. (2011) Miller, B. P., Brandt, W. N., Schneider, D. P., et al. 2011, ApJ, 726, 20
- Miniutti et al. (2012) Miniutti, G., Brandt, W. N., Schneider, D. P., et al. 2012, MNRAS, 425, 1718
- Murphy (2009) Murphy, K. 2009, PhD thesis, The Johns Hopkins University
- Murphy & Yaqoob (2009) Murphy, K. D., & Yaqoob, T. 2009, MNRAS, 397, 1549
- Murray et al. (1995) Murray, N., Chiang, J., Grossman, S. A., & Voit, G. M. 1995, ApJ, 451, 498
- Neugebauer et al. (1987) Neugebauer, G., Green, R. F., Matthews, K., et al. 1987, ApJS, 63, 615
- Neugebauer et al. (1979) Neugebauer, G., Oke, J. B., Becklin, E. E., & Matthews, K. 1979, ApJ, 230, 79
- Ogle et al. (1999) Ogle, P. M., Cohen, M. H., Miller, J. S., et al. 1999, ApJS, 125, 1
- Oshima et al. (2001) Oshima, T., Mitsuda, K., Fujimoto, R., et al. 2001, ApJ, 563, L103
- Page et al. (2005) Page, K. L., Reeves, J. N., O’Brien, P. T., & Turner, M. J. L. 2005, MNRAS, 364, 195
- Peterson et al. (2004) Peterson, B. M., Ferrarese, L., Gilbert, K. M., et al. 2004, ApJ, 613, 682
- Pettini & Boksenberg (1985) Pettini, M., & Boksenberg, A. 1985, ApJ, 294, L73
- Piconcelli et al. (2013) Piconcelli, E., Miniutti, G., Ranalli, P., et al. 2013, MNRAS, 428, 1185
- Pooley et al. (2007) Pooley, D., Blackburne, J. A., Rappaport, S., & Schechter, P. L. 2007, ApJ, 661, 19
- Proga (2005) Proga, D. 2005, ApJ, 630, L9
- Proga & Kallman (2004) Proga, D., & Kallman, T. R. 2004, ApJ, 616, 688
- Proga et al. (2000) Proga, D., Stone, J. M., & Kallman, T. R. 2000, ApJ, 543, 686
- Reeves et al. (1997) Reeves, J. N., Turner, M. J. L., Ohashi, T., & Kii, T. 1997, MNRAS, 292, 468
- Reynolds (1997) Reynolds, C. S. 1997, MNRAS, 286, 513
- Richards et al. (2006) Richards, G. T., Lacy, M., Storrie-Lombardi, L. J., et al. 2006, ApJS, 166, 470
- Ross & Fabian (2005) Ross, R. R., & Fabian, A. C. 2005, MNRAS, 358, 211
- Ross et al. (1996) Ross, R. R., Fabian, A. C., & Brandt, W. N. 1996, MNRAS, 278, 1082
- Rupke & Veilleux (2013) Rupke, D. S. N., & Veilleux, S. 2013, ApJ, 768, 75
- Sabra & Hamann (2001) Sabra, B. M., & Hamann, F. 2001, ApJ, 563, 555
- Saez et al. (2012) Saez, C., Brandt, W. N., Gallagher, S. C., Bauer, F. E., & Garmire, G. P. 2012, ApJ, 759, 42
- Schartel et al. (2005) Schartel, N., Rodríguez-Pascual, P. M., Santos-Lleó, M., et al. 2005, A&A, 433, 455
- Schmidt & Hines (1999) Schmidt, G. D., & Hines, D. C. 1999, ApJ, 512, 125
- Schmidt & Green (1983) Schmidt, M., & Green, R. F. 1983, ApJ, 269, 352
- Schneider et al. (2010) Schneider, D. P., Richards, G. T., Hall, P. B., et al. 2010, AJ, 139, 2360
- Schurch et al. (2009) Schurch, N. J., Done, C., & Proga, D. 2009, ApJ, 694, 1
- Scott et al. (2011) Scott, A. E., Stewart, G. C., Mateos, S., et al. 2011, MNRAS, 417, 992
- Serjeant & Hatziminaoglou (2009) Serjeant, S., & Hatziminaoglou, E. 2009, MNRAS, 397, 265
- Shakura & Sunyaev (1973) Shakura, N. I., & Sunyaev, R. A. 1973, A&A, 24, 337
- Shang et al. (2011) Shang, Z., Brotherton, M. S., Wills, B. J., et al. 2011, ApJS, 196, 2
- Shankar et al. (2008) Shankar, F., Dai, X., & Sivakoff, G. R. 2008, ApJ, 687, 859
- Shemmer et al. (2005) Shemmer, O., Brandt, W. N., Gallagher, S. C., et al. 2005, AJ, 130, 2522
- Shemmer et al. (2008) Shemmer, O., Brandt, W. N., Netzer, H., Maiolino, R., & Kaspi, S. 2008, ApJ, 682, 81
- Sim et al. (2012) Sim, S. A., Proga, D., Kurosawa, R., et al. 2012, MNRAS, 426, 2859
- Sim et al. (2010) Sim, S. A., Proga, D., Miller, L., Long, K. S., & Turner, T. J. 2010, MNRAS, 408, 1396
- Skrutskie et al. (2006) Skrutskie, M. F., Cutri, R. M., Stiening, R., et al. 2006, AJ, 131, 1163
- Sprayberry & Foltz (1992) Sprayberry, D., & Foltz, C. B. 1992, ApJ, 390, 39
- Steffen et al. (2006) Steffen, A. T., Strateva, I., Brandt, W. N., et al. 2006, AJ, 131, 2826
- Sturm et al. (2011) Sturm, E., González-Alfonso, E., Veilleux, S., et al. 2011, ApJ, 733, L16
- Trump et al. (2006) Trump, J. R., et al. 2006, ApJS, 165, 1
- Turner et al. (1997) Turner, T. J., George, I. M., Nandra, K., & Mushotzky, R. F. 1997, ApJ, 488, 164
- Vanden Berk et al. (2001) Vanden Berk, D. E., Richards, G. T., Bauer, A., et al. 2001, AJ, 122, 549
- Vestergaard & Peterson (2006) Vestergaard, M., & Peterson, B. M. 2006, ApJ, 641, 689
- Weymann et al. (1991) Weymann, R. J., Morris, S. L., Foltz, C. B., & Hewett, P. C. 1991, ApJ, 373, 23
- White & Becker (1992) White, R. L., & Becker, R. H. 1992, ApJS, 79, 331
- Wills et al. (1999) Wills, B. J., Brandt, W. N., & Laor, A. 1999, ApJ, 520, L91
- Wright et al. (2010) Wright, E. L., Eisenhardt, P. R. M., Mainzer, A. K., et al. 2010, AJ, 140, 1868
- Wu et al. (2010) Wu, J., Brandt, W. N., Comins, M. L., et al. 2010, ApJ, 724, 762
- Wu et al. (2011) Wu, J., Brandt, W. N., Hall, P. B., et al. 2011, ApJ, 736, 28
- Xue et al. (2011) Xue, Y. Q., Luo, B., Brandt, W. N., et al. 2011, ApJS, 195, 10
- Yaqoob & Murphy (2009) Yaqoob, T., & Murphy, K. 2009, in Chandra’s First Decade of Discovery, ed. S. Wolk, A. Fruscione, & D. Swartz, 57
- Yaqoob et al. (2010) Yaqoob, T., Murphy, K. D., Miller, L., & Turner, T. J. 2010, MNRAS, 401, 411
- York et al. (2000) York, D. G., Adelman, J., Anderson, Jr., J. E., et al. 2000, AJ, 120, 1579
- Young et al. (2010) Young, M., Elvis, M., & Risaliti, G. 2010, ApJ, 708, 1388
- Young et al. (2007) Young, S., Axon, D. J., Robinson, A., Hough, J. H., & Smith, J. E. 2007, Nature, 450, 74
| Object | Observation | Observation | Exp | Exp_clean | |||
|---|---|---|---|---|---|---|---|
| Name | Start Date | ID | (ks) | (ks) | (arcsec) | cm | |
| (1) | (2) | (3) | (4) | (5) | (6) | (7) | (8) |
| PG 1004+130 | 0.241 | 2012 Oct 29 | 60001112002 | 32.4 | 30.1 | 0.1 | 3.7 |
| PG 1700+518 | 0.292 | 2012 Sep 22 | 60001113002 | 82.5 | 77.1 | 1.5 | 2.6 |
Note. — Cols. (1) and (2): object name and redshift. Cols. (3) and (4): NuSTAR observation start date and observation ID. Cols. (5) and (6): nominal and cleaned NuSTAR exposure times, respectively. Col. (7): minimum positional offset between optical and X-ray positions. The X-ray positions are determined using wavdetect in the 4–20 keV images of FPMs A and B. Col. (8): Galactic neutral hydrogen column density (Dickey & Lockman, 1990).
| Object Name | Net Counts | aaThe effective photon index () was derived based on the band ratio between the observed 10–20 keV and 4–10 keV counts, assuming a power-law model with Galactic absorption. See Section 2.1 for details. For PG 1700+518 in FPM B, the value of was adopted as the one in FPM A. | Flux ( erg cm-2 s-1) | (erg s-1) | |||||||
|---|---|---|---|---|---|---|---|---|---|---|---|
| and FPM | |||||||||||
| 4–10 | 4–20 | 10–20 | 20–30 | 30–79 | 4–10 | 10–20 | 20–30 | 30–79 | 4–20 | ||
| keV | keV | keV | keV | keV | keV | keV | keV | keV | keV | ||
| PG 1004+130 A | |||||||||||
| PG 1004+130 B | |||||||||||
| PG 1700+518 A | |||||||||||
| PG 1700+518 B | |||||||||||
| Sources | Number of | Mean | Total Stacked | Soft-Band | Hard-Band | ||||
|---|---|---|---|---|---|---|---|---|---|
| Stacked | Sources | Redshift | Exposure (ks) | Counts | Counts | (erg s-1) | |||
| All | 12 | 1.99 | 68.4 | 43.3 | |||||
| HiBAL quasars | 7 | 2.10 | 40.2 | 43.5 | |||||
| LoBAL quasars | 5 | 1.84 | 28.2 | aaThe upper limit on the source counts was derived using the Bayesian approach of Kraft et al. (1991) for a 90% confidence level. | bbWe assumed when calculating the soft-band flux and . | 42.9 |