Time- and Space-Modulated Raman Signals in Graphene-based Optical Cavities
Résumé
We present fabrication and optical characterization of micro-cavities made of multilayer graphene (MLG) cantilevers clamped by metallic electrodes and suspended over Si/SiO2 substrate.
Graphene cantilevers act as a semi-transparent mirrors closing an air-wedge optical cavity.
This simple geometry implements a standing-wave optical resonator along with a mechanical one.
Equal thickness interference fringes are observed in both Raman and Rayleigh backscattered signals with interfringe given by their specific wavelength.
Chromatic dispersion within the cavity makes possible spatial modulation of graphene Raman lines and selective rejection of the silicon background signals.
Electrostatic actuation of the multilayer graphene cantilever by gate voltage tunes the cavity length and induces space and time modulation of backscattered light including Raman lines.
We demonstrate the potential of those systems for high sensitivity Raman measurements of generic molecular species grafted on multilayer graphene surface.
The Raman signal of the molecular layer can be modulated both in time and in space in a similar fashion and show enhancement with respect to a collapsed membrane.
PACS: 78.67.Wj 74.25.nd 78.20.-e 78.67.-n
Keywords: graphene, optical cavities, Raman spectroscopy, hybrid systems
I Optical Properties of Graphitic systems
I.1 Introduction: interaction of light with graphene
Graphitic carbon nanostructures are generally known to produce very efficient light-absorbing media[1]. Indeed the "blackest" materials ever manufactured are based on carbon nanotube forests. Interestingly the exact same carbon phases when made very thin and flat (such as in carbon nanotube thin films or stacked graphene layers), provide extremely promising candidates[2] for the implementation of flexible and transparent electrodes. This apparent paradox can be easily explained by looking at the variety of structures and shapes into which nanostructures based on sp2 hybridized carbon can be assembled down to the atomic level. Among all these allotropes, graphene is known for providing a flat 2D material with outstanding optical, electrical and mechanical properties[3]. Optics in graphene had an historical role as it was strongly involved in the first isolation of a monolayer [4, 5, 6]. Indeed a single layer of graphene can be easily seen under an optical microscope as the reflected light has a sufficient phase shift [7] to be detected by the bare eye. Optical methods based on reflectometry have been identified as critical to efficiently sort graphene multilayers (MLG) obtained by exfoliation techniques as it readily allows the quantitative identification of the number of stacked layers [8]. Moreover owing to its peculiar quantum electronic properties, graphene acts as a semi-transparent membrane exhibiting universal and quantized optical transmission[9]. This quantization fails for multilayers graphene thicker than a few layers, however the membrane keeps a significant transparency up to hundred of layers[10].
I.2 Enhancing graphene coupling to photons by integration within an optical cavity
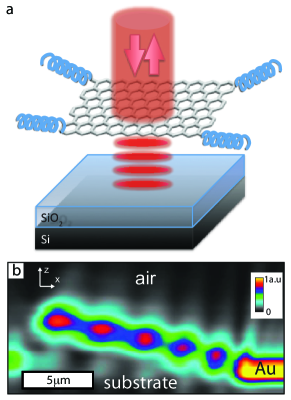
In all these previous studies, optical interferences is at the origin ofthe visibility of graphene and more generally gives means to further optimize the interaction with incoming photons. Light-graphene coupling can be indeed further enhanced by integrating the graphene within an optical cavity. This has been recently achieved on photonic crystals [11] or in a Fabry-Perot cavity [12, 13]. it was shown that the sensitivity of graphene-based photon detectors[14, 15, 16] can be maximized in a cavity in which graphene is placed at resonant conditions,. For example thanks to the cavity effect, the absorbance of graphene in the THz range can exhibit a wavelength absorbance contrast reaching up to 70% modulation depth[17]. Recently, a suspended and movable graphene membrane has been integrated into a low finesse optical cavity[18]. This demonstrates how light can be coupled to the mechanical motion, and lead to active cooling of the graphene membrane, showing the interesting prospects of using graphene for further optomechanical studies (cf. figure 1).
Similar cavity effects also apply to Raman scattered light. Raman spectroscopy, a powerful probe for graphene as it allows the local mapping of numerous physical parameters such as doping, structural defects, phonon temperature and mechanical stress, can be strongly affected by its coupling to a cavity. On this basis, interference enhancement of Raman scattering (IERS) has been studied long ago[19] and more recently applied to graphene[20, 21] by tuning the SiO2 thickness of samples made of supported or suspended graphene flakes. Similarly to what was achieved for elastically scattered light, IERS relies on the constructive interference of Raman scattered photons [19, 22]. Multiple wave interferences in graphene over silica have been identified as a way to enhance the Raman signals either coming from the graphene vibrations modes[21] or from adsorbates such as halogen species[20]. By varying the composition[23] and thickness [21] of the dielectric underlayer on which the graphene is deposited, modulation of the Raman lines has been shown.
In the present work, we show that, by building an optical micro-cavity made of self-supported multi-layer graphene cantilever freestanding over silicon, interference phenomena occur not only in back-reflected light but in Raman signals, either coming from graphene, from silicon substrate or from any foreign adsorbed element. By electrostatic actuation of the graphene membrane, a time modulation synchronized with the application of a AC signal on the metallic electrodes can be achieved, offering a versatile platform for Raman studies.
II Fabrication and Implementation of Multilayered graphene electrically actuated optical cavities
Our system takes advantage of the outstanding optical, mechanical and electrical properties of graphene. Multilayers of typically 10 to 100 layers implement suspended semi-transparent mirror cantilevers, stiff enough to remain self-supported over more than 10 microns and electrically conducting to be actuated by an external electrostatic potential. The simultaneous high rigidity of this material and its semi-transparency allow creating an overhanging cantilever which is at the same time, light, rigid and semi-transparent (typically 25 % transparency, 30 % reflectance, 45 % absorbance for 100 monolayers of graphene[10]). The batch integration of this system can be made using exfoliation of graphite on oxidized silicon followed by lithography/deposition of electrodes and under etching (see methods for details).
This optical micro-cavity defines an air wedge structure as shown on figure 2. Unlike conventional[24] graphene-based optical cavities with fixed geometries, the optical length of this cavity increases linearly along the cantilever, which allows the observation of multiple interference fringes (cf. figure 1). These equal-thickness interferences fringes, so-called Fizeau fringes, will be first described for reflected light and Raman scattering. Furthermore, we demonstrate the possibility to tune this optical cavity with an voltage applied on graphene, allowing us to control the wedge angle and thus the interference pattern. The resulting shift in the interference pattern can be used a an intensity modulation for a fixed laser probe, which in turn can be used to modulate the intensity of Raman signals. Taking advantage of the variable interference enhancement of Raman scattering combined with the ability of graphene to be an excellent substrate for Raman scattering, we show the possibility to use this cavity as a tunable platform for molecular detection. Recently, our team has shown that similar suspended graphitic membranes can be used to simultaneously detect motion and stress[25] within the actuated cantilever using the stress-dependence of the Raman response. Perspectives for the use of these novel families of system for building hybrid platforms for Raman studies will be presented.
III Optical Fizeau interferences in the micro-cavity
III.1 Interferences in reflection
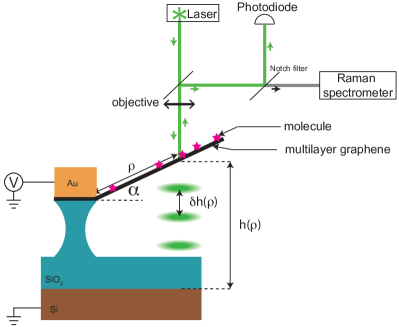
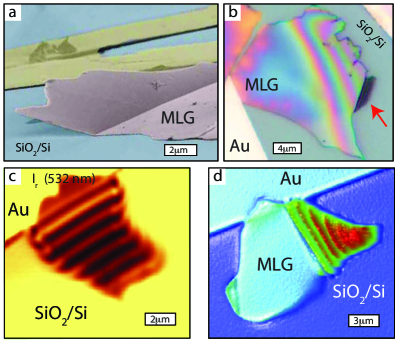
Optical interference fringes are observed along this air wedge device (cf. figure 2b-d and 1b). As the local cavity thickness (which corresponds to the vertical gap between the MLG membrane and the reflecting substrate) is increased by , where and are respectively the wavelength and the optical index of air or vacuum (cf. figure 3), a new interference maximum appears within the cavity. In fig 2b-c, iridescence is observed under white light illumination and the interference pattern is measured at 532 nm. Wedge geometry implies that all points at equal distance from the hinge have equal light wave dephasing, forming a set of parallel Fizeau fringes (or equal thickness fringes). Note that the interference order is close to one as the thickness of the wedge are a mere /2, especially near the hinge position. In addition, for small wedge angles (10∘), the in-plane distance between two adjacent fringes would be large enough to spatially resolve them by confocal microscopy imaging. By confocal imaging, AFM and profilometry measurements, we check that the geometry of the MLG cantilever is flat. This ensures that the gap between the MLG cantilever and the silicon substrate increases linearly from the hinge to the end of the cantilever. One can simply consider light beam enters the cavity and get trapped for a certain number of reflexions on both sides before escaping it. For high finesse cavity, this trapping becomes efficient and light field can be locally strongly enhanced inside the cavity. In our case, the wedged cavities (finesse 10) do not exhibit the high finesse characteristic of Fabry-Perot fringes i) because of the non-parallel wedge geometry which causes wave detrapping at higher interference order[26], and ii) because light absorption limit is not negligible in both substrate and MLG membrane. The first argument, previously discussed by Brossel[27], can be interpreted in terms of geometrical optics. Reflexions of the multiple reflected beam in the cavity is progressively shifted along the membrane, eventually escaping the cavity. Therefore, after a number of reflexions given by the Brossel criterion , the transmitted beam cannot be collected by the microscope objective. Such effect implies i) a low intensity of the interference fringe, ii) an increase of its width along the membrane, iii) a shift of the fringe along the wedge structure and iv) an asymmetry in the fringe profile. The second reason why those cavities do not exhibit very high finesse is the strong absorption of light which limits the reflected intensity . Interestingly, the derivation of the reflected light in such asymmetric cavity becomes highly non-trivial problem when absorption effect has to be considered as highlighted by Holden[28] in 1949. According to these two effects, one may derive the reflected light intensity :
| (1) |
where , , , , and are respectively the incident laser light intensity, the laser position along the membrane, the cavity finesse, the absorption coefficient, the phase difference between two reflected beams and a constant which slightly depends on the reflection coefficient[28]. One can express the phase difference as a function of the interfringe which is the distance separating two successive Fizeau fringes along the MLG membrane.
Raman effect is an inelastic scattering process of light and gives information on the atomic displacements inside a material. Analysis of the probed optical phonons leads to a rich variety of intrinsic properties (thermal, mechanical, electronic, vibrational, structural) [3, 29, 30, 25, 21]. Moreover, since Raman signal is related to the microscopic structure of matter, it is a fingerprint of a lot of chemicals or molecule. Raman fingerprint of graphitic nano-system is made of two major G and 2D bands[29].
Interference patterns observed along MLG cavities from the reflection of the pump laser are also observed from the Raman scattered light and follow a similar behavior (see figures 5 and 4). Thus, one can see a situation where light sources are now localized on one side of the cavity (either the Si or MLG side). The light sources create Raman photons which can enter the cavity and produce interference pattern, or get collected directly by the objective. Interestingly, not all the collected Raman photons contribute to interference effect since the collection angle is very large (NA = 0.95), and thus the collected Raman light has to contribution : i) interference enhanced Raman (IERS) and ii) standard Raman. Equation 1 is then modified, and we define as the Raman intensity (i.e. the G band) measured along the membrane :
| (2) |
Where is the total Raman scattered intensity at position and for a given laser power, without taking into account interference effects. is the solid collection angle for photons without interference contribution, and is the solid collection angle for photons interfering in the cavity. is the phase difference between interfering beams and is the theoretical interfringe for a given Raman mode in case of homogeneous laser power. For isotropic scattering, the fist term in equation 2 is independent of the position along the membrane and only depends on the numerical aperture. In our case, . The IERS signal (collection solid angle ) obeying the Brossel criterion can be understood as the maximal interference order allowed for a light beam transmitted out of the cavity at a position laterally shifted by a distance smaller than the laser spot size. Limit angle is derived for a two-waves interference. Thus, depends on the air wedge thickness : close to the hinge can correspond to of ( 180 nm, 12 ∘.).
So far, we have introduced the intensity modulation for laser light (cf. eq. 1) and for Raman scattered light (cf. eq. 2). In equation 2, we have introduced the term , which depends on the laser position along the membrane since we take into account a realistic case where Raman scattered light intensity is affected by the modulation of the laser excitation intensity. This leads to :
| (3) |
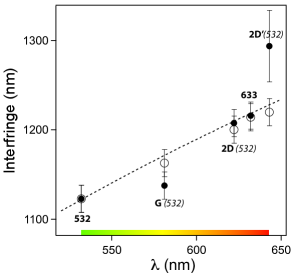
It is worth noting that equation 3 shows the non-trivial dependence of the observed Raman Fizeau interfringe since it is now clear that there is beating effect due to interferometric modulation of laser excitation. Three interfringes expressions are present : the measured Raman interfringe , the absolute Raman interfringe (supposing constant laser power along the membrane) , and the excitation laser interfringe . From the equation 3, two regimes appears : i) (Raman interference effect negligible) leading to , and ii) (Raman interference effect dominant) leading to one physical solution :
| (4) |
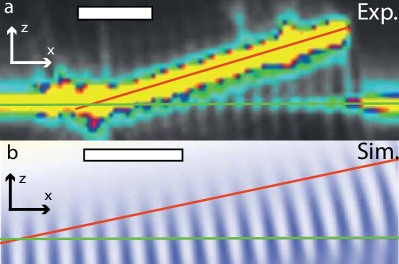
This expression, plotted in figure 4, fits the experimental data and the simulated points using an ellipsometry simulation software. In figure 4, we clearly see that and depends on the Raman scattered light wavelength.
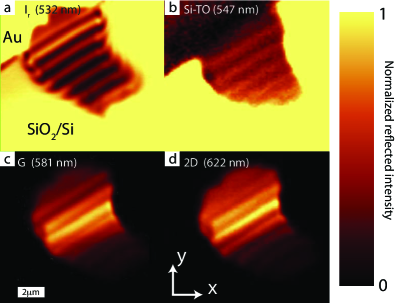
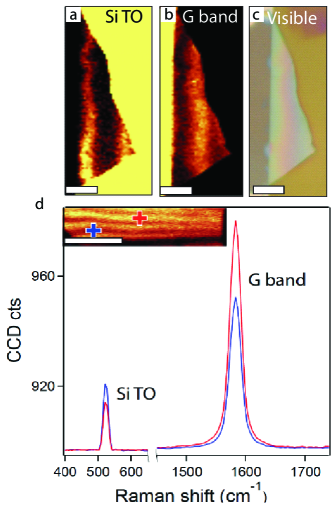
In figure 5a-c, interference fringes are measured via spatially resolved Raman spectroscopy for silicon (TO) and MLG (G, 2D and 2D’) Raman lines. By taking advantage of this periodic shift with respect to (typically ), the ratio can be tuned by moving the probe position (see Fig. 5d), in order to optimize the spatial modulation and background contrast. Such a modulation (by moving the laser) allows to tune the optical cavity to maximize a Raman peak relative to another which could be of great use in high resolution Raman spectroscopy. This effect is even more pronounced if the finesse of the optical cavity is high (as suggested by equation 3) and offers the possibility of effective rejection of unwanted Raman signals (substrate, residues, etc.). Another manner to modulate this Raman signal is to realize an electrostatic modulation.
IV Electrostatic modulation of the optical micro-cavity
The optical cavity thickness can be adjusted by varying the angle through electrostatic actuation of the cantilever (see figure 3), thus producing a shift in the interference pattern. This modulation of the cavity thickness is achieved by applying a DC or AC voltage applied to the clamp electrode while the substrate is grounded. Thus where is the local cavity thickness or length at . This results in an attractive electrostatic force:
| (5) |
This force (eq. 5) produces an angular deviation with respect to the equilibrium position. For driving frequencies where is the mechanical resonant frequency (MHz range[25]), the motion of the cantilever of mass M is determined by linear response theory and is then defined as the product of the mechanical susceptibility at low frequency and the applied force :
| (6) |
It is worth noting when laser spot is located 10 m away from the hinge, the deviation does not change significantly () the value of which could be approximated as a constant.
We now implement an interferometric detection of the motion, which would be maximum when the quantity is maximum, i.e. at a fringe edge. In our experiments, we manage to focus the laser beam at fringe edge, and far away for the hinge, in order to get large motion amplitude. Therefore, it is legitimate that is locally a linear function of implying that for small deflection , the variation of reflected light intensity (or Raman scattered light) under electrostatic actuation could be written as follows :
| (7) |
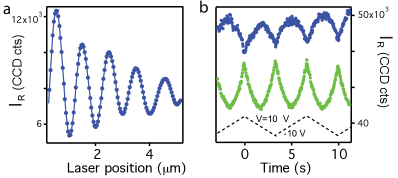
The figure 6b shows the experimental values for reflected light intensity under triangular electrostatic actuation. When we apply a potential which is a linear function of the time, the associated change in reflected light intensity will be quadratic in time as suggested by the term in in the equation 7. Alternation of parabolic sections and peculiar sharp points is therefore due to the kinks of the function (triangular signal). We also observe that depending of the laser spot position, festoon-like behavior would be pointing up or down. Actually, this is due to the sign of (cf. equation 7) which changes sign from one side of the Fizeau fringe to the other (rising or falling edge). This effect allows us to calibrate precisely the magnitude of electrostatic actuation by analyzing the nonlinearities observed when more than one interfringe is swept (as shown is figure 8b and in reference[25]). As we have shown previously, the typical order of magnitude for quasi-static actuation is about 1 nm.V-2 for 10 m (thus, for 10V, motion amplitude at 10 m from the hinge is about 100 nm). By varying the gate voltage applied on the MLG, its angle can be adjusted on a wide range (giving a local thickness variation far exceeding the wavelength of the incoming light). its motion can be actuated and followed in real time from DC up to the tens of MHz range (mechanical resonance). Example of the optical detection of motion and stress of the membrane[25].
To summarize, by combining the observed optical Fizeau interference to the possibility of adjusting the cavity length by electrostatic actuation of the MLG cantilever, it is possible to tune the optical resonance of the optical wedged cavity. We now explore the potential of such interferometric enhancement with a graphene based hybrid system to measure Raman response of grafted molecules.
V Graphene as a tunable Raman platform for Molecular Detection
V.1 Adsorbed Species on Graphene : Hybrid Graphene systems
One of the most promising aspects of graphene is the unique ability to combine its own properties with ones of a grafted specie. Based on this feature, hybrid devices have been made to combine the electronic properties of graphene with the spin of a single molecular magnet[31]. Detection of single objects grafted on graphene still remains a crucial point to fully characterize hybrid devices and propose new ones. Recently, the idea of using graphene as a substrate for Raman signal enhancement has been proposed [32, 30], revealing that graphene has distinctive properties for Raman signal enhancement of grafted chemical species. The sensitivity goes up to very few amount of molecules ( 10-100 for pyrene-substituted bis-phthalocyanine Terbium TbPc2 case) [30, 33] and is based on a chemical enhancement for due to charge transfer between the graphene and the molecules. Graphene also has singular optical properties making it a semi-transparent membrane in the visible range [9]. This property has been used for designing optical cavities made of graphene membrane lying on transparent SiO2 layer, with silicon back mirror [7]. Optical interferences created by the cavity allows detection of graphene flakes when the cavity thickness is adjusted to be in resonant conditions (ie. maximizing the optical contrast). On that basis, interference enhancement of Raman scattering has been proposed [19, 20, 21] by tuning the SiO2 thickness of samples made of supported or suspended graphene flakes parallel to the SiO2/Si substrate. That phenomenon of interference enhancement of Raman scattering (IERS) relies on the constructive interference between Raman scattered photons [19, 22].
V.2 Cavity enhancement of molecules adsorbed on graphene
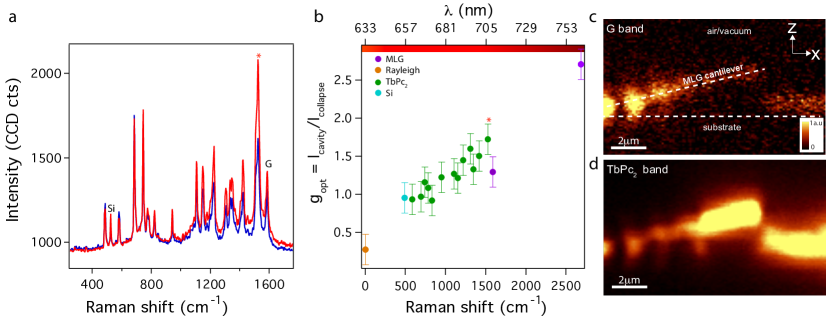
Raman spectra of this hybrid system, as shown in figure 7a, indicates that the molecule is intact once deposited on the air wedge which is consistent with our previous work[30]. Unlike the case where the graphene is parallel to the plane of the substrate[30], our spatially resolved Raman mapping in the vertical plane (x,z) reveals Fizeau fringes for TbPc2 Raman bands in addition to those Raman signal corresponding to the multilayer graphene membrane (see figure 7c-d). By positioning the laser beam on the top of a bright interference Raman fringe of TbPc2 (for example the Raman band at 1515 cm-1), we measure an enhanced Raman signal of the molecule due to the interference effect. This enhancement depend on the finesse of the cavity, as suggested by the equation 3 which is limited in our case by the absorbance of the two mirrors (silicon and graphene). A higher cavity finesse would increase the gain of the Raman lines and also offer the possibility to completely extinguish a given Raman peak for instance. In order to quantify the optical gain in our cavity, we measure the Raman spectrum on the same system for two different configurations : (figure 7a) respectively on a bright Fizeau fringe (red curve) and where the membrane is collapsed on the substrate (blue curve). In the second case, the optical thickness of the cavity is smaller than for (). The intensity ratio between the 2D peak on the top of a Fizeau fringe(identified by a red star in figure 7a ) and on the collapsed membrane is reported in figure 7b. The optical gain for each of Raman bands (molecule, silicon or membrane) follows an increasing dispersion behavior with the wavelength associated with each of the interference systems. Since the gain differs even within the set of Raman peaks, it becomes possible to preferentially enhanced each Raman modes if one is able to change the thickness of the cavity by moving the laser or the membrane itself by electrostatic actuation, as we will see in the next section.
V.3 AC Gate modulation of Raman lines of generic molecular species from molecular detection.
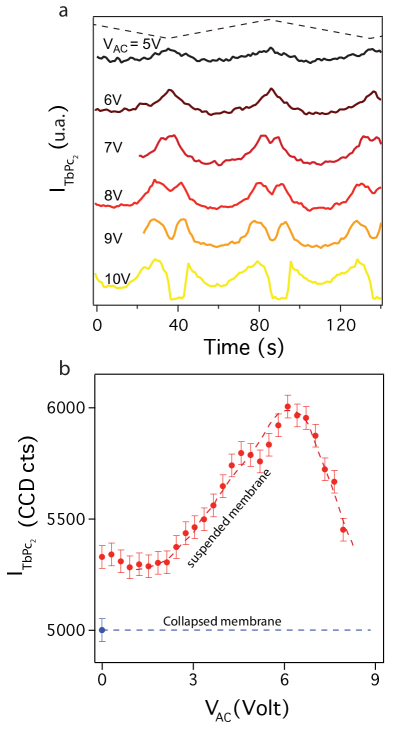
As described previously, the Raman response TbPc2 molecules grafted on the suspended MLG membrane is affected by the interference phenomenon. By applying the AC voltage, the thickness of the cavity - and hence the position of TbPc2 fringes - is periodically shifter (cf. equation 7). Ajusting the cavity length offers two features that are unique for generic Raman studies and potentially very useful to detect tiny Raman signal emitted by small amount of molecules : firstly the possibility to adjust the molecule under the Laser probe up to a resonating position for maximizing the Raman signal of the molecule. Secondly, the possibility to modulate in time Raman intensities, in a synchronized way with the AC voltage, a feature which potentially allows lock-in detection at a specific wavelength. To validate these two features, we have measure the response of the Raman spectra with respective application of AC and DC voltage (fig. 8 a and b, respectively).
For an applied AC sawtooth signal (8a.), we systematically detect a festoons-like responseof the reflected light on the membrane which is similar to what was observed for Graphene Raman signal, as was shown in figure 8a. When is gradually increased above , the thickness of the cavity thickness span than , which means that one full Fizeau interference fringe has been passed through which explain the dip which appealer In figure 8b, Raman intensity of TbPc2 mode (1515 cm-1) is plotted versus the applied voltage and the measured Raman signal compared to a collapsed immobile membrane. The optical gain is maximum when the thickness the cavity was adjusted to have a bright fringe (constructive interference) of the molecule Raman mode (for 7V). The optical cavity is thus modulated electrostatically to adjust its thickness, which maximize the Raman line intensity. This important result allows synchronized detection methods where the excitation signal is locked with the recorded frequency of Raman spectrum, for example. Such a technique would lower the detection threshold of adsorbed molecules on the membrane, tending towards the detection of a single object. Thanks to the electrostatic modulation of the cavity, ones can select the Raman modes enhanced by a constructive interference. By using this phenomena, we can thus inverse the intensity ratio between the selected modes and all others Raman signals. For example, we can selectively reject the fluorescence signal thus improving the signal to noise ratio of Raman spectra.
VI Conclusion
We have characterized the properties of simply clamped graphene cantilevers that acts as a dual mechanical and optical resonators: both NEMS and Fabry-Perot like cavity. This combination realizes an integration of a Raman based platform for the detection of molecular grafted species. When overhanging oxidized silicon substrates, graphene cantilevers implement an optical cavity with finesse in the range 5-10. Thickness variation within the air wedge between the graphene membrane and silica induces equal spacing fringes (Fizeau fringes) in the reflected and scattered light. We have shown that such optical cavity exhibits optical interferences pattern (Fizeau fringes) visible for both incoming laser beam and Raman scattered photons. The fact that both elastic and inelastic scattering response give rise to a series of interference patterns which specific signature and interfringes , allows splitting each Raman modes coming from different chemical origin and vertical position Using that feature, we have been able to selectively reject the graphene Raman signals from the silicon one for example. Such tuning is possible either by moving the laser spot along the Fizeau fringes pattern, or by electrostatically actuating the cavity. Moreover, it constitutes a case-study system to get a comprehensive picture of optical interferences within graphene-based optical cavities. When graphene surface is functionalized with -stacked molecules, the Raman signal intensity is modulated by actuation of the cavity length with gate voltage, and shows an enhancement which is maximum when the characteristic wavelength of the associated Raman band is at resonant conditions. The achieved time modulation of Raman paves the way for lock-in type detection for single molecule Raman spectroscopy. The extension of that fine space and time tuning to any arbitrary Raman signal originating from chemicals grafted on the graphene show that our original platform offers a promising device for highly sensitive Raman experiments on grafted chemicals on graphene. Further works are underway to take profit of this system for the studies by Raman spectroscopy of single molecular systems.
Acknowledgements.
We thank D. Basko, E. Bonet, A. Candini, L. Del-Rey, E. Eyraud, J. Jarreau, M. Lopes, C. Schwarz, M. Urdampilleta and W. Wernsdorfer for discussions and help in realizing the experimental setup. We also thank Nanochemistry and Nanofab facilitie at Néel Institute. This work was supported by the Agence Nationale de la Recherche (ANR projects : MolNanoSpin, Supergraph, Allucinan and Trico), European Research Council (ERC advanced grant no. 226558), the Nanosciences Foundation of Grenoble and Region Rhône-Alpes. M.R. thanks the priority program PP 1459 of the German Science Foundation (DFG) for generous support.Références
- [1] J Takadoum. Black coatings: a review. European Physical Journal- Applied Physics, 52(3):7–7, 2010.
- [2] Keun Soo Kim, Yue Zhao, Houk Jang, Sang Yoon Lee, Jong Min Kim, Kwang S Kim, Jong-Hyun Ahn, Philip Kim, Jae-Young Choi, and Byung Hee Hong. Large-scale pattern growth of graphene films for stretchable transparent electrodes. Nature, 457(7230):706–710, 2009.
- [3] Daniel Cooper, Benjamin D’Anjou, Nageswara Ghattamaneni, Benjamin Harack, Michael Hilke, Alexandre Horth, Norberto Majlis, Mathieu Massicotte, Leron Vandsburger, Eric Whiteway, and Victor Yu. Experimental review of graphene. ISRN Condensed Matter Physics, 2012(501686):56, 2012.
- [4] K.S. Novoselov, A.K. Geim, S.V. Morozov, D. Jiang, Y. Zhang, S.V. Dubonos, I.V.Grigorieva, and A.A. Firsov. Electric field effect in atomically thin carbon films. Science, 306(5696):666, 2004.
- [5] K S Novoselov, D Jiang, F Schedin, T J Booth, V V Khotkevich, S V Morozov, and a K Geim. Two-dimensional atomic crystals. Proceedings of the National Academy of Sciences of the United States of America, 102(30):10451–3, 2005.
- [6] Yuanbo Zhang, Yan-Wen Tan, Horst L Stormer, and Philip Kim. Experimental observation of the quantum Hall effect and Berry’s phase in graphene. Nature, 438(7065):201–4, 2005.
- [7] P. Blake, E. W. Hill, A. H. Castro Neto, K. S. Novoselov, D. Jiang, R. Yang, T. J. Booth, and A. K. Geim. Making graphene visible. Applied Physics Letters, 91(6):063124, 2007.
- [8] S Roddaro, P Pingue, V Piazza, V Pellegrini, and F Beltram. The optical visibility of graphene: interference colors of ultrathin graphite on SiO(2). Nano letters, 7(9):2707–10, 2007.
- [9] R R Nair, P Blake, A N Grigorenko, K S Novoselov, T J Booth, T Stauber, N M R Peres, and A K Geim. Fine structure constant defines visual transparency of graphene. Science (New York, N.Y.), 320(5881):1308, 2008.
- [10] H Skulason, P Gaskell, and T Szkopek. Optical reflection and transmission properties of exfoliated graphite from a graphene monolayer to several hundred graphene layers. Nanotechnology, 2010.
- [11] T. Gu, N. , McMillanJ. F., van der ZandeA., YuM., LoG. Q., KwongD. L., HoneJ., and WongC. W. Regenerative oscillation and four-wave mixing in graphene optoelectronics. Nature Photon., 6(8):554–559, 2012. 10.1038/nphoton.2012.147.
- [12] Marco Furchi, Alexander Urich, Andreas Pospischil, Govinda Lilley, Karl Unterrainer, Hermann Detz, Pavel Klang, Aaron Maxwell Andrews, Werner Schrenk, Gottfried Strasser, et al. Microcavity-integrated graphene photodetector. Nano letters, 12(6):2773–2777, 2012.
- [13] Michael Engel, Mathias Steiner, Antonio Lombardo, Andrea Ferrari, Hilbert Löhneysen, Phaedon Avouris, and Ralph Krupke. Light–matter interaction in a microcavity-controlled graphene transistor. Nat Commun, 3:906, 2012. 10.1038/ncomms1911.
- [14] Berardi Sensale-Rodriguez, Rusen Yan, Subrina Rafique, Mingda Zhu, Wei Li, Xuelei Liang, David Gundlach, Vladimir Protasenko, Michelle M. Kelly, Debdeep Jena, Lei Liu, and Huili Grace Xing. Extraordinary control of terahertz beam reflectance in graphene electro-absorption modulators. Nano Letters, 12(9):4518–4522, 2012.
- [15] Marco Furchi, Alexander Urich, Andreas Pospischil, Govinda Lilley, Karl Unterrainer, Hermann Detz, Pavel Klang, Aaron Maxwell A.M. Andrews, Werner Schrenk, Gottfried Strasser, Others, and Thomas Mueller. Microcavity-Integrated Graphene Photodetector. Nano letters, pages 1–19, 2012.
- [16] Michael Engel, Mathias Steiner, Antonio Lombardo, Andrea C Ferrari, Hilbert V Löhneysen, Phaedon Avouris, and Ralph Krupke. Light-matter interaction in a microcavity-controlled graphene transistor. Nature communications, 3(may):906, 2012.
- [17] Berardi Sensale-Rodriguez, Rusen Yan, Subrina Rafique, Mingda Zhu, Wei Li, Xuelei Liang, David Gundlach, Vladimir Protasenko, Michelle M. Kelly, Debdeep Jena, Lei Liu, and Huili Grace Xing. Extraordinary control of terahertz beam reflectance in graphene electro-absorption modulators. Nano Letters, 12(9):4518–4522, 2012.
- [18] Robert a Barton, Isaac Storch, Vivekananda P Adiga, Reyu Sakakibara, Benjamin R Cipriany, Rob Ilic, Si Ping Wang, Peijie Ong, Paul L McEuen, Jeevak M Parpia, and Harold G Craighead. Photothermal Self-Oscillation and Laser Cooling of Graphene Optomechanical Systems. Nano letters, 2012.
- [19] G. a. N. Connell, R. J. Nemanich, and C. C. Tsai. Interference enhanced Raman scattering from very thin absorbing films. Applied Physics Letters, 36(1):31, 1980.
- [20] Naeyoung Jung, Andrew C Crowther, Namdong Kim, Philip Kim, and Louis Brus. Raman Enhancement on Graphene: Adsorbed and Intercalated Molecular Species. ACS nano, XXX(Xx), 2010.
- [21] Duhee Yoon, Hyerim Moon, Young-Woo Son, Jin Choi, Bae Park, Young Cha, Young Kim, and Hyeonsik Cheong. Interference effect on Raman spectrum of graphene on SiO2/Si. Physical Review B, 80(12):1–6, 2009.
- [22] A Fainstein, B Jusserand, and V Thierry-Mieg. Raman scattering enhancement by optical confinement in a semiconductor planar microcavity. Physical review letters, 75(20), 1995.
- [23] Marco Castriota, Enzo Cazzanelli, Daniela Pacilè, Luigi Papagno, Çağlar O. Girit, Jannik C. Meyer, Alex Zettl, Marco Giarola, and Gino Mariotto. Spatial dependence of raman frequencies in ordered and disordered monolayer graphene. Diamond and Related Materials, 19(5–6):608 – 613, 2010. <ce:title>Proceedings of Diamond 2009, The 20th European Conference on Diamond, Diamond-Like Materials, Carbon Nanotubes and Nitrides, Part 1</ce:title>.
- [24] Xi Ling, Liming Xie, Yuan Fang, Hua Xu, Haoli Zhang, Jing Kong, Mildred S. Dresselhaus, Jin Zhang, and Zhongfan Liu. Can graphene be used as a substrate for raman enhancement? Nano Letters, 10(2):553–561, 2010. PMID: 20039694.
- [25] Antoine Reserbat-Plantey, Laëtitia Marty, Olivier Arcizet, Nedjma Bendiab, and Vincent Bouchiat. A local optical probe for measuring motion and stress in a nanoelectromechanical system. Nature Nanotechnology, 7(3):151–155, 2012.
- [26] John R. Rogers. Fringe shifts in multiple-beam Fizeau interferometry. Journal of the Optical Society of America, 72(5):638, 1982.
- [27] Brossel. Fabry Perot interferometer. Proceedings Physical Society, 59:460–463, 1947.
- [28] J. Holden. Multiple-beam interferometry: Intensity distribution in the reflected system. Proc. Phys. Soc. B, 62(405), 1949.
- [29] A. C. Ferrari, J. Meyer, V. Scardaci, C. Casiraghi, M. Lazzeri, F. Mauri, S. Piscanec, D. Jiang, K. Novoselov, S. Roth, and A. Geim. Raman Spectrum of Graphene and Graphene Layers. Physical Review Letters, 97(18):1–4, 2006.
- [30] Manuel Lopes, Andrea Candini, Matias Urdampilleta, Antoine Reserbat-Plantey, Valerio Bellini, Svetlana Klyatskaya, Laëtitia Marty, Mario Ruben, Marco Affronte, Wolfgang Wernsdorfer, and Nedjma Bendiab. Surface-enhanced Raman signal for terbium single-molecule magnets grafted on graphene. ACS nano, 4(12):7531–7, 2010.
- [31] Andrea Candini, Svetlana Klyatskaya, Mario Ruben, Wolfgang Wernsdorfer, and Marco Affronte. Graphene spintronic devices with molecular nanomagnets. Nano letters, 11(7):2634–9, 2011.
- [32] Xi Ling and Jin Zhang. Interference Phenomenon in Graphene-Enhanced Raman Scattering. Most, 2(1), 2010.
- [33] Svetlana Kyatskaya, José Ramón Galán Mascarós, Lapo Bogani, Frank Hennrich, Manfred Kappes, Wolfgang Wernsdorfer, and Mario Ruben. Anchoring of rare-earth-based single-molecule magnets on single-walled carbon nanotubes. Journal of the American Chemical Society, 131(42):15143–15151, 2009. PMID: 19799421.
VII Supplementary Material
VII.1 Methods
Multilayered graphene flakes are deposited on 280 nm thick oxidized silicon wafer by micro-mechanical exfoliation of Kish graphite. Electrical contacts are made using deep UV lithography and e-beam deposition of 50 nm Au electrodes. Samples are suspended by etching (in buffered fluorhydric acid solution 1:3 HF/NH4F)) transferred in isopropyl alcohol and dried using CO2 critical point drying. Reflectivity and Micro-Raman spectroscopy were performed with a commercial Witec Alpha 500 spectrometer set with a dual axis X-Y piezo stage in a back-scattering/reflection configuration allowing a spatial imaging of our samples. Raman spectra are recorded on each pixel and the integrated intensity of a chosen mode is displayed on a false color scale (see for instance figures 1b or 2c). This microRaman is mounted on a confocal microscope equiped with a Nikon 100x objective with a numerical aperture of 0.95, conferring a spot size 500 nm at a focus depth of 1 m. Two laser excitation wavelengths are used, 633 nm (He-Ne) and 532 nm (Solid state Argon diode). All Raman spectra have been recorded by a CCD camera with 1 kHz bandwidth. The power of the laser beam is kept below 300 W to prevent any damage on the MLG film. Non-contact AFM is performed on a collapsed region of the same flake to obtain the MLG thickness. Additional measurements using optical confocal microscopy give an estimate of the flake geometry and of the angle of the air wedge, which is further confirmed using SEM microscopy with grazing incidence. Ellipsometry simulation is performed using software from NanoCalc thinfilm reflectometry system by Ocean Optics.
Multilayered Graphene flakes (MLGs) are deposited on oxidized silicon wafer by micro-mechanical exfoliation[4, 5] of Kish graphite on a 280 nm SiO2-Silicon wafer. After exfoliation, pattern of electrically connected leads made of 50nm thick gold is deposited on top of the flakes by using deep-UV lithography followed by electron beam evaporation and lift-off. Silicon oxide supporting the graphene flake is etched on approximately 90 nm by dipping the sample in a solution of buffered hydrogen fluoride (concentration 1:3 HF/NH4F) during 65 seconds and drying the sample using CO2 critical point drying. MLG films (typically 10-100 MLs) exhibit sufficient rigidity to stay free standing without collapsing along micron size distances even when they are simply clamped by one side. We identify the flakes interesting for our study by selecting those which have one side clamped by a gold lead while the other extremity is free standing and tend to stick-up after the fabrication process (see Fig.LABEL:fig:fig1c) thus realizing air wedge structure with air thickness ranging between 0.1 and 2 microns. A clear iridescent pattern of fringes can be seen on a small fraction (ca. 5%) of these partly suspended flakes which tells that a specific range of flake thicknesses is required for observing this effect. A typical density of 10 flakes per cm2 show this effect. Experiment has been performed on approximately 100 samples.
The molecules deposited on graphene are pyrenyl-substituted heteroleptical bis(phthalocyaninato) terbium(III) complexes, referred to as TbPc2 in this publication[33]. TbPc2 molecule is deposited onto the sample at the very end of the fabrication process. We use spin drop casting, at high rotational speed, with no other process. Almost 90 of the suspended cantilevers remain suspended after that step. More details of the deposition method are in reference[30].
VII.2 Interference pattern along the air wedge
A simplified simulation is presented in figure 5. It considers only a two wave interference, involving the reflections on the MLG and Si planes respectively. The protocol consists in varying the focused spot position of an incoming Gaussian beam, and measuring the overlap of the reflected field with the spatial profile of the incoming field, that also matches the detection mode. The reflected field is estimated from the complex sum of the fields reflected by the two planes, while taking into account the field reflection and transmission coefficients on each mirror. Note that no spatially incoherent scattering has been considered in this very simple approach, which explains the absence of the bright features observed experimentally at the plane location. However, the general characteristics of the Fizeau fringes can be reproduced (see Fig. 1f). Note also that in order to obtain a correct fringe pattern, one has to take into account the phase curvature of the fields, as a simple intensity calculation is not sufficient for reproducing the observed patterns.