Spontaneous centralization of control in a network of company ownerships
Abstract
We introduce a model for the adaptive evolution of a network of company ownerships. In a recent work it has been shown that the empirical global network of corporate control is marked by a central, tightly connected “core” made of a small number of large companies which control a significant part of the global economy. Here we show how a simple, adaptive “rich get richer” dynamics can account for this characteristic, which incorporates the increased buying power of more influential companies, and in turn results in even higher control. We conclude that this kind of centralized structure can emerge without it being an explicit goal of these companies, or as a result of a well-organized strategy.
I Introduction
The worldwide network of company ownership provides crucial information for the systemic analysis of the world economy Schweitzer et al. (2009); Farmer et al. (2012). A complete understanding of its properties and how they are formed has a wide range of potential applications, including assessment and evasion of systemic risk Battiston et al. (2012), collusion and antitrust regulation Gulati et al. (2000); Gilo et al. (2006), market monitoring Diamond (1984); Chirinko and Elston (2006), and strategic investment Teece (1992). Recently, Vitali et al Vitali et al. (2011) inferred the network structure of global corporate control, using the Orbis 2007 marketing database 111http://www.bvdinfo.com/products/company-information/international/orbis. Analyzing its structure, they found a tightly connected “core” made of a small number of large companies (mostly financial institutions) which control a significant part of the global economy. A central question which arises is what is the dominant mechanism behind this centralization of control. The answer is not obvious, since the decision of firms to buy other firms can be driven by diverse goals: Banks act as financial intermediaries doing monitoring for uninformed investors Diamond (1984); Chirinko and Elston (2006), managers can improve their power by buying other firms instead of paying dividends Jensen (1986), speculation on stock prices as well as dividend earnings can be a significant source of revenue Modigliani and Miller (1958); La Porta et al. (2000); Jensen (1986), and companies can have strategic advantages, e.g. due to knowledge sharing Teece (1992); Hamel (1991); Dyer and Singh (1998). Another possible hypothesis for control centralization is that managers collude to form influential alliances: Indeed, agents (e.g. board members) often work for different firms in central positions Battiston and Catanzaro (2004). Although all these factors are likely to play a role, we here investigate a different hypothesis, namely that a centralized structure may arise spontaneously, as a result of a simple “richt-get-richer” dynamics Simon (1955), without any explicit underlying strategy from the part of the companies. We consider a simple adaptive feedback mechanism Gross and Blasius (2008), which incorporates the indirect control that companies have on other companies they own, which in turn increases their buying power. The higher buying power can then be used to buy portions of more important companies, or a larger number of less important ones, which further increases their relative control, and progressively marginalizes smaller companies. We show that this simple dynamical ingredient suffices to reproduce many of the qualitative features observed in the real data Vitali et al. (2011), including the emergence of a core-periphery structure and the relative portion of control exerted by the dominating core. Although this does not preclude the possibility that companies may take advantage and further consolidate their privileged positions in the network, it does suggest that deliberate strategizing may not be the dominating factor which leads to global centralization.
II Model description
We consider a network of companies, where a directed edge between two nodes means company owns a portion of company . The relative amount of which owns is given by the matrix (i.e. the ownership shares), such that . We note that it is possible for self-loops to exist, i.e. a company can in principle buy its own shares. In the following, we describe a model with two main mechanisms: 1. The evolution of the relative control of companies, given a static network; 2. The evolution of the network topology via adaptive rewiring of the edges.
II.1 Evolution of control
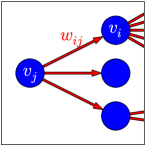
Here we assume that if owns , it exerts some influence on in a manner which is proportional to . If we let describe the relative amount of control a company has on other companies, we can write
| (1) |
where is the adjacency matrix, the parameter determines the propagation of control and is an intrinsic amount of independence between companies 222Eq. 1 can be seen as a weighted version of the Katz centrality index Katz (1953), which is one of many ways of measuring the relative centrality of nodes in a directed network, such as PageRank Page et al. (1999) and HITS Kleinberg (1999). It converges for and we enforce normalization with .. We further assume that the control value directly affects other features such as profit margins, and overall market influence, such that the buying power of companies with large is also increased. This means that the ownership of a company is distributed among the owners , proportionally to their control , i.e.
| (2) |
(see Fig. 1). These equations are assumed to evolve in a faster time scale, such that equilibrium is reached before the topology changes, as described in the next section.
II.2 Evolution of the network topology
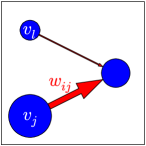
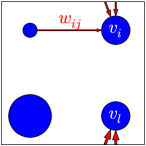
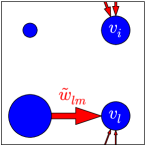
Companies may decide to buy or sell shares of a given company at a given time. The actual mechanisms regulating these decisions are in general complicated and largely unknown, since they may involve speculation, actual market value, and other factors, which we do not attempt to model in detail here. Instead, we describe these changes probabilistically, where an edge may be deleted or inserted randomly in the network, and such moves may be accepted or rejected depending on how much it changes the control of the nodes involved. For simplicity, we force the total amount of edges in the network to be kept constant, such that a random edge deletion is always accompanied by a random edge insertion. Such “moves” may be rejected or accepted, based on the change they bring to the values of the companies involved. If we let be the company which buys new shares of company , and which sells shares of company , the probability that the move is accepted is
| (3) |
where is computed before the move and afterwards, and the parameter determines the capacity companies have to foresee the advantage of the move, such that for all random moves are accepted, and for they are only accepted if the net gain is positive (see Fig. 2). Note that in Eq. 3 it is implied that companies with larger control will tend to buy more than companies with smaller control, which is well justified by our assumption that control is correlated with profit and wealth.
The overall dynamics is composed by performing many rewiring steps as described above, until an equilibrium is reached, i.e. the observed network properties do not change any longer. In order to preserve a separation of time scales between the control and rewiring dynamics, we performed a sufficiently large number of iterations of Eqs. 1 and 2 before each attempted edge move.
III Centralization of control
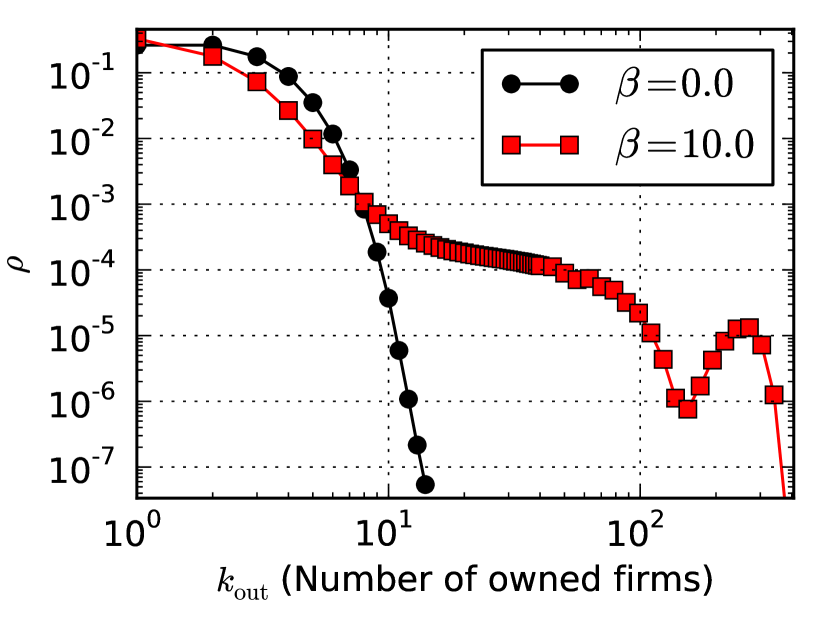
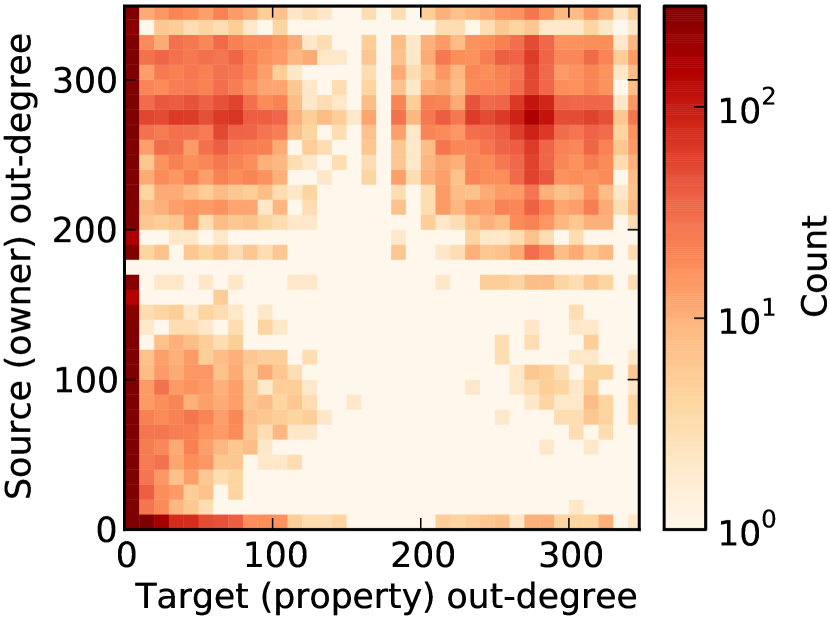
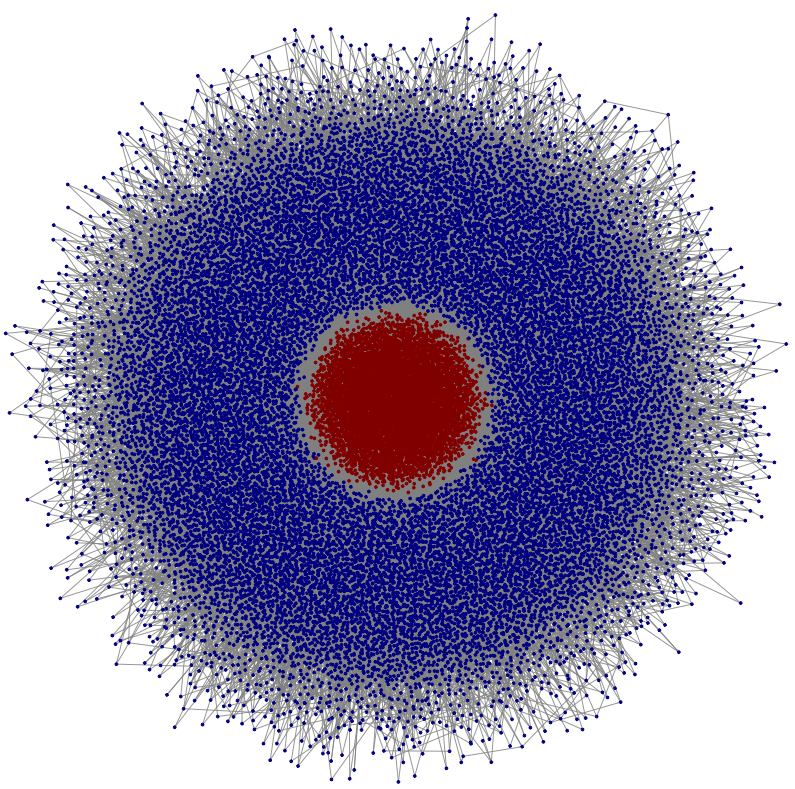
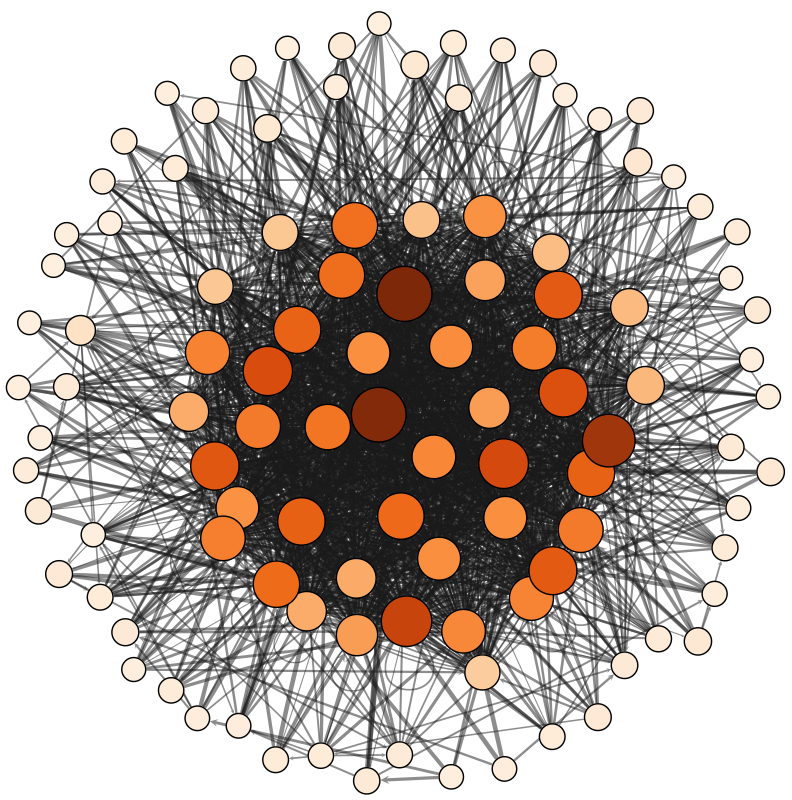
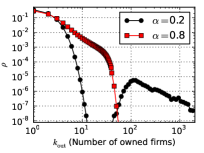
A typical outcome of the dynamics can be seen in Fig. 3 for a network with nodes and average degree , after an equilibration time of about steps. In contrast to the case with , which results in a fully random graph, for a sufficiently high value of the distribution of firm ownerships (i.e. the out-degree of the nodes) becomes very skewed, with a bimodal form. We can divide the most powerful companies into a broad range which owns shares from to about other companies, and a separate group with . The correlation matrix of this network shows that these high-degree nodes are connected strongly among themselves, and own a large portion of the remaining companies (see Fig. 3). This corresponds to a highly connected “core” of about 45 nodes with , which is highlighted in red in Fig. 3c and can be seen separately in Fig. 3d. The distribution of in-degree (not shown) is bimodal as well with highest values for the inner core. With values up to , the highest in-degree (number of owners) is considerably below the highest out-degree (number of firms owned at once).
(a)
(b)
(c)
(d)
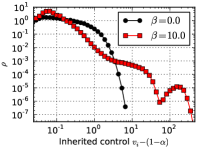
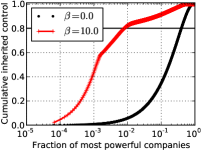
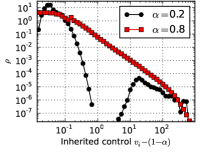
Similarly to the out-degree, the distribution of control values is also bimodal for larger values of , as can be seen in Fig. 4, and is strongly correlated with the out-degree values. The total fraction of companies controlled by the most powerful ones is very large, as shown on the right panel of Fig. 4. For instance, we see that a fraction of around of the central core controls about of all companies. The companies with intermediary values of control (and out-degree) also possess a significant part of the global control, e.g. around of the most powerful control an additional of the network. It is important to emphasize the difference between these two classes of companies for two reasons: Firstly the inner core inherits control from intermediate companies without the need to gather up all the minor companies. In fact the ownership links going out from the inner core (about ) is enough to cover the direct control of only a third of all companies, while the effective control is more than a half. Secondly, the fraction of intermediary companies increases for larger networks. For a network with , the inner core includes a fraction of only , controlling an effective of the total companies. Nonetheless, all the most powerful companies together account for around of the network and of the total control; values which do not change considerably with system size.
Let us compare the results presented so far with empirical data presented in Vitali et al. (2011). For different reasons, this comparison can only be qualitative. First of all, the empirical data includes economic agents with different functions (shareholders, transnational companies and participated companies) out of different sectors (eg. financial and real economy), while we consider identical agents. Secondly, we force every company to be owned 100%, while the empirical data neglects restrained shares and diversified holdings. Thirdly, the control analysis in Vitali et al. (2011) is done somewhat differently: All the economic agents were considered for the topological characterization, while many companies (80% of all agents there) were neglected for the control analysis. In the empirical data, a strongly connected component of companies controls more than a half of all companies arranged in the out component. This concentration is compatible with the core-periphery structure presented in Fig. 3, however the empirical data does not show a distinct bimodal structure. Nonetheless, there are highly connected substructures in the core, e.g. a structure with 22 highly connected financial companies () was highlighted in Battiston et al. (2012). The control concentration in the empirical data was reported as a fraction of which controls of the network. This is similar to the results of our model (see Fig. 4 on the right). There are, however, features that our model does not reproduce, the most important of which being the out-degree distribution of the network, which in Vitali et al. (2011) is very broad, and displays no discernible scales, where in our case it is either bimodal or Poisson-like. One possible explanation for this discrepancy is that we have focused on equilibrium steady-state configurations of the dynamics, whereas the real economy is surely far away from such an equilibrium. A more precise model would need to incorporate such transient dynamics in a more realistic way. Nevertheless, the general tendency of the control to be concentrated on relatively few companies is evident in such equilibrium states, and features very prominently in the empirical data as well.
III.1 Transition to centralization
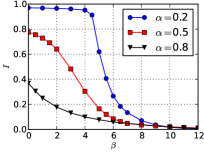
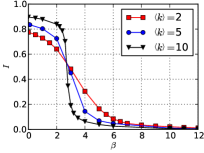
To investigate the transition from homogeneous no centralized networks with increasing , we measured the inverse participation ratio with the time summing over a sufficiently long time window of length after equilibration. Since , we expect in the perfectly homogeneous case where for all nodes, and if only one node has , and the control is maximally concentrated. As can be seen in Fig. 5, we observe a smooth transition from very homogeneous companies connected in fully random manner for , to a pronounced concentration of control for increased , for which the aforementioned core-periphery is observed. The transition becomes more abrupt when either the average degree is increased or the parameter (which determines the fraction of inherited control) is decreased.
Centralization of control can emerge in different ways depending on the parameters and . In Fig. 6, it is shown that different values of for a high value of can lead to a detached controlling core () or to broadly distributed control values (). With smaller values of , indirect control is suppressed and companies can gain power only by owning large numbers of marginal companies. E.g.: for , this leads to a highly connected core of companies having , the rest of the companies have very little influence. For larger values of , indirect control has a larger effect, which leads to a hierarchical network where companies with small numbers of owned firms may nevertheless inherit large control values . The case with and shown in Figs. 3 and 4 exhibits a mixture of these two scenarios. The transition to a centralized core also occurs when increasing and keeping constant (see right panel in Fig. 5).
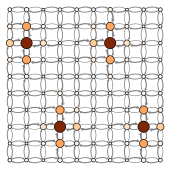
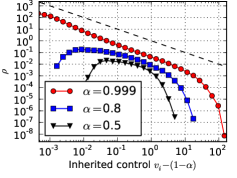
One interesting aspect of the centralization of control as we have formulated is that it is not entirely dependent on the adaptive dynamics, and occurs also to some extent on graphs which are static. Simply solving Eqs. 1 and 2 will lead to a non-trivial distribution of control values which depend on the (in this case fixed) network topology and the control inheritance parameter . In Fig. 7 is shown on the left the control values obtained for a square lattice with periodic boundary conditions, and bidirectional edges. What is observed is a spontaneous symmetry breaking, where despite the topological equivalence shared between all nodes, a hierarchy of control is formed, which is not unique and will vary between each realization of the dynamics. A similar behavior is also observed for fully random graphs, as shown on the right of Fig. 7, where the distribution of control values becomes increasingly broader for larger values of , asymptotically approaching a power-law for . This behavior is similar to a phase transition at , where at this point Eq. 1 no longer converges to a solution.
IV Conclusion
We have tested the hypothesis that a rich-get-richer process using a simple, adaptive dynamics is capable of explaining the phenomenon of concentration of control observed in the empirical network of company ownership Vitali et al. (2011). The process we proposed incorporates the indirect control that companies have on other companies they own, which increases their buying power in a feedback fashion, and allows them to gain even more control. In our model, the system spontaneously organizes into a steady-state comprised of a well-defined core-periphery structure, which reproduces many qualitative observations in the real data presented in Vitali et al. (2011), such as the relative portion of control exerted by the dominating companies. Our model shows that this kind of centralized structure can emerge without it being an explicit goal of the companies involved. Instead, it can emerge simply as a result of individual decisions based on local knowledge only, with the effect that powerful companies can increase their relative advantage even further.
It is interesting to compare our model to other agent based models featuring agents competing for centrality. The emergence of hierarchical, centralized states with interesting patterns of global order was reported for agents creating links according to game theory Holme and Ghoshal (2006); Lee et al. (2011); Do et al. (2010) as well as for very simple effective rules of rewiring according to measured centrality König and Tessone (2011); Bardoscia et al. (2013). The latter is combined with phase transitions according to the noise in the rewiring process. The stylized model of a society studied in Bardoscia et al. (2013) shows a hierarchical structure, if the individuals have a preference for social status. The intuitive emergence of hierarchy is associated with shrinking mobility of single agents within the hierarchy. This effect is present in our model as well and deserves further investigation.
Our results may shed light on certain antitrust regulation strategies. As we found that a simple mechanism without collusion suffices for control centralization, any regulation which is targeted to diminish such activities may prove fruitless. Instead, targeting the self-organizing features which lead to such concentration, such as e.g. limitations on the indirect control of shareholders representing other companies, may appear more promising.
References
- Schweitzer et al. (2009) F. Schweitzer, G. Fagiolo, D. Sornette, F. Vega-Redondo, A. Vespignani, and D. R. White, Science 325, 422 (2009).
- Farmer et al. (2012) J. D. Farmer, M. Gallegati, C. Hommes, A. Kirman, P. Ormerod, S. Cincotti, A. Sanchez, and D. Helbing, The European Physical Journal Special Topics 214, 295 (2012).
- Battiston et al. (2012) S. Battiston, M. Puliga, R. Kaushik, P. Tasca, and G. Caldarelli, Scientific reports 2 (2012).
- Gulati et al. (2000) R. Gulati, N. Nohria, and A. Zaheer, Strategic management journal 21, 203 (2000).
- Gilo et al. (2006) D. Gilo, Y. Moshe, and Y. Spiegel, RAND Journal of Economics , 81 (2006).
- Diamond (1984) D. W. Diamond, The Review of Economic Studies 51, 393 (1984).
- Chirinko and Elston (2006) R. S. Chirinko and J. A. Elston, Journal of Economic Behavior & Organization 59, 69 (2006).
- Teece (1992) D. J. Teece, Journal of Economic Behavior & Organization 18, 1 (1992).
- Vitali et al. (2011) S. Vitali, J. B. Glattfelder, and S. Battiston, PLoS ONE 6, e25995 (2011).
- Note (1) http://www.bvdinfo.com/products/company-information/international/orbis.
- Jensen (1986) M. Jensen, Corporate Finance, and Takeovers. American Economic Review 76 (1986).
- Modigliani and Miller (1958) F. Modigliani and M. H. Miller, The American Economic Review 48, 261 (1958).
- La Porta et al. (2000) R. La Porta, F. Lopez-de Silanes, A. Shleifer, and R. W. Vishny, The Journal of Finance 55, 1 (2000).
- Hamel (1991) G. Hamel, Strategic Management Journal 12, 83 (1991).
- Dyer and Singh (1998) J. H. Dyer and H. Singh, Academy of Management Review 23, 660 (1998).
- Battiston and Catanzaro (2004) S. Battiston and M. Catanzaro, The European Physical Journal B - Condensed Matter and Complex Systems 38, 345 (2004).
- Simon (1955) H. A. Simon, Biometrika 42, 425 (1955).
- Gross and Blasius (2008) T. Gross and B. Blasius, Journal of The Royal Society Interface 5, 259 (2008).
- Note (2) Eq. 1 can be seen as a weighted version of the Katz centrality index Katz (1953), which is one of many ways of measuring the relative centrality of nodes in a directed network, such as PageRank Page et al. (1999) and HITS Kleinberg (1999). It converges for and we enforce normalization with .
- Holme and Ghoshal (2006) P. Holme and G. Ghoshal, Physical Review Letters 96, 098701 (2006).
- Lee et al. (2011) S. Lee, P. Holme, and Z.-X. Wu, Physical Review Letters 106, 028702 (2011).
- Do et al. (2010) A.-L. Do, L. Rudolf, and T. Gross, New Journal of Physics 12, 063023 (2010).
- König and Tessone (2011) M. D. König and C. J. Tessone, Physical Review E 84, 056108 (2011).
- Bardoscia et al. (2013) M. Bardoscia, G. De Luca, G. Livan, M. Marsili, and C. J. Tessone, Journal of Statistical Physics 151, 440 (2013).
- Katz (1953) L. Katz, Psychometrika 18, 39 (1953).
- Page et al. (1999) L. Page, S. Brin, R. Motwani, and T. Winograd, Stanford Infolab , 17 (1999).
- Kleinberg (1999) J. M. Kleinberg, J. ACM 46, 604–632 (1999).