Magnetic structures of Mn3-xFexSn2: an experimental and theoretical study
Abstract
We investigate the magnetic structure of Mn3-xFexSn2 using neutron powder diffraction experiments and electronic structure calculations. These alloys crystallize in the orthorhombic Ni3Sn2 type of structure () and comprise two inequivalent sites for the transition metal atoms (4 and 8) and two Sn sites (4 and 4). The neutron data show that the substituting Fe atoms predominantly occupy the 4 transition metal site and carry a lower magnetic moment than Mn atoms. Four kinds of magnetic structures are encountered as a function of temperature and composition: two simple ferromagnetic structures (with the magnetic moments pointing along the or axis) and two canted ferromagnetic arrangements (with the ferromagnetic component pointing along the or axis). Electronic structure calculations results agree well with the low-temperature experimental magnetic moments and canting angles throughout the series. Comparisons between collinear and non-collinear computations show that the canted state is stabilized by a band mechanism through the opening of a hybridization gap. Synchrotron powder diffraction experiments on Mn3Sn2 reveal a weak monoclinic distortion at low temperature (90.08° at 175 K). This lowering of symmetry could explain the stabilization of the -axis canted ferromagnetic structure, which mixes two orthorhombic magnetic space groups, a circumstance that would otherwise require unusually large high-order terms in the spin Hamiltonian.
pacs:
75.25-j, 71.20.Lp, 61.50.KsI Introduction
Mn3Sn2 and its Fe derivatives Mn3-xFexSn2 (1) exhibit an uncommon two-peak magnetocaloric response in the 200-300 K temperature rangeMn3Sn2 ; Fe ; Cp which could be useful in future near room temperature magnetic cooling applications.Rev1 ; Rev2 These orthorhombic phases are isotypic with Ni3Sn2 () and comprise two inequivalent crystallographic sites for both the transition metal (4 and 8) and the tin atoms (4 and 4). cryst ; PRB
It has been shown that Mn3Sn2 undergoes three distinct magnetic transitions. Mn3Sn2 ; PRB At 262 K, the Mn 4 site orders ferromagnetically, with the Mn moments pointing along the axis, and polarizes the Mn 8 magnetic moments. The Mn 8 sublattice cooperatively orders at 227 K in a canted ferromagnetic arrangement with the ferromagnetic component along the axis and the antiferromagnetic one along the axis, while the ferromagnetic order of Mn 4 is unaltered. These two ferromagnetic-like second order transitions yield the two-peak magnetocaloric response. Finally, below 197 K the ferromagnetic component of both Mn 4 and Mn 8 abruptly reorients from the axis to the axis, the canting angle (51°) of Mn 8 being unchanged at the transition. Based on group theory arguments, it has been concluded that the magnetic structure below either requires unusually large high-order terms in the spin Hamiltonian or a (undetected) monoclinic distortion.PRB The low-temperature magnetic moments carried by Mn atoms are rather large, close to 2.3 and 3.0 for Mn 4 and Mn 8, respectively. From magnetization data,Fe it has been observed that the Fe for Mn substitution in Mn3-xFexSn2, which is limited to about 0.9, alters the magnetic behavior but leaves the magnetization roughly constant around 5.4 /f.u. throughout the series. The alloys with low Fe content (0.4) have transition temperatures very close to that of Mn3Sn2. A further increase in the Fe content yields an increase of up to 290 K in =0.9 as well as a decrease of and down to 171 K and 164 K, respectively. Interestingly, for the intermediate compositions (=0.5 and 0.6) only the two ferromagnetic-like transitions are present. There are further modifications in the shape of the thermomagnetic curves throughout the series which suggest that the Fe substitution does not simply result in a shift of the magnetic transition temperatures.
In this paper, we investigate the magnetic properties of Mn3-xFexSn2 alloys at a microscopic level using neutron powder diffraction experiments and band structure calculations. Further, we check from synchrotron diffraction measurements if a weak lowering of symmetry occurs in Mn3Sn2. The organization of the paper is as follows. Section II gives the experimental and computational details. In Sec. III, we present and analyze the neutron powder diffraction experiments on Mn3-xFexSn2 (00.8). Sec. IV gives the results of our collinear and non-collinear electronic structure calculations on Mn3Sn2 and Mn3-xFexSn2 as compared with experiments. Sec. V deals with temperature dependent X-ray synchrotron diffraction on Mn3Sn2. Finally, the paper is summarized in Sec. VI.
II Experimental and computational details
Powder neutron diffraction experiments were carried out at the Institut Laue Langevin (ILL), Grenoble (France) using the two axis D1B diffractometer (=2.52 Å, 128° position sensitive detector, step of 0.1°). The samples investigated here (with =0.1, 0.2, 0.3, 0.4, 0.5, 0.6, 0.7, and 0.8) were those used in reference Fe, . Note that the sample with =0.9 of ref. Fe, was excluded from the present study because of its high content in the binary FeSn impurity that might obscure the analysis of the neutron data. Numerous diffraction patterns were recorded in the 2-300 K temperature range for each alloy using a standard helium cryostat. The analysis of the neutron data was performed by Rietveld refinements using the Fullprof software.FullP Due to an imperfect monochromatization of the incident beam, the refinements were carried out by considering a second harmonic () contamination of 0.6% intensity. Besides the peak profile parameters, the refinements comprised scale factor, zero-shift, cell parameters, crystallographic positions, overall Debye-Waller factor, magnitude and orientation of the Mn/Fe moments. The Mn/Fe site occupancy ratio was determined from room temperature data ( in the paramagnetic state). In order to reduce the number of intensity dependent parameters, the occupancy ratios were kept fixed for the fits in the magnetically ordered state. The nuclear contribution from the impurities (MnSn2 and MnO) was taken into account during the refinements.
Powder synchrotron diffraction experiments were carried out at the Swiss Light Source (Paul Scherrer Institute, Viligen, Switzerland) using the MS-powder beam lineMS-line to check the occurrence of a possible weak lowering of symmetry. Due to time limitation, only the Mn3Sn2 parent compound has been investigated. Diffraction patterns were measured in glass capillaries (=0.3 mm) with standard Debye-Scherrer geometry using a multistrip detectorstrip (=0.7999 Å, calibrated using silicon standard from NIST). The one-dimensional detector allows for the measurements of entire diffraction patterns over 120° in a few seconds. Four diffraction patterns corresponding to four different positions of the detector were recorded in order to improve the Bragg intensity/background ratio. The patterns were recorded from 300 K down to 175 K using a cryo-jet device. The patterns were refined using the profile matching procedure of the Fullprof software FullP (Lebail decomposition) for extracting the temperature dependence of the lattice parameters. The lines profile was modeled with function 7 of Fullprof (Thompson-Cox-Hastings pseudo-Voigt convoluted with axial divergence asymmetry function). The instrumental function was determined using a small line-width sample (NAC; Na2Ca3Al2F4) as reference (half-width=0.024° at 2=23°).
The electronic structure calculations were performed using the Vienna ab initio simulation package (VASP) code, based on DFT within projector augmented wave (PAW) methodVASP with Perdew-Burke-Ernzerhof (PBE) parametrization.PBE Site-based magnetic moments were calculated using the Vosko-Wilk-Nusair interpolationVosko within the general gradient approximation (GGA) for the exchange-correlation potential. A -point grid of 13915 was used to discretize the first Brillouin zone and the energy convergence criterion was set to eV during the energy minimization process. The density of states (DOS) plots presented in this work were calculated on a dense (151917) -grid for high accuracy. The spin-orbit interaction was turned on during the non-collinear calculations.
The minimal, 20 atoms basis cell consists of twelve Mn atoms (situated on the Mn 4 and Mn 8 sites) and eight Sn atoms (situated on two distinct 4 positions) and was used to evaluate the total energies and magnetic properties of the alloys. The effect of partial replacement of Mn for Fe on the electronic structure was only considered into the 4 crystallographic site supported by experimental findings (discussed in Sec. III.1). Using this model, the effect of doping was simulated by the replacement of a manganese atom by iron which represents an =1/4 compositional change in the Mn3-xFexSnx formula. The experimental lattice parameters measured at 2 K were used for the calculations. For the non-collinear spin arrangements, we performed fully self-consistent calculations with the direction of the magnetic moments constrained into pre-set alignments (see Sec. IV for details). It must be emphasized that the amplitude of the moments could vary freely during the minimization process. The symmetry analysis was turned off for the calculations and the full set of -grid points was used. Finally, the band structure plots presented in this work were obtained from non-constrained solutions. This later was achieved from the constrained solutions by stepwise removal of the constrain from one run to another in order to keep the solution stable.
III Neutron diffraction study
III.1 Paramagnetic state
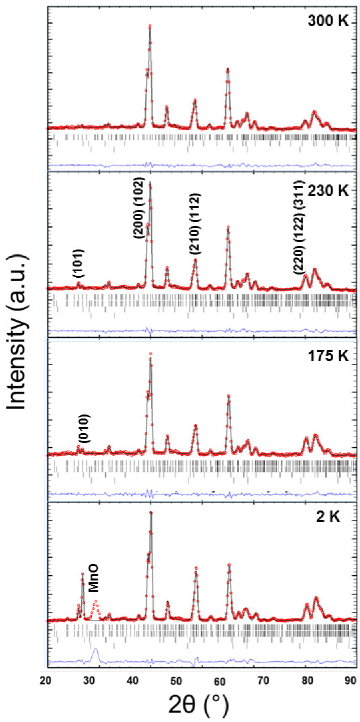
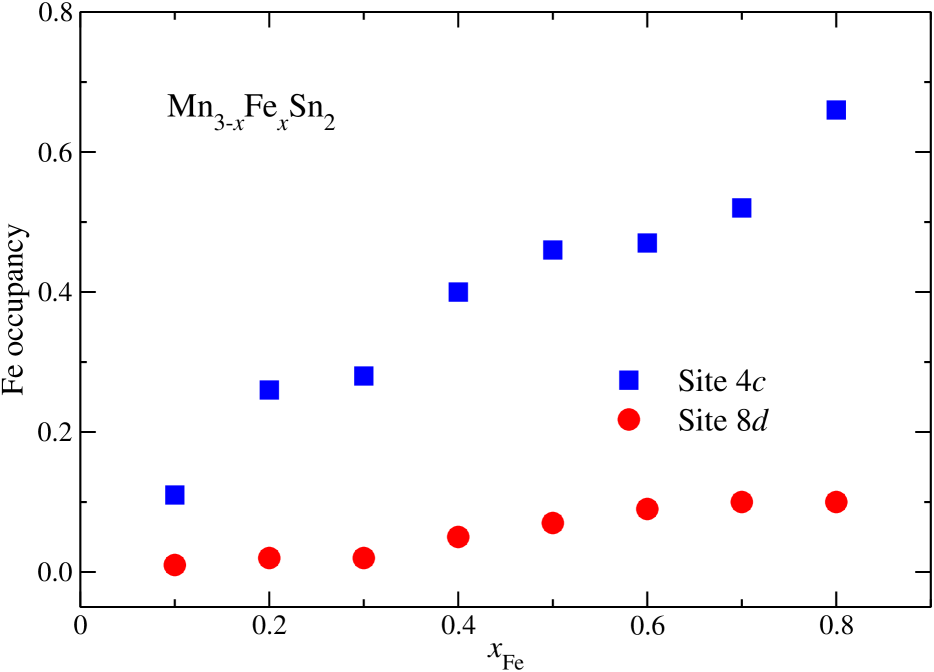
In all cases, the neutron diffraction pattern recorded at 300 K ( in the paramagnetic state, see top panel of Figure 1) comprises nuclear reflections from the Ni3Sn2-type main phase as well as tiny diffraction peaks originating from the MnSn2 and MnO impurities whose total amount represents a few wt.%. Refinements of the nuclear structure yield agreement factors close to 5%, indicating that no significant deviation from the Ni3Sn2 type of structure occurs throughout the series. Due to the marked difference between the bound coherent scattering lengths of Mn and Fe (=-3.73 fm, =9.45 fm), the Rietveld analysis of the neutron data allowed us to determine the atomic distribution of Mn and Fe on both sites available (4 and 8). The evolution of the Fe atomic distribution as a function of the Fe content is presented in Figure 2. It is found that Fe atoms preferentially occupy the 4 site, although the 8 site begins to be substituted in the richest Fe compositions.
III.2 Magnetically ordered state
| Position | |||
|---|---|---|---|
| 8 | |||
| 4 | |||
| 4 |
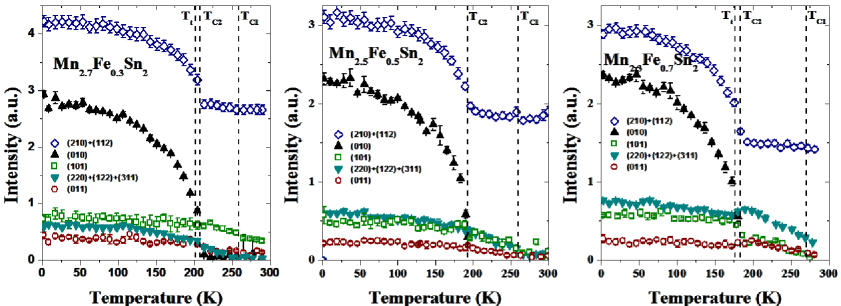
Refinements of the nuclear structure show that, within the accuracy of the measurements, the Ni3Sn2 type of structure () is stable down to 2 K. Besides the peaks corresponding to the space group, the neutron thermodiffractograms are characterized by the appearance of the anti- (010) reflection below (Figure 1) and by the growing of a peak at 228.7° due to the antiferromagnetic ordering of the MnO impurity below 120 K. Hence, in the whole ordered temperature range, the magnetic structures of Mn3-xFexSn2 alloys are commensurate associated with the propagation vector k=(0 0 0), similarly to the binary Mn3Sn2 parent compound.PRB However, there are important differences in the thermal dependence of the peak intensities which allow the classification of Mn3-xFexSn2 alloys into three groups (figure 3): alloys with 0.4, alloys with =0.5 and 0.6, and alloys with 0.7. The magnetic modesBertaut of the 4 and 8 sites for the two magnetic space groups of with k=(0 0 0) needed for the present neutron analysis are given in Table 1.
| =0.1 | =0.3 | |||||||
| 230 K | 200 K | 2 K | 230 K | 205 K | 2 K | |||
| Site 8 | Mode | |||||||
| 1.60(1) | 2.15(2) | 0.68(2) | 2.17(2) | |||||
| 1.11(4) | 1.36(3) | 0.87(4) | 1.18(4) | |||||
| 1.78(2) | 1.95(3) | |||||||
| ) | 1.11(4) | 2.10(2) | 2.79(2) | 0.87(4) | 1.39(3) | 2.92(2) | ||
| Site 4 | Mode | |||||||
| 1.58(5) | 1.92(3) | 1.44(5) | 1.79(4) | |||||
| 2.22(5) | 2.00(4) | |||||||
| ) | 1.58(5) | 1.92(3) | 2.22(5) | 1.44(5) | 1.79(4) | 2.00(4) | ||
| , (%) | 10.2, 8.0 | 7.9, 8.3 | 4.7, 8.9 | 15.1, 8.4 | 12.6, 9.3 | 6.4, 8.9 |
III.2.1 Alloys with 0.4
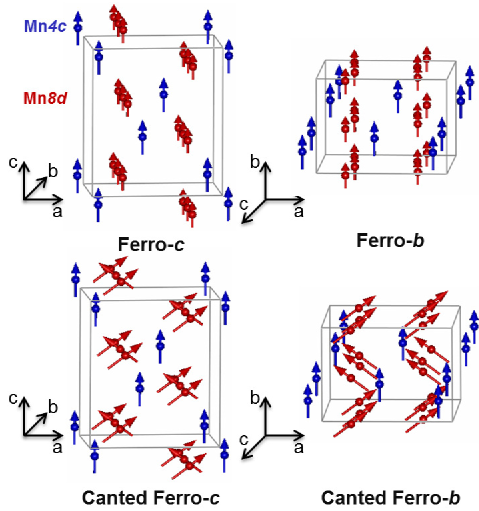
The alloys with 0.4 have a behavior similar to that of Mn3Sn2. Upon cooling from to there is a slight increase in the intensity of a few peaks, namely (101), (011) and (210)+(112). The appearance of the anti- (010) peak below is concomitant with a strong increase in the intensity of the (210)+(112) peaks. Finally, the third transition at yields an increase in the intensity of the (011) and (220)+(122)+(311) reflections together with a reduction in the intensity of the (101) peak (Figure 3). The neutron diffraction patterns of this group of alloys were consequently refined using the same sequence of magnetic structures than that prevailing in Mn3Sn2. This resulted in satisfactory fits with low magnetic () factors (4-12%). Other attempts yielded lower quality refinements with significantly higher factors. Between and , the alloys are simple ferromagnets with the magnetic moments of both 4 and 8 sites pointing along the axis ( and modes, respectively, of the magnetic space group ). We term this magnetic structure Ferro-. At , an antiferromagnetic component appears on the 8 site along the axis while the ferromagnetic component of both sites is preserved. Hence, between and the magnetic structure of the alloys with 0.4 is still described in the magnetic space group with a ferromagnetic 4 sublattice ( mode) and a canted ferromagnetic 8 sublattice ( configuration). This configuration is named Canted Ferro-. The canting angle weakly decreases upon increasing the Fe content (from 50° to 47°) but remains close to that in Mn3Sn2 (51°). Below , the ferromagnetic component of both sites reorients from the axis towards the axis. The low-temperature magnetic structure, termed Canted Ferro-, is then built upon a ferromagnetic 4 sublattice ( mode) and a canted ferromagnetic 8 sublattice (), which implies a mixing of the magnetic space groups and . The canting angle is unchanged at and below . The refined magnetic moment components and the main factors are given in Table 2.
III.2.2 Alloys with =0.5 and 0.6
| =0.5 | =0.6 | |||||||
| 230 K | 190 K | 2 K | 230 K | 130 K | 2 K | |||
| Site 8 | Mode | |||||||
| 0.64(2) | 1.76(2) | 1.52(2) | 1.67(2) | |||||
| 1.00(4) | 1.40(3) | 1.75(2) | 0.84(6) | 1.64(6) | 1.71(4) | |||
| ) | 1.00(4) | 1.54(3) | 2.48(3) | 0.84(6) | 12.24(5) | 2.48(3) | ||
| Site 4 | Mode | |||||||
| 1.15(5) | 1.42(4) | 1.78(5) | 1.20(6) | 1.42(7) | 1.69(5) | |||
| ) | 1.15(5) | 1.42(4) | 1.78(5) | 1.20(6) | 1.42(7) | 1.69(5) | ||
| , (%) | 12.2, 8.2 | 9.4, 8.1 | 4.6, 10.1 | 12.9, 13.1 | 9.5, 10.1 | 5.6, 10.1 |
The alloys with =0.5 and 0.6 behave differently. Beside the appearance of the anti- (010) reflection below and the concomitant increase in the intensity of the (210)+(112) peaks, there is no further perceptible anomaly and the intensity of the other magnetic lines continuously increases upon cooling below (Figure 3). This indicates that for =0.5 and 0.6 there is no spin reorientation, in agreement with the field-cooled magnetization data of reference Fe, . The best refinements (Table 3) show that upon cooling from down to both alloys are simple collinear ferromagnets (Ferro- magnetic structure), described in the magnetic space group , with the magnetic moments of both 4 and 8 sites pointing along axis ( and modes, respectively). Below , the appearance of the antiferromagnetic mode for the 8 position yields a canted ferromagnetic arrangement () for this site while the ferromagnetic configuration () of 4 position is kept. As is the case with the poorer Fe alloys, the magnetic space groups and are mixed in the low temperature Canted Ferro- magnetic structure of =0.5 and 0.6. Compared with the poorer Fe alloys, the canting angle is further reduced to reach 44° in Mn2.4Fe0.6Sn2. The refined magnetic moments are given in Table 3.
III.2.3 Alloys with 0.7
In addition to the transitions at and , the thermal dependence of the intensities for the richest Fe alloys signals the occurrence of a reorientation of the ferromagnetic components at . However, unlike the alloys with 0.4, the transition at yields a reduction in the intensity of the (011) and (220)+(122)+(311) lines as well as an increase in the intensity of the (101) line (Figure 3). The best refinements (Table 4) showed that these intensity changes correspond to a reorientation of the ferromagnetic component of both sites from the axis towards the axis upon cooling. Hence, between and , the alloys with 0.7 adopt the Ferro- configuration with magnetic moments of both sites oriented along the axis ( and modes of ). The appearance of the antiferromagnetic mode for the 8 position at leads to a canted ferromagnetic arrangement ( configuration) while the ferromagnetic alignment () of the 4 sublattice is kept. This Canted Ferro- structure, which implies a mixing of the magnetic space groups and , is stable over a small temperature interval down to , temperature at which the ferromagnetic components reorient towards the axis leading to the Canted Ferro- structure which involves magnetic modes ( and for the 8 and 4 positions, respectively) which all pertain to the magnetic space group . The canting angle, which does not change at and is insensitive to further temperature lowering, weakly decreases upon increasing the Fe content to reach 41° in Mn2.2Fe0.8Sn2.
| =0.7 | =0.8 | ||||||
| 230 K | 2 K | 230 K | 175 K | 2 K | |||
| Site 8 | Mode | ||||||
| 1.57(2) | 0.41(4) | 1.51(2) | |||||
| 1.75(7) | 1.75(4) | ||||||
| 1.12(5) | 1.24(4) | 1.51(5) | |||||
| ) | 1.12(5) | 2.35(6) | 1.24(4) | 1.57(5) | 2.31(4) | ||
| Site 4 | Mode | ||||||
| 1.25(6) | 1.17(6) | 1.21(6) | |||||
| 1.15(6) | 0.81(7) | ||||||
| ) | 1.15(6) | 1.25(6) | 0.81(7) | 1.17(6) | 1.21(6) | ||
| , (%) | 14.8, 11.3 | 12.3, 13.7 | 9.5, 9.1 | 8.1, 11.4 | 11.0, 7.7 | ||
III.3 (, T) magnetic phase diagram
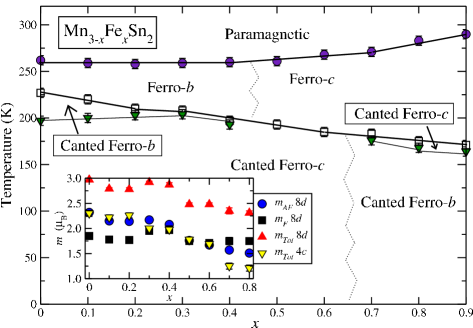
Combining the present data with those from references Mn3Sn2, ; Fe, ; PRB, allows the construction of the (, ) magnetic phase diagram as shown in Figure 5. The thick lines correspond to second-order transitions while thin lines are used for first-order transitions. The broken lines mark uncertain boundaries. Depending on iron content and temperature, four kinds of magnetic structure are identified: two ferromagnetic arrangements with moments along either the axis or axis (Ferro- and Ferro-, respectively) and two canted ferromagnetic configurations with ferromagnetic components along the axis or axis (Canted Ferro- and Canted Ferro-, respectively).
As shown in the inset of Figure 5, the iron doping also influences the magnitude of magnetic moments. The purely ferromagnetic moment on 4 site strongly decreases upon Fe substitution from 2.3 in Mn3Sn2 down to 1.2 in Mn2.2Fe0.8Sn2. Since the 4 site is predominantly populated by Fe atoms, this indicates that Fe carries a lower magnetic moment than Mn in these phases, as often observed in - intermetallic compounds (=Mn or Fe ; =metalloid).MnSn2 ; FeSn2 Regarding the magnetic moment on the 8 site, our neutron refinements show that its ferromagnetic component is almost constant throughout the series close to 1.8 . At the same time, the antiferromagnetic component strongly reduces upon doping from 2.3 in Mn3Sn2 down to 1.5 in Mn2.2Fe0.8Sn2, which results in a continuous reduction of the canting angle from 51° to 40° (see Figure 8(a)).
IV Electronic structure calculations
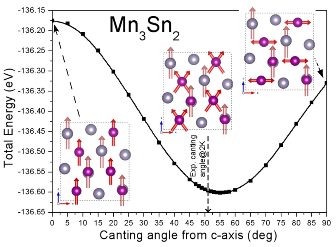
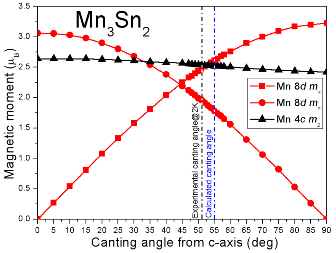
We first investigated the total energy dependence on the canting angle in the ground state (Canted Ferro- type magnetic structure) of the Mn3Sn2 parent alloy as shown in Fig. 6. The canting angle was constrained between 0 and 90° as displayed in the insets of Fig. 6. The minimum in the total energy was found at =55°, which is in a remarkable agreement with the value found experimentally (=51°). With the alteration of the canting angle, the amplitude of the magnetic moments on the 8 site projected along the crystallographic axis also adjusts accordingly; continuously increases at the expense of as shown in Fig. 7. Around =55°, values of =2.61 and =1.78 for Mn and =2.50 for Mn are calculated in agreement with the experimental values reported in reference PRB, (=2.32 and =1.85 for Mn and =2.30 for Mn ).
Experimentally, a strong site preference of the iron dopant to occupy the 4 crystallographic site in the orthorhombic lattice has been evidenced (see Sec. III.1 and Figure 2). This finding allows us to construct a simplified model based on a supercell where we only consider the replacement of the Mn atoms by Fe on the 4 site. The magnetic moments reorient both with increasing temperature (0.6) and with increasing Fe content (0.6) from the Canted Ferro- structure into the Canted Ferro- one (Fig. 4). Therefore we have performed constrained (angle) calculations for both spin arrangements. However, we have found that the difference in total energies are vanishingly small (in the range of eV) regardless of the applied quantization axis and it was not possible to converge the self-consistence solutions within a precision high enough that confidently allow us to distinguish the most stable orientation. Additionally, we find an almost zero orbital contribution to the magnetic moment, thus a simple picture of Mn being in a (Mn2+) state with zero orbital angular momentum can be drawn based on Hund’s rule with singly occupied levels. On the other hand, the variation of total energy with canting represents an energy term that is two orders of magnitude larger ( eV) than the spin-orbit coupling that suggests the exchange competition mainly contributing to the peculiar magnetic order.
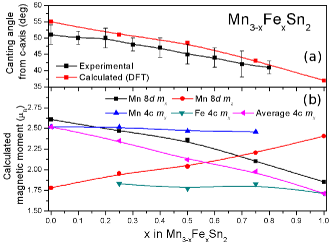
The comparison between the predicted and experimentally measured canting angles with Fe doping is plotted in Fig. 8(a). The calculated divergence of the magnetic moments from the quantization axis with Fe content follows closely the experimentally established values. As more Fe for Mn is introduced into the lattice, the canting angle closes in with the magnetic moments leaning towards a more ferromagnetic alignment. Fig.8(b) shows the site projected magnetic moments with Fe doping. The diminished magnetic moments along the axis () on the 8 site from 2.61 to 1.85 with Fe addition follows the simultaneous increase of from 1.78 to 2.41 . These changes reflect well the trends observed experimentally (see inset of Figure 5), though the increase in is not observed experimentally and the computed magnetic moments for the doped alloys tend to be higher than the experimental ones. These discrepancies might be due, at least partially, to our supercell model which does not take into account the weak occupancy of the 8 site by Fe atoms. Furthermore, the magnetic moment on the 4 site is influenced slightly by the doping and stays constant around 2.5 for Mn and 1.8 for the Fe atoms. Latter values do not seem to be influenced by the canting, suggesting strong ferromagnetic coupling among them and little magnetic interaction between the two sublattices which have been shown to magnetically order separately in Mn3Sn2.PRB
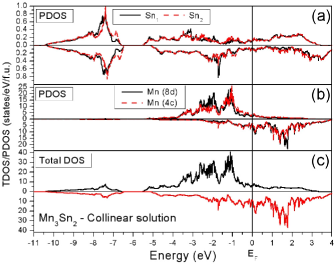
The partial density of states (PDOS) of Sn and Mn together with the total DOS (TDOS) for the collinear (FM) configuration are shown in Fig. 9. The metallic nature of the compound is apparent as both Mn and Sn contribute with finite states to the electronic structure, thus having bands crossing the Fermi level EF. The two inequivalent Sn sites have states distributed similarly in energy. The -states of Sn atoms show peaks at lower energy ranges of around -7 eV, whilst electrons with both - and -character are continuously present from about -5 eV to well above EF. The presence of the peak in the majority electron spin density around -3.2 eV that is only mirrored in the minority spin channel at around -1.7 eV points to a magnetic character of the Sn atoms. Indeed, the site-projected magnetic analysis reveals -0.06 and -0.04 moments for the two Sn sites caused by the proximity of large magnetic moments on the transition metal sites. These hybridization induced Sn magnetic moments are responsible for the large hyperfine fields measured by 119Sn Mössbauer spectroscopy in Mn3Sn2.PRB PDOS of the Mn-sites (Fig. 9b) indicates strongly exchange split bands. The energy landscape of the states is very similar for both Mn sites. We can identify a broad bunch of strongly hybridized peaks in the majority electron spin states between -3 and -1.6 eV. In this energy range, Mn atoms at the 8 site have significantly higher contribution than that from the 4. On the other hand, similar number of states is observed between -1.6 and -0.8 eV from both crystallographic sites. Latter bands are significantly narrower suggesting less hybridization compared to the ones mentioned above. The exchange split peaks in the minority electron spin states appear well above the Fermi level. Considering the 8 site dominated double peaks in the unoccupied states at around 1.7 eV, we estimate a very strong exchange energy between about 3.3 to 4 eV. On the other hand, the exchange energy related to the 4 site is considerably smaller around 2.2 to 3 eV.
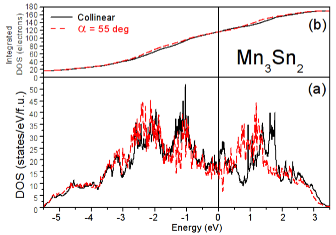
We now turn our attention to a qualitative comparison of the significant differences of the DOS between the FM and non-collinear (=55°) spin arrangements. Using non-collinear theory, we no longer distinguish spin-up and spin-down channels, therefore the total density of states in Fig. 10 is calculated as [Ntot=N↑+N↓] for the FM state in order to compare the two magnetic solutions. In other words, the collinear solution (black line) is another representation of the results shown in Fig. 9(c). The NC spin arrangement (red) causes the 8 site dominated double peaks in the unoccupied states (1.7 eV) to lower by about 0.4 eV, suggesting that smaller exchange energy is required to maintain the NC configuration. On the other hand, the occupied number of states between -1.6 and -0.8 eV, where both Mn sites have dominant contribution is reduced. However these states re-appear on the -3 and -1.6 eV energy range, where the electronic states at the 8 site is dominant. These changes are also reflected in the integrated DOS in Fig. 10 (top). From E=-3 eV, more occupied states are present for the NC spin arrangement than for the FM that lowers the total energy of the NC solution. In addition, the calculated total density of states at EF [Ntot(EF)=N↑+N↓] for the collinear FM case is (14.3 states/eV/f.u.) slightly higher than that for the non-collinear case (13.4 states/eV/f.u.). A stability criteria, whereby the high number of states can cause ferromagnetism unstable and promote a non-collinear AFM arrangement was reported earlier in similar Mn-based orthorhombic systems. Sredniawa2001266 ; Zach ; Alex_PRL ; Zsolt_PRB The tipping point, where FM density of states at EF becomes lower than that of the NC one is just bellow the EF by about -0.003 eV (), that could explain the occurrence of NC to FM transition at finite temperatures.
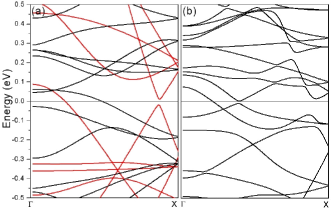
The comparison of the band dispersion relations in Fig. 11 indicates further distinctiveness between the two magnetic solutions related to the electronic structures around EF. In the NC case (right panel), some bands are pushed lower in energy as a result of less exchange splitting compared to the FM solution (left panel), in line with the observations from the DOS plots (Fig. 10). This feature is most apparent close to the point around the Fermi level. Another important consequence of the non-collinear spin arrangement is the opening of a hybridization gap around half way from the to point. This mechanism, where the bands hybridize with one another has been identified to stabilize non-collinearity. PRL_Band ; IrMnSi Based on the analysis of Lizàrraga ,PRL_Band the total energy can be lowered if a gap opens at the Fermi level by the hybridization of the orthogonal spin-up and spin-down states. Many new states contributing to this energy lowering mechanism can be obtained by a non-collinear spin arrangement, if there is a nesting between spin-up and spin-down Fermi surfaces at the ferromagnetic configuration. If the hybridization causes an opening of the band gaps around EF, the number of bands that cross it is reduced and the total energy of the system is lowered. Based on these observations, we can conclude that Mn3Sn2 also belongs to the class of non-collinear materials stabilized by this band mechanism.
V Synchrotron diffraction experiments
In the framework of Representation Analysis,Bertaut for describing the Canted Ferro- magnetic structure, which involves the , and modes, it is necessary to mix the two orthorhombic magnetic space groups and . As discussed in reference PRB, for Mn3Sn2, within which this canted state is stabilized below , two possible mechanisms have been identified to explain this uncommon situation. The first one requires the presence of unusually large high-order non-Heisenberg termsnon-Heisenberg in the spin Hamiltonian.Bertaut The other one implies the occurrence of a weak (undetected from neutron diffraction) monoclinic distortion. The magnetic space groups and have the monoclinic magnetic space group (notice the non-conventional setting) as intersection. In the monoclinic space group , the Mn atoms occupy three 4 positions. The basis functions , and all belong to the relevant irreducible representation of (Table 1). Therefore, if the distortion is present, it is then not necessary to mix different monoclinic magnetic space group to describe the Canted Ferro- magnetic structure.
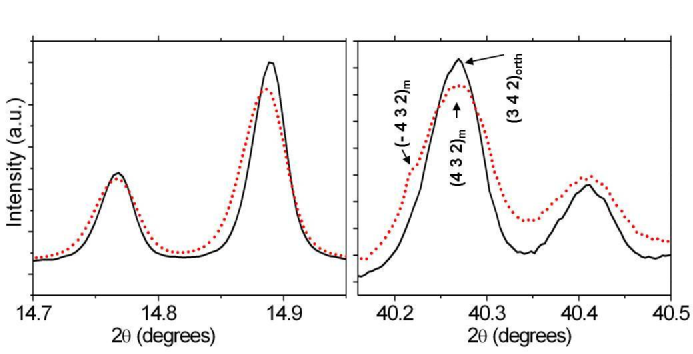
To check the latter possibility, we have undertaken X-ray diffraction experiments using synchrotron radiation on the Mn3Sn2 parent compound in the 175-300 K temperature range. The Mn3Sn2 sample presents a good crystallinity as the half-width measured at 300 K is 0.038° at 2, close to the instrumental resolution (see Section I). At 300 K, the line broadening was interpreted from microstructural effects (size and microstrain). A weak supplementary broadening of the diffraction peaks is observed upon cooling (Figure 12). This effect, which cannot be ascribed to crystallites size change, might be indicative of a lowering of symmetry although we did not find any clear evidence of marked splitting down to 175 K (the lowest temperature of the experiment) but instead a shouldering of some diffraction lines at high enough diffraction angles (Figure 12).
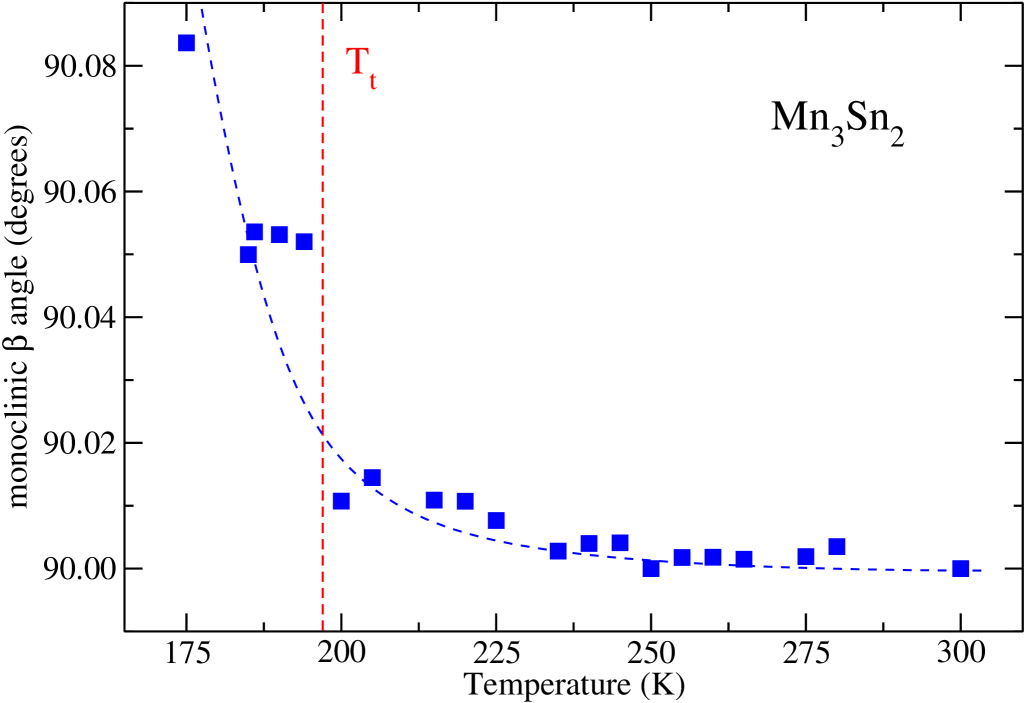
We first tested refining a few synchrotron diffraction patterns using the three possible monoclinic subgroups of : , , and . A total of 22 parameters was refined for the 300 K pattern: 1 for the zero-shift, 9 for the crystallites size, 9 for the strains, 3 for the lattice (the monoclinic angle was kept fixed at 90°). The refined 300 K pattern was used as a reference for those recorded at lower temperature. The 18 (9+9) microstructural parameters were kept fixed at their refined 300 K values while the angle was let free to vary. Consequently, only 5 parameters were refined for temperature below 300 K: the zero-shift and the 4 lattice parameters (, , , and ). The space group does not allow to take into account the peak broadening upon cooling contrary to the and space groups. leads however to significantly better fits than (2.0 2.6). The synchrotron diffraction patterns were therefore all refined using the space group ( ; ; ). In all cases, and factors converge satisfactorily to values lower than 5%. The temperature dependence of the refined monoclinic angle is presented in Figure 13. Upon cooling, the angle remains equal to 90° down to about 200 K, temperature below which it increases to reach =90.083(1)° at 175 K. Thus there is a weak but clear monoclinic distortion of the orthorhombic cell of Mn3Sn2 for temperatures below the spin reorientation temperature (197 K) previously evidenced by neutron diffraction and 119Sn Mössbauer spectroscopy.PRB Based on these new evidences, we can conclude that the Canted Ferro- magnetic structure of Mn3Sn2 occurring below can be explained by a weak monoclinic distortion and therefore is not due to the presence of unusually large high-order terms in the spin Hamiltonian. Experiments performed down to lower temperatures, and preferentially with an even higher resolution diffractometer, should reveal the full magnitude of the distortion. It is likely that this distortion holds in Mn3-xFexSn2 with 0.6, which all adopt the Canted Ferro- magnetic structure at low temperature (see Figure 5). For 0.7 this magnetic arrangement is only stabilized over a restricted interval at intermediate temperatures. It could be interesting to verify how the iron substitution alters the cell distortion and, in particular, if for 0.7 the monoclinic distortion manifests only in an intermediate temperature range before to disappear upon further cooling, as previously observed for instance in YVO3.YVO3
VI Summary
We have studied the magnetocaloric Mn3-xFexSn2 alloys (0.8) using neutron powder diffraction and DFT calculations. In addition, the Mn3Sn2 parent compound has been examined by synchrotron diffraction. We found that the Mn3-xFexSn2 alloys can be classified into three groups according to the thermal evolution of their magnetic structures. The alloys with 0.4 behave similarly to Mn3Sn2: they order in the Ferro- arrangement at , adopt the Canted Ferro- configuration between and before the ferromagnetic components reorient at to yield the Canted Ferro- structure. The richest Fe alloys (=0.7 and 0.8) show an almost reverted sequence as they order in the Ferro- structure at and evolve into the Canted Ferro- arrangement over a limited temperature interval between and , a temperature below which they adopt the Canted Ferro- configuration. There is no spin reorientation for the intermediate iron contents (=0.5 and 0.6) which order in the Ferro- structure below and transform directly towards the Canted Ferro- arrangement at . The Fe atoms are found to preferentially localize on the 4 transition metal site whose magnetic moment decreases upon increasing , suggesting lower magnetic moment on Fe atoms than on Mn atoms in these phases as confirmed by DFT computations. The magnetic moments and canting angle calculated using non-collinear computations agree well with the experimental data throughout the series. The comparison with collinear theory indicates that the canted ferromagnetic states are stabilized by the opening of a hybridization gap. Temperature dependent synchrotron diffraction experiments on Mn3Sn2 performed in the 175-300 K temperature range show that its cell undergoes a weak monoclinic distortion below (90.08° at 175 K). Consequently, it is unnecessary to invoke fourth or higher order terms in the spin Hamiltonian to explain the Canted Ferro- magnetic structure since in monoclinic symmetry the two involved and magnetic modes both pertain to the same irreducible representation.
Acknowledgments
We are indebted to the Institut Laue Langevin for the provision of research facilities. We are grateful to our local contact (S. Capelli) for her help during the recording of the data. Financial support is acknowledged from EPSRC grant EP/G060940/1 (Z.G.). Computing resources provided by Darwin HPC and Camgrid facilities at The University of Cambridge and the HPC Service at Imperial College London are gratefully acknowledged. Finally, inset of Fig. 6 was prepared using VESTA open-source software. Momma
References
- (1) T. Mazet, H. Ihou-Mouko, and B. Malaman, Appl. Phys. Lett. 89, 022503 (2006).
- (2) Q. Recour, T. Mazet, and B. Malaman, J. Phys. D: Appl. Phys. 41, 185002 (2008).
- (3) Q. Recour, T. Mazet, and B. Malaman, J. Appl. Phys. 105, 033905 (2009).
- (4) E. Brück, O. Tegus, D.T.C. Thanh, K.H.J. Buschow, J. Magn. Magn. Mater. 310, 2793 (2007).
- (5) V. Franco, J.S. Blàzquez, B. Ingale, and A. Conde, Annu. Rev. Mater. Res. 42, 305 (2012).
- (6) M. Stange, H. Fjellvg, S. Furuseth, and B. C. Hauback, J. Alloys Compd. 259, 140 (1997).
- (7) T. Mazet, Q. Recour and B. Malaman, Phys. Rev. B 81, 174427 (2010).
- (8) J. Rodriguez-Carvajal, Physica B 192, 55 (1993).
- (9) B.D. Patterson, R. Abela, H. Auderset, Q. Chen, F. Fauth, F. Gozzo, G. Ingold, H. Kühne, M. Lange, D. Maden, D. Meister, P. Pattison, T. Schmidt, B. Schmitt, C. Schulze-Briese, M. Shi, M. Stampanoni, and P.R. Willmott, Nucl. Instr. and Meth. A 540, 42 (2005).
- (10) A. Bergamaschi, C. Broennimann, R. Dinapoli, E. Eikenberry, F. Gozzo, B. Henrich, M. Kobas, P. Kraft, B. Patterson, and B. Schmitt, Nucl. Instr. and Meth. A 591,163 (2008).
- (11) G. Kresse and J. Furthmuller, Phys. Rev. B 54, 11169 (1996).
- (12) J.P. Perdew, K. Burke, and M. Ernzerhof, Phys. Rev. Lett. 77, 3865 (1996).
- (13) S.H. Vosko, L. Wilk, and M. Nusair, Canadian J. Phys. 58, 1200 (1980).
- (14) P. Schobinger-Papamantellos, J. Phys. Chem. Solids 39, 197 (1978).
- (15) G. Rousse, J. Rodriguez-Carvajal, C. Wurm, and C. Masquelier, Chem. Mater. 13, 4527 (2001).
- (16) E.F. Bertaut, Acta Crystallogr. Sect. A: Found. Crystallogr. 24, 217 (1968).
- (17) L.M. Corliss and J.M. Hastings, J. Appl. Phys. 34, 1162 (1963).
- (18) G. Venturini, D. Fruchart, J. Hübsch, G. Le Caër, B. Malaman, and B. Roques, J. Phys. F: Met. Phys. 15, 427 (1985).
- (19) B. Sredniawa, R. Zach, P. Formal, R. Duraj, A. Bombik, J. Tobola, S. Kaprzyk, S. Niziol, D. Fruchart, M. Bacmann, , J. Alloys Compd. 317-318, 266 (2001).
- (20) R. Zach, J. Tobola, B. Sredniawa, S. Kaprzyk, M. Guillot, D. Fruchart, and P. Wolfers, J. Phys.: Cond. Matter 19, 376201 (2007).
- (21) A. Barcza, Z. Gercsi, K.S. Knight, and K.G. Sandeman, Phys. Rev. Lett. 104, 247202 (2010).
- (22) Z. Gercsi, K. Hono, and K.G. Sandeman, Phys. Rev. B 83, 174403 (2011).
- (23) R. Lizàrraga, L. Nordström, L .Bergqvist, A. Bergman, E. Sjöstedt, P. Mohn, and O. Eriksson, Phys. Rev. Lett. 93, 107205 (2004).
- (24) T. Eriksson, L. Bergqvist, T. Burkert, S. Felton, R. Tellgren, P. Nordblad, O. Eriksson, and Y Andersson, Phys. Rev. B 71, 174420 (2005).
- (25) K. Momma and F. Izumi, J. Appl. Cryst. 41, 653 (2008).
- (26) E.L. Nagaev, Sov. Phys. Usp. 25, 31 (1982).
- (27) M. Reehuis, C. Ulrich, P. Pattison, B. Ouladdiaf, M.C. Rheinstädter, M. Ohl, L.P. Regnault, M. Miyasaka, Y. Tokura, and, B. Keimer, Phys. Rev. B 73, 094440 (2006).