Chirality dependence of the absorption cross-section of carbon nanotubes.
Abstract
The variation of the optical absorption of carbon nanotubes with their geometry has been a long standing question at the heart of both metrological and applicative issues, in particular because optical spectroscopy is one of the primary tools for the assessment of the chiral species abundance of samples. Here, we tackle the chirality dependence of the optical absorption with an original method involving ultra-efficient energy transfer in porphyrin/nanotube compounds that allows uniform photo-excitation of all chiral species. We measure the absolute absorption cross-section of a wide range of semiconducting nanotubes at their transition and show that it varies by up to a factor of 2.2 with the chiral angle, with type I nanotubes showing a larger absorption. In contrast, the luminescence quantum yield remains almost constant.
The versatility of the physical properties of Single-Wall carbon Nanotubes (SWNTs) with respect to their geometry (the so-called chiral species) is very attractive for applications Avouris et al. (2008); Lauret et al. (2004); Kostarelos et al. (2009); Liu et al. (2009), but on the other hand, the uncontrolled mixtures of species produced by regular synthesis methods blur out their specific properties. Post-growth sorting methods now allow to enrich samples in some specific species Arnold et al. (2006), but they also miss a tool for the quantitative assessment of their outcome. Optical techniques such as absorption, photoluminescence (PL) or resonant Raman spectroscopies are the primary tools to this end. However, these techniques can neither give a quantitative estimate of the species concentration nor their relative abundance to-date because they miss the knowledge of the ()-dependence of the optical cross-section at the nanotubes’ resonances ( and ). Although several studies pointed that the optical properties of carbon nanotubes depend on their chiral angle, they all actually dealt with a combination of physical parameters (such as absorption cross-section, Raman scattering cross-section or PL quantum efficiency). As a result, the literature gives quite contradictory or inconclusive results, some of them pointing to a larger abundance of near armchair nanotubes (interpreted as energetically favored in the growth process) whereas other studies concluded for a larger optical cross-section for large chiral angles Bachilo et al. (2002); Miyauchi et al. (2004); Okazaki et al. (2006); Jorio et al. (2006); Luo et al. (2006).
Here, we propose an original method for assessing the chirality dependence of the absorption cross-section of semiconducting carbon nanotubes, by means of non-covalent functionalization with tetraphenyl porphyrin (TPP) molecules (Inset of Figure 1). This functionalization gives rise to an extremely efficient energy transfer Roquelet et al. (2010) that allows to excite uniformly the whole set of carbon nanotubes regardless of their chirality. By comparison with the PL signal obtained in the regular excitation scheme (on the intrinsic transition of the SWNTs) of the same sample, we can single out the contribution of the absorption cross-section in the chiral dependence of the PL intensity. We show that the main variation of this absorption cross-section comes from the chiral angle 111, see e.g. Reich2004 and fits well to the inverse of the geometrical parameter , where (mod 3) stands for the family type: (resp. ) for the so-called type II (resp. type I) nanotubes. In contrast, we show that the PL quantum yield hardly depends on the chiral species. This opens the way to the quantitative analysis of the chiral species content of samples by means of optical tools.
The dependence of the optical cross-section of carbon nanotubes has been investigated theoretically by several teams. Computations by Reich et al. Reich et al. (2005), Oyama et al. Oyama et al. (2006) and Malic et al. Malic et al. (2006) suggest with different physical arguments that the absorption of the chiral species with small chiral angles and is intrinsically weaker. From an experimental point of view, several studies combining PL and Raman spectroscopies Jorio et al. (2006) or PL and TEM Okazaki et al. (2006) concluded for a sizable dependence of the optical signals. However, the specific dependence of the absorption cross-section could not be singled out. As a workaround, Tsyboulski et al. Tsyboulski et al. (2007) proposed to use empirical factors to estimate the abundance of each chirality based on the so-called action cross-section that combines the absorption cross-section at the transition and the photoluminescence quantum yield of the nanotubes. In total, a thorough experimental investigation of the chiral angle dependence of the absorption of SWNTs is still lacking despite the important metrological and applicative issues at stake.
Non purified HiPCO and CoMoCat nanotubes were functionalized with free-base tetraphenyl porphyrin (TPP) in aqueous solution by means of the micelle swelling method (see Ref. C. Roquelet, J. S. Lauret, V. Alain-Rizzo, C. Voisin, R. Fleurier, M. Delarue, D. Garrot, A. Loiseau, Ph. Roussignol, J. A. Delaire, and E. Deleporte (2010) for details). The optical absorption spectrum of the HiPCO nanotube/porphyrin compounds is shown in Figure 1.
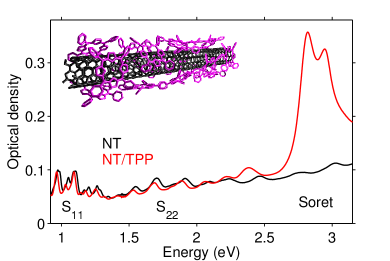
The resonance at 2.82 eV corresponds to the so-called Soret band of the TPP molecules stacked on the nanotube walls. The shoulder at 2.95 eV is the contribution of residual free porphyrins. The absorption bands in the 0.9-1.35 eV range correspond to the transitions of the various chiral species of nanotubes.
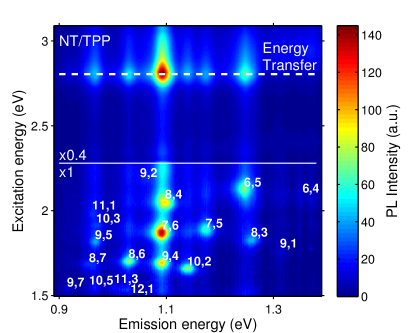
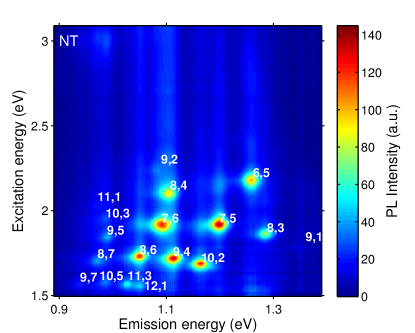
PL maps were recorded using an InGaAs detector and using the output of a monochromator illuminated by a UV-vis Xe lamp for the excitation (5 nm excitation steps). The PL intensity is normalized by the incoming photon flux at each excitation wavelength. The lower part of the PL map (Figure 10) displays several bright spots that correspond to the emission of carbon nanotubes at their transition upon excitation on their transition. Each spot can be assigned to a specific chiral species following the procedure proposed by Bachilo et al. Bachilo et al. (2002). An additional set of resonances can be seen at the same emission energies for an excitation at 2.82 eV. This energy corresponds to the absorption of the porphyrin molecules stacked on the nanotube. We assign these spots to the resonant excitation of the Soret transition of porphyrin followed by energy transfer to the nanotube and by the regular emission of the nanotubes
Roquelet et al. (2010); G. Magadur, J.S. Lauret, V. Alain-Rizzo, C. Voisin,
Ph. Roussignol, E. Deleporte, and J.A. Delaire. (2008); J.P. Casey, S.M. Bachilo, and R.B.
Weisman (2008); Sprafke et al. (2011). In other words, the emission of the nanotubes is enhanced when the excitation is tuned in resonance with the porphyrin molecules. As can be seen qualitatively in the figure, this resonance appears for all chiral species. Therefore, this energy transfer resonance provides a new handle to achieve uniform photo-excitation of the whole set of chiral species.
This PL map allows us to compare the optical properties of the different chiral species of nanotubes and infer their intrinsic absorption cross-sections. Let us define, for each species, the ratio between the PL intensities recorded for an excitation on the Soret resonance () or for an excitation on the intrinsic resonance () 222Note that the PL due to the intrinsic absorption of SWNTs at 2.82 eV represents about 15% of the total signal and was subtracted from for the calculation of . At the same time, we took into account the contribution of the nearby transition for the (9,7) and (8,7) species.. Provided that all spectra are normalized to the incoming photon flux, reads :
| (1) |
is proportional to (absorption cross-section of the TPP molecule), (number of molecules stacked on a nanotube per unit length), (energy transfer quantum yield), (species concentration) and (PL quantum yield of nanotubes). is proportional to (absorption cross-section of the nanotube at the transition per unit length), and Roquelet et al. (2010).
The important point here, is that is the ratio of two PL intensities measured on the same transition () for the same chiral species and for the same sample. Thus, this ratio allows to eliminate the contribution of the unknown PL quantum yield and the contribution of the unknown species concentration . This point is crucial since these two parameters are very difficult to measure, which is the main reason that has hampered the determination of in previous studies.
Finally, we have shown recently that both the direct and transfer excitation mechanisms share the same polarization diagram due to the reshaping of the electric field in the close vicinity of the nanotube Roquelet et al. (2012). As a consequence, polarization dependences are also eliminated in provided that polarized cross-sections are used in the calculation. Namely we obtain by using in (1), where stands for the average over random orientations (see SI).
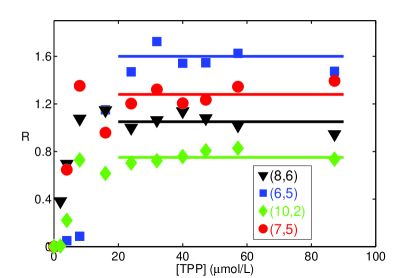
can bring an original insight into the dependence of provided that both the coverage and the transfer yield do not depend on the chiral species (see Eq. 1). To assess the coverage , we performed in a previous study a systematic analysis of the functionalization degree as a function of the amount of TPP molecules (C. Roquelet, J. S. Lauret, V. Alain-Rizzo, C. Voisin, R. Fleurier, M. Delarue, D. Garrot, A. Loiseau, Ph. Roussignol, J. A. Delaire, and E. Deleporte (2010) and SI). We found that all the spectroscopic signatures of functionalization reach a plateau above a critical TPP concentration while those of free TPP grow linearly. This is interpreted as the completion of a full single layer of TPP molecules on the nanotube. Molecular simulations show that the TPP/SWNT distance is 0.32 nm and that the average distance between TPP molecules is nm Correa and Orellana (2012). Therefore, only 3 TPP molecules can fit on the circumference of a nanotube for any of the species investigated in this study. Thus, we assume , with no dependence 333W. Orellana, private communication. Note that a coverage proportional to the diameter could also be considered. This would yield variations of 20% in the reported values which is of the order of the error bars and would not change the conclusions discussed in the following..
The transfer quantum yield was assessed in a former study and turned out to be of the order of 99.99% on average in a sample enriched in the (6,5) species Roquelet et al. (2010). One of methods used for this estimate relies on the average quenching of the bands luminescence of TPP molecules stacked on the nanotubes which is greater than . We observe the same quenching for unsorted nanotubes. Clearly, this would not be possible if the transfer yield was to be significantly lower for some chiral species. Therefore, we can safely state that the energy transfer occurs with an almost 100% efficiency for all chiral species observed in this sample. Note also that the time-resolved measurements reported in Ref. Garrot et al. (2011) support the same conclusion and give similar results for unsorted nanotubes.
We end up with the important result that is simply proportional to , the proportionality coefficient being the same for all chiral species. is thus a direct image of the relative variations of with the chiral species.
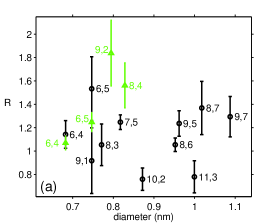
Practically, is estimated from a global fitting of the lines of the PL map (Figure 10, see SI for details). We were able to measure for 13 chiral species spanning a wide range of chiral angles and the 0.68 - 1.1 nm diameter range.
We find that , and hence , shows no clear dependence with respect to the nanotube diameter (see SI).
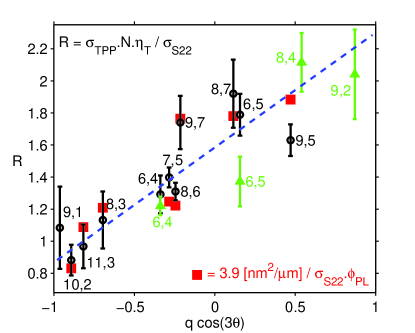
In contrast, Figure 3 shows a linear relationship between and the geometrical parameter . and hence strongly depend on the chiral angle regardless of the diameter and vary by up to a factor 2.2 for zigzag nanotubes of opposite families. Generally speaking, type I SWNTs show a larger absorption than their type II counterparts.
can be compared for each chiral species to the PL action cross-section reported in the literature Tsyboulski et al. (2007). This quantity is the product of the absorption cross section with the PL quantum yield . The inverse of the action cross section experimentally evaluated for individual pristine nanotubes by Tsyboulski et al. is reported in Figure 3, simply scaled by an arbitrary factor. Obviously, and share the same variations with . This excellent agreement between the two sets of data is particularly remarkable for they stem from different types of samples and were obtained with different setups and methods. This strongly supports our conclusion that reflects intrinsic properties of the nanotubes, independently of the excitation scheme through the porphyrins.
This new insight into the chiral dependence of the absorption cross-section is extremely valuable for assessing the relative abundance of chiral species in a sample and can be used to revisit the previous chiral species abundance assessment deduced from absorption or PL measurements Bachilo et al. (2002). The absorption corrected data lead to much more symmetric chiral angle distributions, with no preferential type (I or II) of nanotubes (see SI). Retrospectively, the limited number of type II nanotubes observed in this study may be understood as a consequence of their lower absorption and thus reduced PL signal rather than weaker abundance. We note that even after correction near zigzag nanotubes are found to be less abundant raising questions about the underlying growth mechanism.
The dependence of the absorption of carbon nanotubes can be compared to theoretical models available in the literature. Especially, Oyama et al. computed explicitly the absorption cross-section on the transition for all the chiral species observed in this study Oyama et al. (2006). We report their data, simply scaled by an arbitrary factor, in Figure 4 together with the experimental absorption cross-sections evaluated in our study. The general trend is well accounted for by the calculations, with the largest absorption for , near zigzag nanotubes. In this model, this effect is a consequence of the trigonal warping of the band structure of graphene that leads to a chiral dependent matrix element for optical transitions. However, the calculations give an underestimated variation of the absorption cross section with the chiral angle. This may find its origin in many body effects or hybridization effects not included in the model, which can lead to additional dependences.
Finally, we can extract absolute estimates for the absorption cross-sections, by exploiting the knowledge of the absorption of the TPP molecule used as absorbing unit in the transfer process. Assuming the expressions for and discussed previously and an absorption cross-section cm2 (see SI), we deduce for the whole set of species (Figure 4 right scale and Table in SI). In particular, we can compare our estimate for the very few species for which absorption measurements have been reported in the literature, e.g. for the species Berciaud et al. (2008); Joh et al. (2011); Islam et al. (2004); Schneck et al. (2011); Oudjedi et al. (2013). Using completely different approaches, these studies yielded ranging from 3 to 300 nm2/m, as compared to our own estimate of nm2/m.
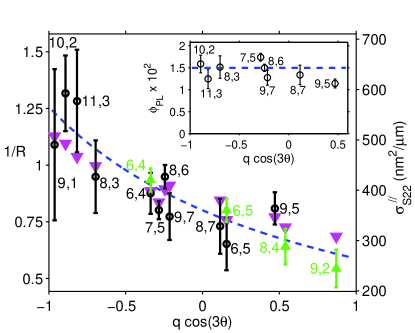
In addition, we can deduce the PL quantum yield of each species from the scaling factor between and the action cross-section of Ref. Tsyboulski et al. (2007) (Figure 3). We deduce from our absolute estimates of that is of the order of 1.4% in the sample of Ref Tsyboulski et al. (2007) for all chiral species. The spread of is of the order of 10% around this mean value (see Inset of Figure 3). This tends to show that the chiral dependence of the PL quantum yield is negligible in agreement with theoretical predictions Oyama et al. (2006); Malic et al. (2006) and more generally that most of the dependence in the nanotubes PL signal comes from the resonant absorption. Assuming that the non radiative relaxation processes do not strongly depend on the chiral species, we can further infer that the variation of with the chiral species must be much smaller than that of .
For practical purposes, we deduce from the linear fit to the data in Figure 3, a simple empirical expression for the absorption cross-section of a nanotube :
| (2) |
where is in nmm. This empirical formula provides an estimate with an uncertainty of about % and remains restricted to the case of small diameter () semi-conducting nanotubes. A possible generalization would obviously require an additional diameter dependence to be introduced in the empirical formula. This diameter dependence could not be included properly in this study since the diameter variations ( 20% around the mean value) are of the order of the experimental uncertainties.
In conclusion, we proposed an original method to address a key pending issue in the physics of carbon nanotubes : the chirality dependence of the absorption cross-section. We measured the absolute variations of this absorption cross-section and proposed an empirical law. In particular, we showed that the type I semi-conducting species show a significantly larger absorption than the type II species, whereas their PL quantum yield are almost identical. This study opens the way to quantitative analysis of the chiral species content of samples based on optical measurements. In addition, the tools developed in this study bring a new attractive feature : a uniform photo-excitation of the whole set of chiral species in a sample. This opens an avenue to the investigation of other intrinsic optical properties of SWNTs and to new approaches to the use of SWNTs in labeling applications.
Acknowledgement
FV and CR participated equally to this work. This work was supported by the
GDR-I GNT, the grant ”C’Nano IdF TENAPO” and the ANR grant ”TRANCHANT”. CV is a member of “ Institut Universitaire de France”.
References
- Avouris et al. (2008) P. Avouris, M. Freitag, and V. Perebeinos, Nature Photonics 2, 341 (2008).
- Lauret et al. (2004) J. S. Lauret, C. Voisin, G. Cassabois, J. Tignon, C. Delalande, P. Roussignol, O. Jost, and L. Capes, Applied Physics Letters 85, 3572 (2004).
- Kostarelos et al. (2009) K. Kostarelos, A. Bianco, and M. Prato, Nature Nanotech. 4, 627 (2009).
- Liu et al. (2009) Z. Liu, S. Tabakman, K. Welsher, and H. Dai, Nano Research 2, 85 (2009).
- Arnold et al. (2006) M. S. Arnold, A. A. Green, J. F. Hulvat, S. I. Stupp, and M. C. Hersam, Nat Nano 1, 60 (2006).
- Bachilo et al. (2002) S. M. Bachilo, M. S. Strano, C. Kittrell, R. H. Hauge, R. E. Smalley, and R. B. Weisman, Science 298, 2361 (2002).
- Miyauchi et al. (2004) Y. Miyauchi, S. Chiashi, Y. Murakami, Y. Hayashida, and S. Maruyama, Chem. Phys. Lett. 387, 198 (2004).
- Okazaki et al. (2006) T. Okazaki, T. Saito, K. Matsuura, S. Ohshima, M. Yumura, Y. Oyama, R. Saito, and S. Iijima, Chemical Physics Letters 420, 286 (2006).
- Jorio et al. (2006) A. Jorio, C. Fantini, M. A. Pimenta, D. A. Heller, M. S. Strano, M. S. Dresselhaus, Y. Oyama, J. Jiang, and R. Saito, Appl. Phys. Lett. 88, 023109 (2006).
- Luo et al. (2006) Z. Luo, L. D. Pfefferle, G. L. Haller, and F. Papadimitrakopoulos, J. Am. Chem. Soc. 128, 15511 (2006).
- Roquelet et al. (2010) C. Roquelet, D. Garrot, J. S. Lauret, C. Voisin, V. Alain-Rizzo, P. Roussignol, J. A. Delaire, and E. Deleporte, Appl. Phys. Lett. 97, 141918 (2010).
- Note (1) , see e.g. Reich2004.
- Reich et al. (2005) S. Reich, C. Thomsen, and J. Robertson, Phys. Rev. Lett. 95, 077402 (2005).
- Oyama et al. (2006) Y. Oyama, R. Saito, K. Sato, J. Jiang, G. G. Samsonidze, A. Grüneis, Y. Miyauchi, S. Maruyama, A. Jorio, G. Dresselhaus, and M. Dresselhaus, Carbon 44, 873 (2006).
- Malic et al. (2006) E. Malic, M. Hirtschulz, F. Milde, A. Knorr, and S. Reich, Phys. Rev. B 74, 195431 (2006).
- Tsyboulski et al. (2007) D. A. Tsyboulski, J.-D. R. Rocha, S. M. Bachilo, L. Cognet, and R. B. Weisman, Nano Lett. 7, 3080 (2007).
- C. Roquelet, J. S. Lauret, V. Alain-Rizzo, C. Voisin, R. Fleurier, M. Delarue, D. Garrot, A. Loiseau, Ph. Roussignol, J. A. Delaire, and E. Deleporte (2010) C. Roquelet, J. S. Lauret, V. Alain-Rizzo, C. Voisin, R. Fleurier, M. Delarue, D. Garrot, A. Loiseau, Ph. Roussignol, J. A. Delaire, and E. Deleporte, ChemPhysChem 11, 1667 (2010).
- G. Magadur, J.S. Lauret, V. Alain-Rizzo, C. Voisin, Ph. Roussignol, E. Deleporte, and J.A. Delaire. (2008) G. Magadur, J.S. Lauret, V. Alain-Rizzo, C. Voisin, Ph. Roussignol, E. Deleporte, and J.A. Delaire., ChemPhysChem 9, 1250 (2008).
- J.P. Casey, S.M. Bachilo, and R.B. Weisman (2008) J.P. Casey, S.M. Bachilo, and R.B. Weisman, J. Mater. Chem. 18, 1510 (2008).
- Sprafke et al. (2011) J. K. Sprafke, S. D. Stranks, J. H. Warner, R. J. Nicholas, and H. L. Anderson, Angew. Chem. Int. Ed. 50, 2313 (2011).
- Note (2) Note that the PL due to the intrinsic absorption of SWNTs at 2.82 eV represents about 15% of the total signal and was subtracted from for the calculation of . At the same time, we took into account the contribution of the nearby transition for the (9,7) and (8,7) species.
- Roquelet et al. (2012) C. Roquelet, F. Vialla, C. Diederichs, P. Roussignol, C. Delalande, E. Deleporte, J.-S. Lauret, and C. Voisin, ACS Nano 6, 8796 (2012).
- Correa and Orellana (2012) J. D. Correa and W. Orellana, Phys. Rev. B 86, 125417 (2012).
- Note (3) W. Orellana, private communication. Note that a coverage proportional to the diameter could also be considered. This would yield variations of 20% in the reported values which is of the order of the error bars and would not change the conclusions discussed in the following.
- Garrot et al. (2011) D. Garrot, B. Langlois, C. Roquelet, T. Michel, P. Roussignol, C. Delalande, E. Deleporte, J. S. Lauret, and C. Voisin, J. Phys. Chem. C 115, 23283 (2011).
- Berciaud et al. (2008) S. Berciaud, L. Cognet, and B. Lounis, Physical Review Letters 101, 077402 (2008).
- Joh et al. (2011) D. Y. Joh, J. Kinder, L. H. Herman, S.-Y. Ju, M. A. Segal, J. N. Johnson, C. K.-L., and J. Park, Nat Nano 6, 51 (2011).
- Islam et al. (2004) M. F. Islam, D. E. Milkie, C. L. Kane, A. G. Yodh, and J. M. Kikkawa, Phys. Rev. Lett. 93, 037404 (2004).
- Schneck et al. (2011) J. R. Schneck, A. G. Walsh, A. A. Green, M. C. Hersam, L. D. Ziegler, and A. K. Swan, J. Phys. Chem. A 115, 3917 (2011).
- Oudjedi et al. (2013) L. Oudjedi, A. N. G. Parra-Vasquez, A. G. Godin, L. Cognet, and B. Lounis, J. Phys. Chem. Lett. 4, 1460 (2013).
- Kim et al. (1972) J. B. Kim, J. J. Leonard, and F. R. Longo, J. Am. Chem. Soc. 94, 3986 (1972).
Part I Supplementary Information
time-resolved measurements
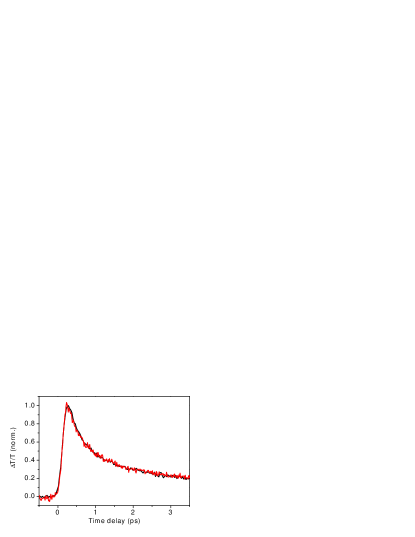
To compare the two excitation schemes (direct excitation or energy transfer from TPP) discussed in this paper, we performed additional time-resolved measurements on SWNT/TPP compounds solutions. We used a two-color femtosecond pump-probe setup based on an optical parametric amplifier. Time-resolved transient absorption measurements are shown in Figure 5 for a probe wavelength in resonance with the transition of the (6,5) species for a pump either in resonance with the intrinsic transition or with the Soret transition of the TPP (energy transfer resonance). The normalized traces are very similar both for the rise and the decay dynamics. This indicates that the population buildup and the subsequent decay of the excitonic level are identical in both excitation schemes. One can therefore rule out different internal conversion dynamics and yields in the two excitation schemes.
Assessment of the coverage
The assumption of a full coverage of the nanotubes with a single layer of TPP is supported by two experimental observations. Upon increasing the TPP concentration in the functionalization process, we observe a saturation of the amplitude of the shifted Soret peak (2.82 eV) of the bound TPP, whereas the Soret peak of the free TPP (2.95 eV) keeps increasing (See Fig.3 in C. Roquelet, J. S. Lauret, V. Alain-Rizzo, C. Voisin, R. Fleurier, M. Delarue, D. Garrot, A. Loiseau, Ph. Roussignol, J. A. Delaire, and E. Deleporte (2010)). This shows that the first layer of TPP is completed. The question of whether additional layers of TPP are built (without giving rise a contribution to the shifted peak) can be addressed by monitoring the transfer ratio upon increasing the TPP concentration (Fig. 6). Clearly, the energy transfer is not increased for larger TPP concentrations once the first layer is completed. We deduce that even if a second layer is built, it does not participate to the energy transfer, which is a sufficient condition for the assessment scheme developed in this work. In addition, molecular simulations show that the binding energy of a TPP molecule on a nanotube ( eV) is much larger than the thermal energy, regardless of the SWNT diameter or chiral angle Correa and Orellana (2012); Correa2013 supporting the assumption of a full coverage (total reaction). We note however that our method may lead to a small overestimate of if the coverage compactness is not perfect.
Assessment of the TPP absorption cross-section
In order to estimate the absorption cross-section of the TPP molecules bound to the nanotubes, we used the following procedure. The micellar suspensions of TPP and SWNT were mixed together and the absorbance was measured right after. At this stage the product consists only in free TPP and NT. The functionalization is then initiated by applying ultrasonic agitation for several hours. After the equilibrium is reached, the absorbance is measured again, showing a split Soret band at 2.95 eV (peak A, free TPP) and 2.82 eV (peak B, bound TPP). The two absorbance spectra are shown in Fig. 7. In the first stage, the concentration of free TPP is well known and allows us to deduce its average absorption cross-section cm2, in good agreement with the literature Kim et al. (1972). In fact, the TPP molecule -that is roughly planar- shows no absorption for an electric field perpendicular to its plane. Therefore, the orientation averaged absorption cross-section of free TPP is 2/3 of the in-plane absorption cross-section .
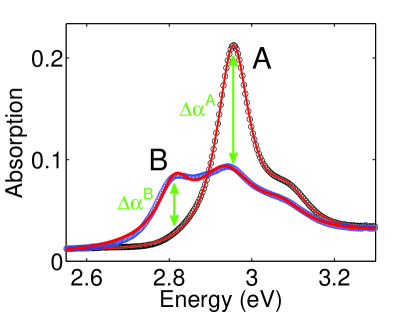
We then make use of a comparison between the two spectra to deduce the absorption of the TPP bound to the nanotube. The decrease of absorbance of the peak A corresponds to the molecules that stacked onto the nanotubes during the functionalization and gave rise to the band B. Therefore, the changes in absorption of peak A and peak B are given by : . We thus deduce :
This factor 2 does not correspond to a true decrease of the absorption cross-section of the bound TPP but rather to a change in the orientational average. Actually, when the TPP molecules are bound to a nanotube they can absorb light only when the electric field is parallel to the tube axis, due to strong depolarization effects Roquelet et al. (2012). Therefore, the orientation averaged cross-section of bound TPP is only 1/3 of the in-plane cross-section. In total, we obtain in agreement with the measurements. We thus deduce : the in-plane absorption cross-section of TPP (that is relevant for the transfer ratio ) is not modified by the binding to the nanotube within a 15% error bar.
global fitting procedure
To evaluate the PL intensities from the emission spectra, and deduce the values of discussed in the main text, a global fitting procedure is performed. Figure 8 shows an example of a fit along with the corresponding spectral data, for an excitation energy corresponding to the energy transfer resonance.
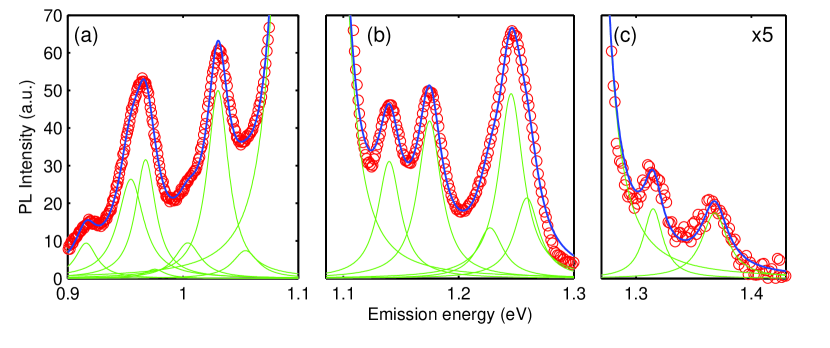
To assess the dozen of species measurable with our experimental setup, the fit process is split into three spectral zones in order to obtain a better precision for dim species (Figures 5a, 5b, 5c). In a first step, the energy and width of each PL line are evaluated by means of a Lorentzian fit to the PL spectrum excited at the corresponding excitation energy, where this specific PL line is prominent. Values ranging from 22 to 28 meV for the full width at half maximum (FWHM) are found. From these individual fits, we construct a model function consisting of the sum of all the Lorentzian lines with free amplitude but fixed central energy and width. Finally, a fit to the PL spectra at each excitation energy of the map is performed using this model function, the only free parameters being the relative amplitudes of the peaks. This yields the intensities and for the evaluation of for each species. This global fit was performed on the PL maps of several samples of similarly functionalized compounds suspensions (5 from HiPCO material and 2 from CoMoCAT material), which gave reproducible results. The error bars of are evaluated considering both the fitting uncertainties and the statistical variations.
We chose to fit the PL lines to Lorentzian profiles because such profiles gave the best agreement with experimental spectra. This is consistent with the fact that the PL linewidth of individual nanotubes at room temperature is of the order of 25 meV Tsyboulski et al. (2007) showing that inhomogeneous broadening (that would rather yield Gaussian profiles) is not prominent. That being said, we note that the values of evaluated for the spectrally well isolated PL lines, namely for the , , and species, is hardly sensitive to the fitting profile. This reduced set of data already gives the trend described in the main text, meaning that our results do not depend on the chosen fitting profiles. The data obtained for the , and minority species, though included in the fitting procedure of the HiPCO based spectra, are not considered in the discussion since they present much larger error bars. They are also relatively sensitive to the chosen fitting profile. This is due to their much weaker PL signal, on the order or even lower than the tails of the neighboring lines. In addition, not all bright species could be used in this study because some emission energies are too close to each other (on the same column in the PL map), preventing us from singling out the intensity of the energy transfer resonance associated with each species. This restriction holds for the , and species, which contributions add up in a single emission line at 1.09 eV. We note however that the intensity of the transfer resonance associated with these three chiral species is equal (within a 6% uncertainty) to the sum of the three intrinsic intensities weighted with the values extrapolated from Figure 3 of the paper (for a global energy transfer resonance at 1.09 eV normalized to 1, we find resonances of resp. 0.28, 0.30 and 0.18. The extrapolated values are resp. 1.0, 1.3 and 1.5, leading to a weighted sum of 0.94). This restriction also holds for the , and species. Their lower contributions are taken into account as small corrections in the evaluation of for respectively the , and species (typically a ten percent reduction of ).
Note that the PL due to the intrinsic absorption of SWNTs at 2.82 eV represents about 15% of the total signal. Its value was deduce by applying the same global fitting procedure to non-functionalized nanotubes (Figure 10). This intrinsic excitation of SWNTs was subtracted from for the calculation of . At the same time, we took into account the contribution of the nearby transition for the (9,7) and (8,7) species.
diameter dependence of and
We observe no diameter dependence of and hence of in our set of chiral species (, Figure 9a).
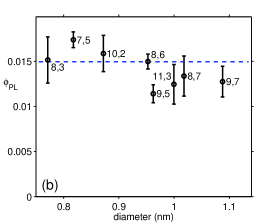
The PL quantum yield is deduced by dividing the action cross-section measured by Tsyboulski et al. Tsyboulski et al. (2007) by our estimate of the absorption cross-section . No diameter (Figure 9b) nor chiral angle dependence (see main text) of the PL quantum yield is observed within the error bars. The average is compatible with values reported in the literature on similar samples Carlson2007.
All the experimentally measured data (absorption cross-sections and PL quantum yield ) are reported in the Table 1.
| Type | (nm) | (∘) | (nm2/m) | (%) | |
|---|---|---|---|---|---|
| I | 0.68 | 23 | 410 | ||
| I | 0.75 | 5 | 490 | ||
| I | 0.77 | 15 | 430 | 1.5 | |
| I | 0.82 | 25 | 360 | 1.7 | |
| I | 0.87 | 9 | 590 | 1.6 | |
| I | 0.95 | 25 | 430 | 1.5 | |
| I | 1.00 | 12 | 580 | 1.2 | |
| I | 1.09 | 26 | 350 | 1.3 | |
| II | 0.75 | 27 | 330 | ||
| II | 0.79 | 10 | 240 | ||
| II | 0.83 | 19 | 290 | ||
| II | 0.96 | 21 | 360 | 1.1 | |
| II | 1.02 | 28 | 330 | 1.3 |
Species abundance evaluation
The global fitting procedure described previously can be applied to the PL map of a regular suspension of non functionalized HiPCO nanotubes (Figure 10) to obtain the PL intensities associated with each chiral species.
This fitting procedure yields the PL intensities for a set of 15 individual species when excited at their resonance. These intensities are corrected from the spectral detection response of our setup. The relative variations of these raw PL intensities with respect to the geometrical parameter and nanotube diameter are presented in Figure 11a. A linearly interpolated envelope is displayed to help visualization. Similar studies have been reported in the literature to evaluate the relative abundance of the chiral species in a given sample. Both absorption and PL quantum yield were assumed not to depend on the chiral species Bachilo et al. (2002); Miyauchi et al. (2004). With such an assumption, we find here a relatively symmetric diameter distribution, that reaches a maximum at about 0.85 nm and extends approximately from 0.75 to 0.95 nm (Figure 12a). The smaller diameter species are not well detected due to the limited spectral range measurable with our setup. On the contrary, the chiral angle distribution (Figure 12b) clearly indicates an asymmetric distribution with prominent type I () nanotubes. One could conclude that the growth method used for this sample favors the type I near zigzag nanotubes and produces almost no type II near zigzag tubes. However, such a growth asymmetry would be very puzzling regarding the growth mechanism.
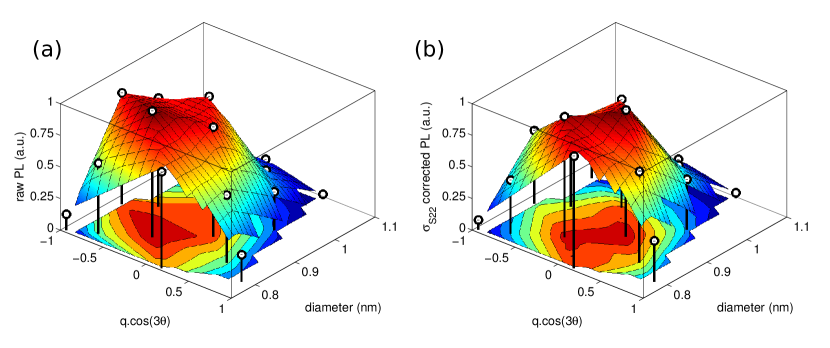
Considering the chiral species dependence of the absorption evidenced in this study and the flat quantum yield, we can now trace back the chiral species abundance in a much more reliable way, by dividing the PL data by the absorption cross-section for each (n,m) species. The corrected distribution is shown in Figure 11b and in Figures 12a, 12b.
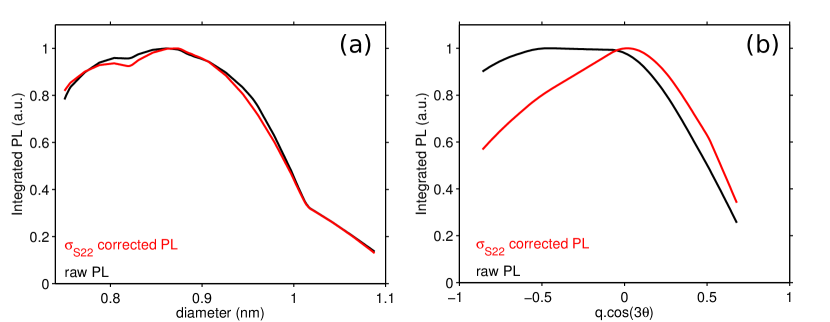
Due to their higher absorption, the corrected PL intensities of type I near zigzag nanotubes are lowered while the ones for type II near zigzag tubes are increased owing to their lower absorption. This correction yields no significant change regarding the diameter distribution (Figure 12a) but has a major effect on the chiral angle distribution : it now yields an almost symmetric distribution with respect to the chiral family (Figure 12b). Note however that despite the correction factor the distribution still shows a clear tendency to a higher abundance of near armchair species. We even notice that no zigzag species could be observed in this study. This could be related to the theoretically predicted vanishing PL quantum yield for zigzag species Oyama et al. (2006). This point is questionable though, since the model also predicts for instance a 5 fold reduced PL quantum yield for the (8,6) species as compared to the (8,3) whereas our data show no significant difference.
References
- Avouris et al. (2008) P. Avouris, M. Freitag, and V. Perebeinos, Nature Photonics 2, 341 (2008).
- Lauret et al. (2004) J. S. Lauret, C. Voisin, G. Cassabois, J. Tignon, C. Delalande, P. Roussignol, O. Jost, and L. Capes, Applied Physics Letters 85, 3572 (2004).
- Kostarelos et al. (2009) K. Kostarelos, A. Bianco, and M. Prato, Nature Nanotech. 4, 627 (2009).
- Liu et al. (2009) Z. Liu, S. Tabakman, K. Welsher, and H. Dai, Nano Research 2, 85 (2009).
- Arnold et al. (2006) M. S. Arnold, A. A. Green, J. F. Hulvat, S. I. Stupp, and M. C. Hersam, Nat Nano 1, 60 (2006).
- Bachilo et al. (2002) S. M. Bachilo, M. S. Strano, C. Kittrell, R. H. Hauge, R. E. Smalley, and R. B. Weisman, Science 298, 2361 (2002).
- Miyauchi et al. (2004) Y. Miyauchi, S. Chiashi, Y. Murakami, Y. Hayashida, and S. Maruyama, Chem. Phys. Lett. 387, 198 (2004).
- Okazaki et al. (2006) T. Okazaki, T. Saito, K. Matsuura, S. Ohshima, M. Yumura, Y. Oyama, R. Saito, and S. Iijima, Chemical Physics Letters 420, 286 (2006).
- Jorio et al. (2006) A. Jorio, C. Fantini, M. A. Pimenta, D. A. Heller, M. S. Strano, M. S. Dresselhaus, Y. Oyama, J. Jiang, and R. Saito, Appl. Phys. Lett. 88, 023109 (2006).
- Luo et al. (2006) Z. Luo, L. D. Pfefferle, G. L. Haller, and F. Papadimitrakopoulos, J. Am. Chem. Soc. 128, 15511 (2006).
- Roquelet et al. (2010) C. Roquelet, D. Garrot, J. S. Lauret, C. Voisin, V. Alain-Rizzo, P. Roussignol, J. A. Delaire, and E. Deleporte, Appl. Phys. Lett. 97, 141918 (2010).
- Note (1) , see e.g. Reich2004.
- Reich et al. (2005) S. Reich, C. Thomsen, and J. Robertson, Phys. Rev. Lett. 95, 077402 (2005).
- Oyama et al. (2006) Y. Oyama, R. Saito, K. Sato, J. Jiang, G. G. Samsonidze, A. Grüneis, Y. Miyauchi, S. Maruyama, A. Jorio, G. Dresselhaus, and M. Dresselhaus, Carbon 44, 873 (2006).
- Malic et al. (2006) E. Malic, M. Hirtschulz, F. Milde, A. Knorr, and S. Reich, Phys. Rev. B 74, 195431 (2006).
- Tsyboulski et al. (2007) D. A. Tsyboulski, J.-D. R. Rocha, S. M. Bachilo, L. Cognet, and R. B. Weisman, Nano Lett. 7, 3080 (2007).
- C. Roquelet, J. S. Lauret, V. Alain-Rizzo, C. Voisin, R. Fleurier, M. Delarue, D. Garrot, A. Loiseau, Ph. Roussignol, J. A. Delaire, and E. Deleporte (2010) C. Roquelet, J. S. Lauret, V. Alain-Rizzo, C. Voisin, R. Fleurier, M. Delarue, D. Garrot, A. Loiseau, Ph. Roussignol, J. A. Delaire, and E. Deleporte, ChemPhysChem 11, 1667 (2010).
- G. Magadur, J.S. Lauret, V. Alain-Rizzo, C. Voisin, Ph. Roussignol, E. Deleporte, and J.A. Delaire. (2008) G. Magadur, J.S. Lauret, V. Alain-Rizzo, C. Voisin, Ph. Roussignol, E. Deleporte, and J.A. Delaire., ChemPhysChem 9, 1250 (2008).
- J.P. Casey, S.M. Bachilo, and R.B. Weisman (2008) J.P. Casey, S.M. Bachilo, and R.B. Weisman, J. Mater. Chem. 18, 1510 (2008).
- Sprafke et al. (2011) J. K. Sprafke, S. D. Stranks, J. H. Warner, R. J. Nicholas, and H. L. Anderson, Angew. Chem. Int. Ed. 50, 2313 (2011).
- Note (2) Note that the PL due to the intrinsic absorption of SWNTs at 2.82 eV represents about 15% of the total signal and was subtracted from for the calculation of . At the same time, we took into account the contribution of the nearby transition for the (9,7) and (8,7) species.
- Roquelet et al. (2012) C. Roquelet, F. Vialla, C. Diederichs, P. Roussignol, C. Delalande, E. Deleporte, J.-S. Lauret, and C. Voisin, ACS Nano 6, 8796 (2012).
- Correa and Orellana (2012) J. D. Correa and W. Orellana, Phys. Rev. B 86, 125417 (2012).
- Note (3) W. Orellana, private communication. Note that a coverage proportional to the diameter could also be considered. This would yield variations of 20% in the reported values which is of the order of the error bars and would not change the conclusions discussed in the following.
- Garrot et al. (2011) D. Garrot, B. Langlois, C. Roquelet, T. Michel, P. Roussignol, C. Delalande, E. Deleporte, J. S. Lauret, and C. Voisin, J. Phys. Chem. C 115, 23283 (2011).
- Berciaud et al. (2008) S. Berciaud, L. Cognet, and B. Lounis, Physical Review Letters 101, 077402 (2008).
- Joh et al. (2011) D. Y. Joh, J. Kinder, L. H. Herman, S.-Y. Ju, M. A. Segal, J. N. Johnson, C. K.-L., and J. Park, Nat Nano 6, 51 (2011).
- Islam et al. (2004) M. F. Islam, D. E. Milkie, C. L. Kane, A. G. Yodh, and J. M. Kikkawa, Phys. Rev. Lett. 93, 037404 (2004).
- Schneck et al. (2011) J. R. Schneck, A. G. Walsh, A. A. Green, M. C. Hersam, L. D. Ziegler, and A. K. Swan, J. Phys. Chem. A 115, 3917 (2011).
- Oudjedi et al. (2013) L. Oudjedi, A. N. G. Parra-Vasquez, A. G. Godin, L. Cognet, and B. Lounis, J. Phys. Chem. Lett. 4, 1460 (2013).
- Kim et al. (1972) J. B. Kim, J. J. Leonard, and F. R. Longo, J. Am. Chem. Soc. 94, 3986 (1972).