KAT-7 Science Verification: Using Hi Observations of NGC 3109 to Understand its Kinematics and Mass Distribution
Abstract
Hi observations of the Magellanic-type spiral NGC 3109, obtained with the seven dish Karoo Array Telescope (KAT–7), are used to analyze its mass distribution. Our results are compared to what is obtained using VLA data. KAT–7 is the precursor of the SKA pathfinder MeerKAT, which is under construction. The short baselines and low system temperature of the telescope make it sensitive to large scale low surface brightness emission. The new observations with KAT–7 allow the measurement of the rotation curve of NGC 3109 out to 32′, doubling the angular extent of existing measurements. A total Hi mass of 4.6 M⊙ is derived, 40% more than what was detected by the VLA observations.
The observationally motivated pseudo-isothermal dark matter (DM) halo model can reproduce very well the observed rotation curve but the cosmologically motivated NFW DM model gives a much poorer fit to the data. While having a more accurate gas distribution has reduced the discrepancy between the observed RC and the MOdified Newtonian Dynamics (MOND) models, this is done at the expense of having to use unrealistic mass–to–light ratios for the stellar disk and/or very large values for the MOND universal constant . Different distances or Hi contents cannot reconcile MOND with the observed kinematics, in view of the small errors on those two quantities. As for many slowly rotating gas–rich galaxies studied recently, the present result for NGC 3109 continues to pose a serious challenge to the MOND theory.
1 Introduction
On 2012 May 25, South Africa was awarded the construction of the mid-frequency array of the Square Kilometer Array (SKA), while Australia will build the low-frequency array. The SKA will consist of an ensemble of 3000 15 m dishes of which 80% will constitute the core portion in the Karoo desert while the remaining antennae will extend all the way to the 8 African partner countries, namely Botswana, Ghana, Kenya, Madagascar, Mauritius, Mozambique, Namibia and Zambia. It is expected that the full SKA will be completed around 2025. A precursor array of 64 dishes, MeerKAT, is already under construction by South Africa and should be ready for science operation in 2016. In preparation for these two large projects, a pre-precursor array comprising 7 dishes, KAT–7, was completed in December 2010. While its main purpose is to test technical solutions for MeerKAT and the SKA, scientific targets such as NGC 3109 were also observed during commissioning to test the Hi spectral line mode. In this paper, we compare over 100 hours of observations taken with KAT–7 to previously obtained VLA data and perform a thorough analysis of the mass distribution of NGC 3109.
NGC 3109 is an SB(s)m galaxy (de Vaucouleurs et al., 1991) on the outskirts of the Local Group (van den Bergh, 1994). It is even believed by certain authors to belong to the Local Group (e.g. Mateo, 1998). While NGC 3109 looks like an Irregular galaxy on short exposures (Sandage, 1961), it is clearly a spiral on longer exposures (Carignan, 1985). Spiral arms are clearly visible, especially on the east side. This small spiral (scale length = 1.2 kpc) is a Low Surface Brightness (LSB) system with = 23.17 (Carignan, 1985). Its optical parameters are summarized in Table 1. One important parameter for mass modeling is the distance. Fortunately, because of its proximity, numerous Cepheids were observed in this Magellanic-type spiral, The most recent measurements are summarized in Table 2. For this study, we adopt a distance of 1.30 Mpc (Soszyński et al., 2006).
| Parameter | Ref | |
|---|---|---|
| Morphological type | SB(s)m | (1) |
| Right Ascension (J2000) | 10h 03m 06.7s | (1) |
| Declination (J2000) | –26o 09′ 32″ | (1) |
| Distance Modulus | 25.57 | (2) |
| Distance (Mpc) | 1.30 | (2) |
| Scale (pc arcmin-1) | 378 | |
| Isophotal major diameter, | 14.4′ | (3) |
| Holmberg radius, | 13.3′ | (3) |
| Total apparent magnitude | 10.27 | (4) |
| Corrected apparent mag. | 9.31 | (1) |
| Absolute magnitude | –16.26 | (2) |
| Exponential disk parameters: | ||
| Central | 23.17 | (4) |
| Scale length, (kpc) | 1.2 | (4) |
| Reference | (Mpc) |
|---|---|
| Soszyński et al. (2006) | 1.30 |
| Pietrzyński et al. (2006) | 1.28 |
| Musella, Piotto &Capaccioli (1997) | 1.36 |
| Capaccioli, Piotto & Bresolin (1992) | 1.26 |
| Mean Cepheids distance |
NGC 3109 is of significant scientific interest for two main reasons. Firstly, Jobin & Carignan (1990) used observations with the hybrid VLA DnC configuration (synthesized beam of 36″ 27″ and velocity resolution of 10.3 km s-1) to perform a dynamical study of this galaxy, comparing the rotation curve (RC) derived from a tilted-ring analysis (see Sec. 3.4.1) to models composed of a luminous disk (stars & gas) and of a dark isothermal (ISO) halo (see Sec. 4.1.1). Such a mass model provides an excellent fit to this nearly solid-body type RC. Combining the Hi RC with higher resolution H kinematical data, Blais–Ouellette, Amram & Carignan (2001) also obtained a very good ISO Dark Matter (DM) model but a much less accurate fit for the cosmologically motivated NFW (Navarro, Frenk & White, 1997) DM model.
Recently, it was also shown that a MOdified Newtonian Dynamics (Milgrom, 1983, 1988) model (MOND) could not reproduce the NGC 3109’s RC (Randriamampandry, 2013), at least with the data available. With our new data, it should be possible to compare DM (ISO and NFW) models to MOND (no dark matter) models and see if NGC 3109 really challenges the MOND theory. This is not the first time that NGC 3109 poses problems to MOND (see e.g. Sanders, 1986; Begeman, Broeils & Sanders, 1991).
Secondly, Barnes & de Blok (2001) used 21cm Multibeam data with the Parkes 64m dish (beam 15.5′ and velocity resolution of 1.1 km s-1) to study the environment of NGC 3109. They provide a compelling argument that the warp in the Hi disk of NGC 3109 could be due to a dynamical encounter with the Antlia dwarf. This is also suggested by the elongation of the optical isophotes of NGC 3109 toward the south (Jobin & Carignan, 1990) and those of Antlia in the direction of NGC 3109 (Penny et al., 2012).
However, recent derivation of various merger and/or interaction parameters (e.g. asymmetry, clumpiness) by Pimbblet & Couch (2012) are consistent with Antlia being an undisturbed dwarf elliptical. In fact, despite its dSph appearance, Antlia is better classified as a dSph/dIrr transition type (Grebel, Gallagher & Harbeck, 2003) because of its high Hi content. With high sensitivity and mainly better spatial resolution observations (KAT–7 vs HIPASS), it should be possible to map much better the traces of that interaction, if it exists. An encounter/interaction that has significantly altered NGC3109’s kinematics would give less weight to the finding that MOND cannot reproduce the rotation curve.
The remainder of this paper is as follows. In Sec. 2, a description of the new radio interferometer KAT-7 is given. Sec. 3.1 describes in details the new Hi data obtained with KAT–7, Sec. 3.2 those from the VLA–ANGST survey and Sec. 3.3 compares the different data sets. Sec. 3.4 derives the optimal RC that is used for the DM (ISO and NFW) and MOND models of Sec. 4. A discussion follows in Sec. 5 and a summary of the results and the final conclusions are given in Sec. 6.
2 A New Radio Interferometer: KAT–7
The seven-dish KAT–7 array, shown in Fig. 1, was built as an engineering testbed for the 64-dish Karoo Array Telescope, known as MeerKAT, which is the South African pathfinder for the Square Kilometer Array (SKA). KAT–7 and MeerKAT are located close to the South African SKA core site in the Northern Cape’s Karoo desert region. KAT–7 is remotely controlled from Cape Town, some 800 km away from the site. Construction of the array started in early 2008 and was completed in December 2010, with ”first light” fringes obtained between two antennas in December 2009. The instrument is now in its science verification stage.
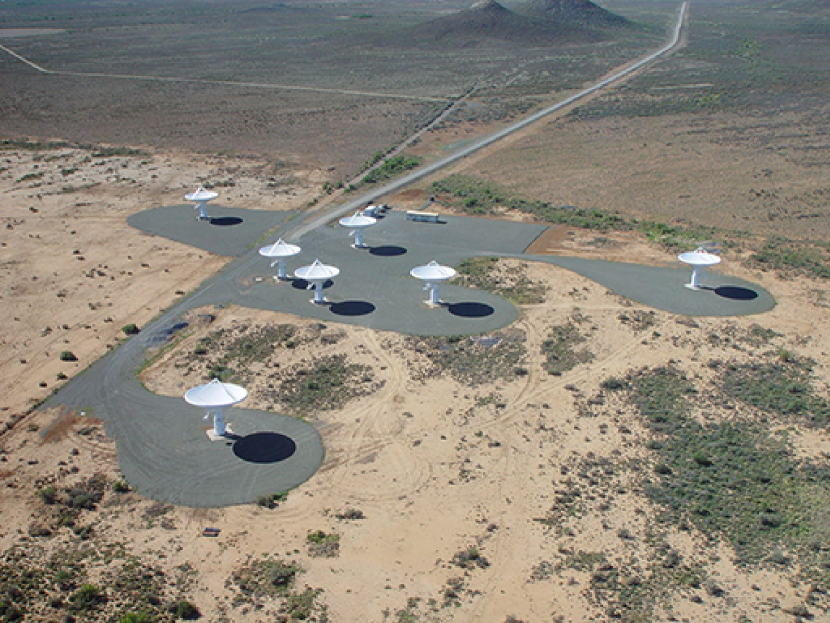
The array is extremely compact, with baselines ranging between 26 m to 185 m. The KAT-7 layout was determined using the optimization algorithm described in de Villiers (2007), which determined a layout with a Gaussian UV distribution for a specified observation setting. The observation setting being optimized in this case was an 8 hour track (symmetric hour angle range), on a target at a –60 degree declination. The optimization objective was a Gaussian UV distribution at 1.4GHz, yielding a Gaussian synthesized beam with low sidelobes. Several randomly seeded layouts were generated and were evaluated for a set of observation options (time durations: snapshot, 4hr, 8hr, 12hr; declinations: 0, –30,–60, –90 degrees). The layout selected had the lowest sidelobes for the largest number of test observation settings considered. The antenna layout can be found at https://sites.google.com/a/ska.ac.za/public/kat-7.
The KAT-7 dishes have a prime-focus alt-az design with a F/D of 0.38, optimized for single-pixel L-band feeds. The low noise amplifiers (LNAs) for the feeds are cryogenically cooled to 80 K using Stirling coolers. The key system specifications for KAT–7 are summarized in Table 3. The digital backend of the system is an FPGA (Field Programmed Gate Array)-based, flexible packetised correlator using the Reconfigurable Open Architecture Computing Hardware (ROACH: https://casper.berkeley.edu/wiki/ROACH), which is a flexible and scalable system enabling spectral line modes covering a wide range of resolutions. Table 4 gives the details of the recently commissioned correlator modes. Digital filters give a flat bandpass over the inner 75% of the band with a rapid roll-off at the edges of the band.
| Parameter | Value |
|---|---|
| Number of antennas | 7 |
| Dish diameter | 12 m |
| Min baseline | 26 m |
| Max baseline | 185 m |
| Frequency range | 1200 - 1950 MHz |
| Max instantaneous bandwidth | 256 MHz |
| Polarisation | Linear H & V |
| Tsys | 26 K |
| Aperture efficiency | 0.65 |
| System Equivalent Flux Density | 1000 Jy |
| Latitude | -30:43:17.34 |
| Longitude | 21:24:38.46 |
| Elevation | 1038 m |
| Digital back-end | ROACH boards |
| mode | total BW | number of | channel BW |
|---|---|---|---|
| (MHz) | channels | (kHz) | |
| c16n2M4k | 1.5625 | 4096 | 0.381 |
| c16n7M4k | 6.25 | 4096 | 1.526 |
| c16n25M4k | 25 | 4096 | 6.104 |
| c16n400M4k | 256 | 1024 | 390.625 |
CASA (Common Astronomy Software Applications; McMullin et al. 2007) is the standard data reduction package being used for the reduction of the KAT–7 data and is anticipated to be used for MeerKAT.
3 Hi Observations of NGC 3109
The KAT–7 Hi observations of NGC 3109 provide a unique opportunity to simultaneously achieve Hi spectral-line science verification and an original scientific result. They complement the high spatial resolution ( 10″) but small field of view () of the VLA–ANGST data (Ott et al., 2012) and the high sensitivity () but low spatial resolution () Multibeam data (Barnes & de Blok, 2001). With its short baselines and low system temperature (TK), KAT–7 is very sensitive to low surface brightness and large scale Hi emission, characteristic of the signal expected from NGC 3109.
3.1 KAT–7 data on NGC 3109
In order to observe the Hi in both NGC 3109 and Antlia, plus possible signs of interaction between the two, a mosaic of 3 fields was obtained to have good sensitivity over a region of . The data was collected over 13 observing sessions between 2012 November 20 and 2012 December 26 using the c16n7M4k spectral line mode (Table 4) for a median of 11 hours in each session and a total of 122h43m56s, including calibration. This yielded a total time on source of hours for each pointing.
The first three sessions were taken with 6 cold antennae, but the entire array was available for the remaining 10 observing sessions. The roughly 1 degree beam of KAT-7 is just large enough to image NGC 3109 in a single pointing. We used three pointings positioned in a straight line and extending slightly to the SE to mosaic the region between NGC 3109 and Antlia. The distance between pointings was chosen to give a uniform coverage between the phase centers. The c16n7M4k correlator mode gives velocity channels of 0.32 km s-1 over a flat bandpass of km s-1 , centered at 1417 MHz. The large bandwidth allows to collect Hi data on background galaxies in the field.
The basic data reduction was done in CASA 3.4.0 and 4.0.0. More advanced analysis was done using either AIPS (Greisen, 2003), MIRIAD (Sault, Teuben & Wright, 1995) and/or GIPSY (van der Hulst et al., 1992). To start with, the data was flagged in an automated way to discard data for shadowing and flux calibrators below 20 degrees in elevation. The data was additionally examined as a function of frequency and baseline, and flagged by hand.
This testing of the HI spectral line mode led to the discovery of faint, very narrow, internally generated radio frequency interference (RFI) originating along the signal path, which has since been successfully eliminated in KAT-7 by the insertion of a low-pass filter. The RFI in our data is antenna dependent and only affects about 30 channels out of the central 3000 on three antennae. One of the primary goals of the science verification phase is exactly to identify these type of problems and correct for them.
The standard interferometric data reduction strategy that has been employed for decades in AIPS and Miriad has been used. Each of the 13 observing sessions was reduced individually. Continuum subtraction was accomplished by selecting line free channels and using a first order fit. KAT–7 does not use Doppler tracking, and CASA does not fully recognize frequency keywords, so special care was taken to produce image cubes with the proper velocity coordinates. This was a three steps process accomplished by:
-
•
setting the MEAS_FREQ_REF and REF_
FREQUENCY keywords in the SPECTRAL WINDOW table, -
•
specifying the reference frequency and setting the output frame to optical, barycentric in CVEL, and
-
•
specifying the rest frequency again in the task CLEAN.
The calibration was applied and the three mosaic pointings were then SPLIT from the calibration sources. The data were averaged in time from 5 to 10 second integrations, and spectrally from 0.32 km s-1 to 1.28 km s-1 channels. All 13 data sets were then combined in CONCAT.
The data was imaged using the mosaic mode and the multi–scale clean option. Three cubes were produced by applying natural (na), uniform (un), and neutral (ro: robust=0) weighting (Table 5) to the uv data. The robust=0 cube was cleaned interactively using a mask to select regions of galaxy emission by hand in each channel. After each major clean cycle, the mask was expanded to include regions of fainter galaxy emission. After a final mask was created, the cube was reproduced using the final mask in a non-interactive clean down to the noise threshold. All cubes and images were produced using the same mask derived from the robust=0 weighted cube. This provided a compromise between surface brightness sensitivity to large-scale emission and a low noise threshold, while mitigating confusion from sidelobes and low-level artifacts due to instrument calibration.
| Parameter | Value |
|---|---|
| Start of observations | 20 nov. 2012 |
| End of observations | 26 dec. 2012 |
| Total integration per pointing | 24.75 hours |
| FWHM of primary beam | 58.67′ |
| Total Bandwidth | 6.25 MHz |
| Central frequency | 1417 MHz |
| Channel Bandwidth (4 x 1.526 kHz) | 6.1 kHz |
| Number of channels (4096/4) | 1024 |
| Channel width (4 x 0.32 km s-1) | 1.28 km s-1 |
| Maps gridding | 55″ x 55″ |
| Maps size | 128 x 256 |
| Flux/bandpass calibrator | 3C138 |
| Phase calibrator | 0118-317 |
| Robust = 0 weighting function | |
| FWHM of synthesized beam | 212″x 201″ |
| RMS noise | 5.6 mJy/beam |
| Conversion oK/(1 mJy/beam) | 0.014 |
| Natural weighting function | |
| FWHM of synthesized beam | 264″x 233″ |
| RMS noise (mJy/beam) | 3.7 mJy/beam |
| Conversion oK/(1 mJy/beam) | 0.010 |
| Uniform weighting function | |
| FWHM of synthesized beam | 203″x 196″ |
| RMS noise | 9.1 mJy/beam |
| Conversion oK/(1 mJy/beam) | 0.015 |
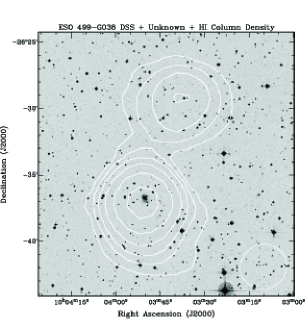
In addition to NGC 3109, Antlia, ESO 499-G037 and ESO 499-G038, an HI cloud which has no known optical counterpart was serendipitously discovered to the north of ESO 499-G038 at a similar velocity (Figure 2). The channels that contain this emission are remarkably clean and uniform in their noise characteristics. By contrast the channels which contain the brightest HI emission from NGC 3109 contain artifacts from sidelobes of the telescope’s synthesized beam, which we have been unable to remove completely. The noise value in these channels is three times higher than elsewhere in the cube. For our analysis of NGC 3109, the cube produced with na weighting is used, except for the map showing the sum of all the channels (Figure 2) which used the ro weighting scheme. The parameters of the KAT–7 observations are summarized in Table 5.
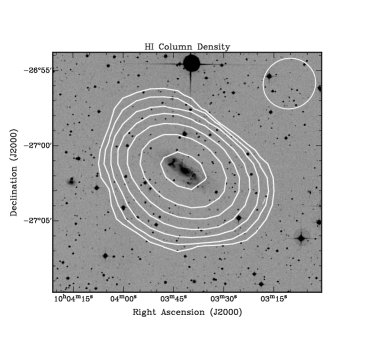
Fig. 2 shows the total intensity map for all the channels of the data cube. The lowest contour is at 1.0 x 10¹⁹ atoms cm-2. Besides NGC 3109 to the north and Antlia to the south, the two background galaxies ESO 499-G037 (10:03:42 -27:01:40; Vsys = 953 km s-1) and ESO 499-G038 (10:03:50 -26:36:46; Vsys = 871 km s-1) are clearly visible. More details about these two systems will be given in the Appendix. As mentioned earlier, the small cloud between ESO 499-G038 and NGC 3109 has no obvious optical counterpart. However, it is clearly associated with ESO 499-G038 and not NGC 3109, being at a velocity 900 km s-1.
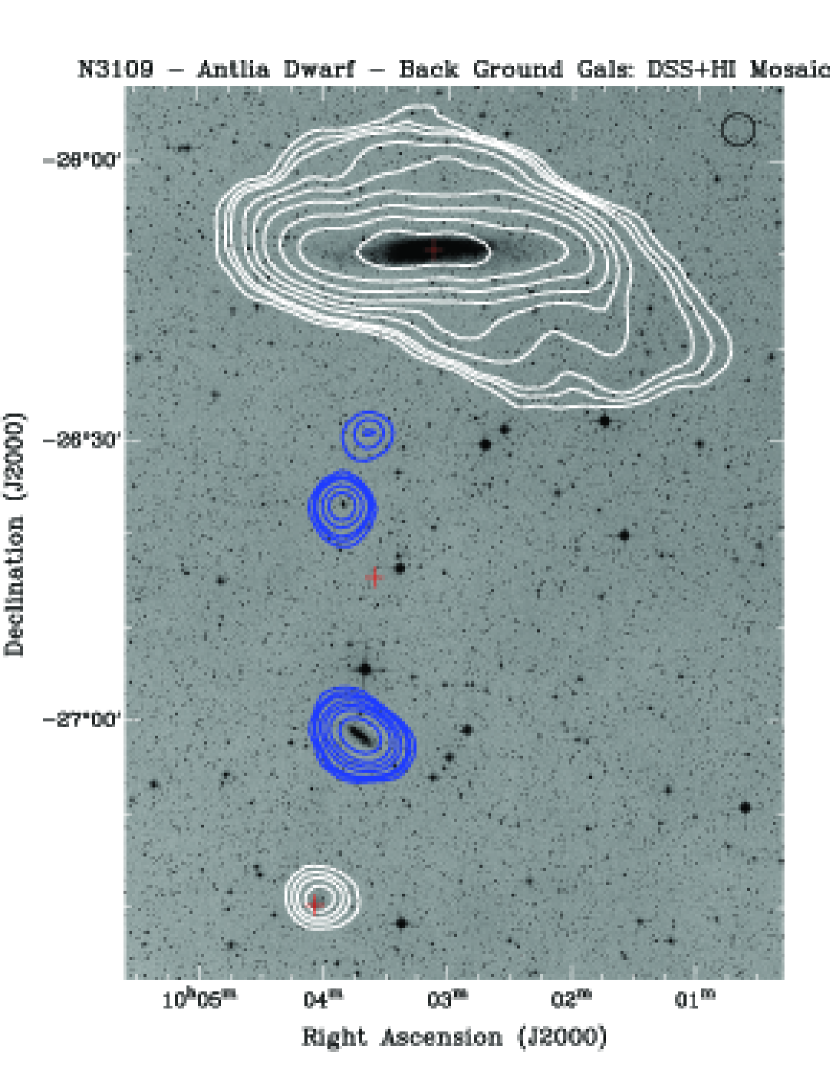
The natural weighted cube is the best place to look for low-surface brightness emission between NGC 3109 and Antlia, but there is no obvious evidence of it there. In fact the elevated noise and strong sidelobes in the channels, which contain bright NGC 3109 data, prevent us from detecting lower surface brightness emission and limit what we can learn from smoothing the data. This work on NGC 3109 showed that better models of the KAT-7 primary beam are needed for calibration before we can go deeper.
Fig. 3 shows the result of the moment analysis of the NGC 3109 data. It can be seen that the Hi extends over nearly 1o, more than 4 times the optical diameter (). The nearly parallel isovelocity contours, typical of a solid–body type rotation curve, are clearly visible, as well as the warp of the Hi disk in the outer parts. The velocity dispersion map shows very well the gradient of from 15 km s-1 in the center down to 5 km s-1 at the edge of the disk.
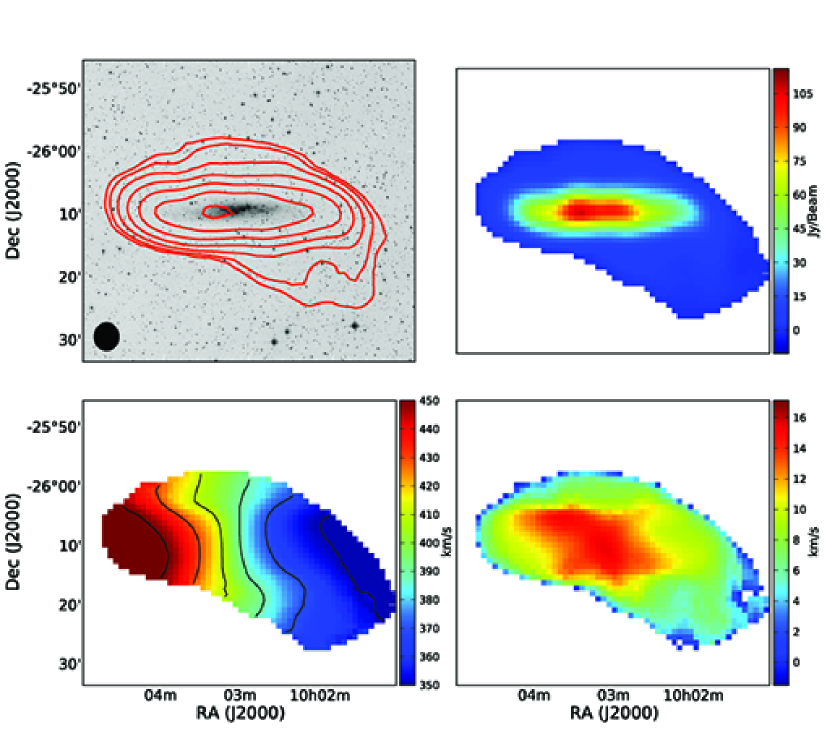
Fig. 4 gives the integrated Hi profile for NGC 3109. Profile widths of V50 = km s-1 and V20 = km s-1 are derived. Since the Hi distribution is clearly lopsided, with more gas on the approaching (SW) than on the receding side, we adopt the midpoint velocity of 404 2 km s-1 as more representative of the systemic velocity than the intensity–weighted mean velocity. This can be compared to 404 km s-1, V50 = 123 km s-1 and V20 = 137 km s-1 in Jobin & Carignan (1990). An integrated flux of Jy km s-1 is measured which corresponds at our adopted distance of 1.3 Mpc to a Hi mass of M M⊙ for a Hi mass–to–luminosity ratio M/LB of 1.0, showing the gas–rich nature of NGC 3109. With a HPBW of the primary beam of nearly one degree and the short baselines available, no flux should be missed by these observations.

Two methods of kinematical analysis will be used for the NGC 3109 data, namely an intensity-weighted moment analysis and a Gauss–Hermite polynomial profile fit. With such high S/N data and low velocity gradient RC, not much difference is expected between the two types of analysis. As a result, the analysis yielding the smaller errors and the largest radius RC will be used for the mass model analysis in Sec. 4. The RCs are derived in Sec. 3.4.
3.2 VLA–ANGST data on NGC 3109 and Antlia
NGC 3109 and Antlia were observed at the VLA as part of the VLA–ANGST survey (Ott et al., 2012). The galaxies were observed for 9 hours in BnA, 3 hours in CnB and 3 hours in DnC configurations giving access to scales from 6” to 15’. The hybrid configurations were used to get more circular beams for these two southern objects. The data were gridded with two different weighting functions: na weighting for maximum sensitivity and ro weighting for maximum spatial resolution (smaller synthesized beam). We use the ro weighted maps for NGC 3109 and the na weighted maps for Antlia. The parameters of the VLA observations are given in Table 6.
| Parameter | NGC 3109 | Antlia |
|---|---|---|
| FWHM of primary beam | 31.5′ | 31.5′ |
| FWHM of synthesized beam | 7.6″x 5.0″ | 14.1″x 13.9″ |
| Total Bandwidth (MHz) | 1.56 | 0.78 |
| Number of channels | 256 | 128 |
| Central frequency (MHz) | 1418.5 | 1418.6 |
| Channel width (km s-1) | 1.3 | 1.3 |
| RMS noise (mJy/beam) | 1.7 | 1.0 |
| Conversion oK/(1 mJy/beam) | 15.8 | 3.06 |
| Maps gridding | 1.0″x 1.0″ | 1.5″x 1.5″ |
| Maps size | 20482 | 10242 |
| Weighting function | robust | natural |
| Phase calibrator | 0921-263 | 0921-263 |
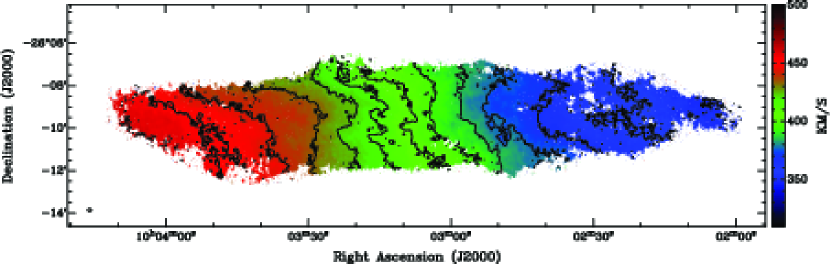
Figure 5 shows the velocity field obtained with the ANGST data for NGC 3109. The nearly parallel contours are again clearly visible. From the Hi emission map, we measure a total flux of 723 Jy km s-1 which, at our adopted distance, corresponds to a M M⊙, which is nearly 40% less than the Hi detected with KAT–7. Because the VLA is not sensitive to scales larger than 15′, the VLA-ANGST data will be missing some flux and their Hi mass will be clearly underestimated for NGC 3109. In fact, the Hi mass measured is exactly the same as that found by Jobin & Carignan (1990) with a VLA mosaic of two fields. So the problem with the VLA data is not as much the smaller HPBW of the antennae but more the lack of short baselines.
The VLA–ANGST data, with its high spatial resolution, is much better suited to study the Hi distribution in Antlia, since KAT–7 has barely two beamwidths across the object. Figure 6 gives the total Hi emission map for Antlia, where the lowest contour corresponds to atoms cm-2. A total flux of Jy km s-1 is found which, at an adopted distance of Mpc (Pimbblet & Couch, 2012), corresponds to a M M⊙. This time, most of the flux should have been detected since Antlia is much smaller than NGC 3109. However, this total flux is twice as much as that of the HIPASS data where Barnes & de Blok (2001) found Jy km s-1 and still 40% more than the value of Jy km s-1 found by Fouqué et al. (1990). The reason for this large difference is not clear. But since we do not have access to the raw data, it is difficult for us to investigate further.
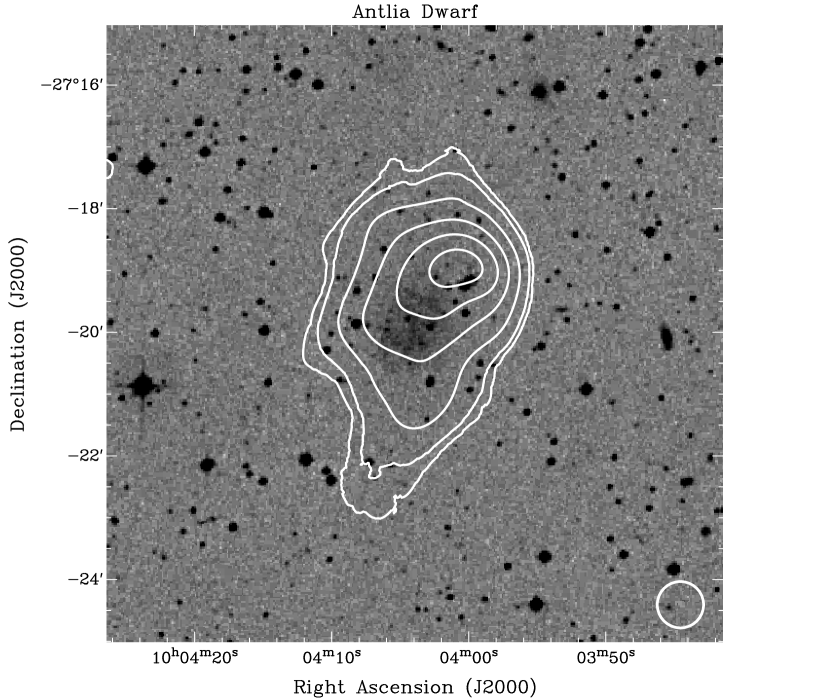
Figure 7 gives the integrated Hi profile for Antlia. An integrated flux of Jy km s-1 is found, which is similar to the flux derived from the Hi emission map. An intensity-weighted mean velocity of km s-1 is derived along with V50 = km s-1 and V20 = km s-1. This can be compared to km s-1 and V20 = km s-1 for Barnes & de Blok (2001) and km s-1 V50 = km s-1 and a V20 = km s-1 for Fouqué et al. (1990).

3.3 Comparison of the different Hi data sets
The limiting surface densities of the different interferometric studies are given in Table 7. As far as the VLA data are concerned, one should not be surprised that the Jobin & Carignan (1990) data go deeper than the ANGST data since they are a mosaic of 2 fields with the same observing time in DnC configuration than the single field ANGST data. The 1.3 km s-1 resolution ANGST data is useful for comparisons with the Jobin & Carignan (1990) 10.3 km s-1 resolution data in the inner regions of NGC 3109. But mainly, that data provide more information on the Hi distribution of Antlia, for which the KAT–7 data is of too low spatial resolution.
| Reference | atoms cm-2 | Hi size |
|---|---|---|
| KAT-7 | 58′ x 27′ | |
| ANGST, VLA | 32′ x 08′ | |
| Barnes & de Blok (2001) | 85′ x 55′ | |
| Jobin & Carignan (1990) | 40′ x 12′ |
In view of the surface densities limits, we see that while both the KAT-7 and the Jobin & Carignan (1990) reach cm-2, the KAT–7 data covers a larger area since it is sensitive to large scales invisible to the VLA. As for the Barnes & de Blok (2001) data reaching the much lower surface densities of cm-2, they provide the largest detected size (85′x 55′). However, this increase in size may be due partly to the large 15.5′ HIPASS beam.
The Hi mass estimates of both the single dish and the interferometric observations can be found in Table 8. The first thing to notice is the larger mass obtained by the single dish observations compared to the aperture synthesis ones, the only exception being the Whiteoak & Gardner (1977) data which come from a single pointing of the Parkes 64 m radio telescope. With a 15′ beam, necessarily a lot of the flux extending over 1o has been missed. For the others, the discrepancies can be explained by either the way the multi-pointing data have been combined or most likely that the correction for self–absorption that most of these authors have applied has been overestimated. No such correction has been applied to the synthesis data.
| Reference | M⊙ |
|---|---|
| Aperture synthesis | |
| KAT-7 | 4.6 |
| ANGST, VLA | 2.9 |
| Barnes & de Blok (2001) | 4.5 |
| Jobin & Carignan (1990) | 2.9 |
| Single–dish | |
| Huchtmeier et al. (1980) | 6.6 |
| Whiteoak & Gardner (1977) | 2.1 |
| Dean & Davies (1975) | 5.9 |
| Huchtmeier (1973) | 5.9 |
| van Damme (1966) | 5.9 |
| Epstein (1964) | 6.6 |
As for the synthesis data, we see that both sets of VLA data agree exactly. We would have expected some more flux from the deeper Jobin & Carignan (1990) data but since most of the flux is in the bright central components, the difference is probably just of the order of the errors. On the other hand, both the KAT-7 data and the HIPASS data agree very well which is surely indicative that, in both cases, no flux is missed. Because both those data sets see all the scales, they detect nearly 40% more flux than the VLA, which do not have the proper short spacings to see scales larger than 15′.
3.4 Derivation of the optimal RC
The same method is used to derive the RC for both the VLA–ANGST and the KAT–7 data sets. For this study, we used the implementation of the tilted ring model in the GIPSY task ROTCUR (Begeman, 1989).
3.4.1 Tilted Ring Models
A set of concentric rings is used to describe the motion of the gas in the galaxy. The gas is assumed to be in circular motion. Each ring is characterized by a set of 5 orientation parameters, namely: a rotation centre , a systemic velocity , an inclination , a Position Angle and by a rotation velocity . Naturally, the rotation centre and the systemic velocity should be the same for all the rings but and will vary if the Hi disk is warped.
The line of sight velocity at any position in a ring with radius is given by
| (1) |
where is the position angle with respect to the receding major axis measured in the plane of the galaxy. is related to the actual in the plane of the sky by
| (2) |
| (3) |
A weighting function and an exclusion angle of about the minor axis have been used to give maximum weight to the velocity points close to the major axis and minimize the influence of large deprojection errors close to the minor axis in view of the large inclination of the galaxy. The width of the rings has been matched to the synthesized beam size to make sure that the velocity points are independent.
The method consists at finding for each ring the best set of the 5 orientation parameters , , and which minimizes the dispersion of inside the ring. The following procedure is followed:
-
•
The rotation center and the systemic velocity are determined first by keeping and fixed (usually using the optical values). The rotation center and the systemic velocity have to be determined simultaneously since they are correlated. They are searched using only the central rings (e.g. ) since there is usually no warp within the optical disk.
-
•
Now, keeping and fixed, and are looked for to map the warp of the Hi disk, which usually starts just outside the optical. Here also, and have to be determined simultaneously since they are also correlated.
-
•
The previous two steps were done using the data of all the galaxy. Using the same fixed and , the previous step is repeated for the approaching and receding sides separately to see possible departures from axisymmetry.
The errors on will be the quadratic sum of the dispersion in each ring and half the difference between the approaching and the receding sides:
| (4) |
Since the mass models assume an axisymmetric system, we think that this way of calculating the errors is more representative of the true uncertainties, when comparing the RC to the model.
3.4.2 VLA–ANGST RC
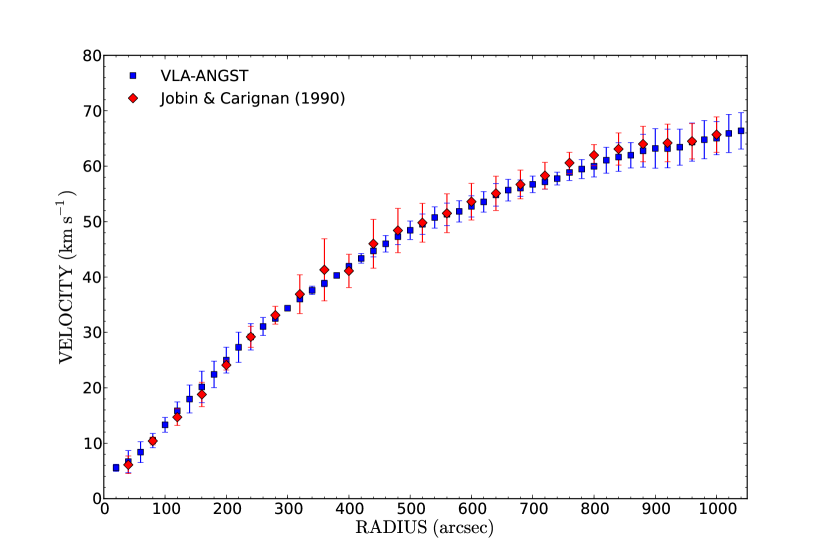
For the derivation of the kinematics of NGC 3109, we use the ro-weighted VLA–ANGST data. We find that the rotation center is coincident with the optical center and derive a systemic velocity km s-1. By keeping those parameters fixed, we then fitted and . The solutions for the whole galaxy and separately for the approaching and receding sides are shown in Fig. 8, along with a comparison with Jobin & Carignan (1990) in Fig. 9 . We see that the warp which starts around the Holmberg radius (), is more important on the approaching (SW) side and that the RC from both VLA datasets agree very well, despite the difference in velocity resolutions (1.3 km s-1 vs 10.3 km s-1). Because Jobin & Carignan (1990) provide asymmetric drift corrections, their RC will be used for the mass models in Sec. 4.
3.4.3 KAT–7 RC
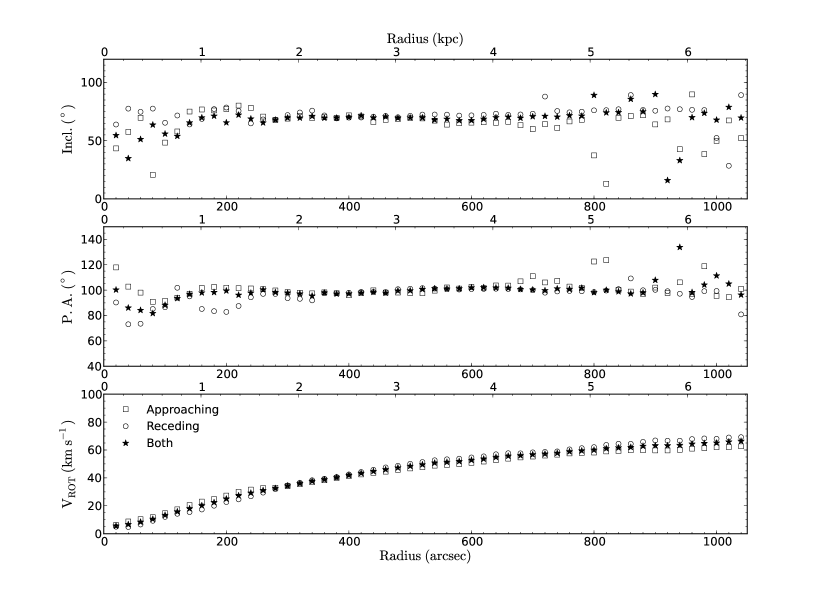
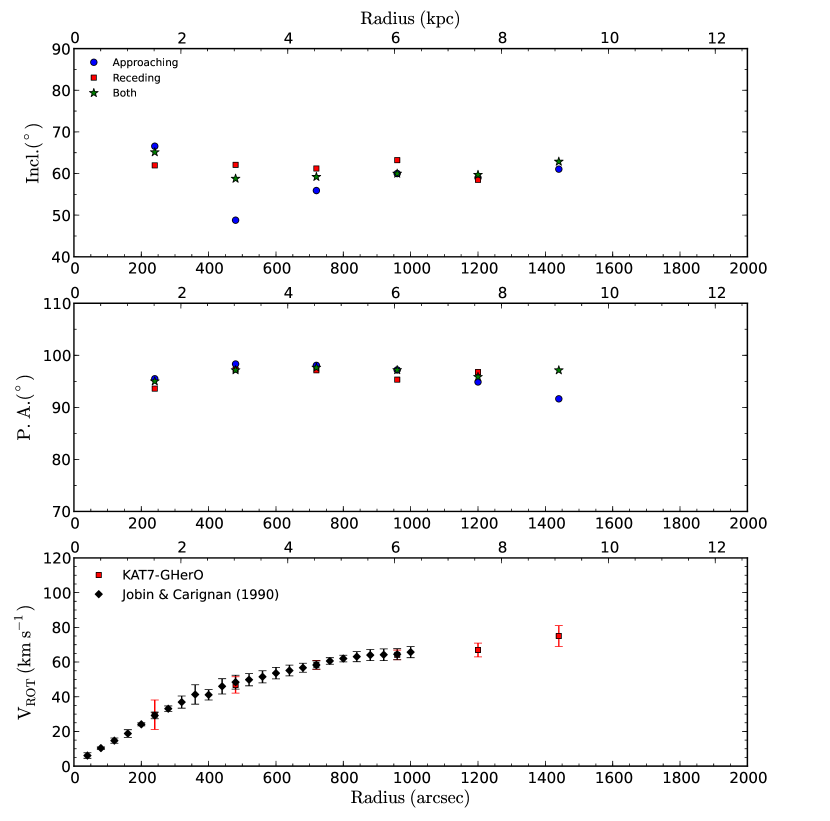
Fig. 10 shows the tilted-ting model for the intensity-weighted moment analysis of the KAT-7 na-weighted data of NGC 3109. We find = 405 2 km s-1, 4 and 8. The rotation center is found to be 0.5′ North from the optical center at 10h 03m 06.9s –26o 08′58″. This offset from the optical center is not significant and could be due to the larger synthesized beam of KAT–7. It can be seen that the agreement between the approaching and receding sides is much better than for the VLA–ANGST data. The increase in sensitivity allows us to extend the RC out to 32′ (12 kpc). Despite the low spatial resolution, no real sign of beam smearing is seen when comparing this RC to the VLA data. This may not be surprising in view of the solid-body nature of the RC.
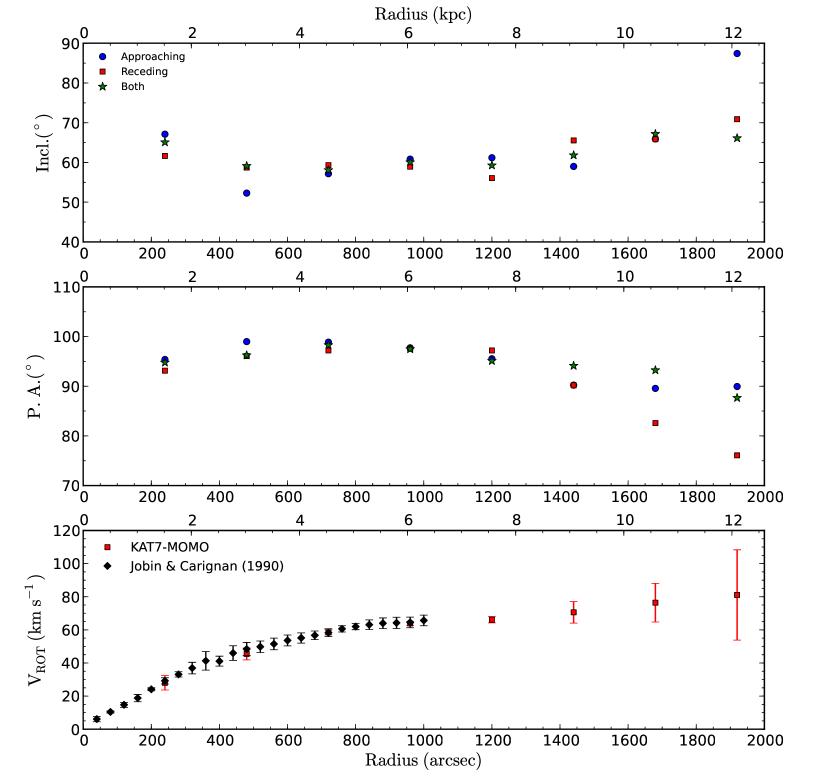
Fig. 11 shows the tilted-ting model for the Gauss-Hermite polynomials profile fitting analysis of the KAT-7 na-weighted data. The kinematical parameters found are very similar to those of the moment analysis with = 406 km s-1, and and the same rotation center. The Gauss-Hermite polynomials are fitted to the spectra in each pixel, where the peak of the fitted profile rises above 5-sigma. As such, profiles from very faint emission at the edge of the galaxy are not strong enough to ensure a good fit. Gauss-Hermite fits will therefore fail at large radii where the average signal-to-noise is lower than the cutoff. Lowering the cutoff produces too many bad velocity points. Therefore, since the RC using this technique is only defined out to 24′, the moment analysis RC is preferred for the mass models in Sec.4.
3.4.4 Asymmetric drift corrections
In the case of a galaxy like NGC 3109, where the velocity dispersion represents a substantial fraction of the rotational velocity () and thus provides part of the gravitational support, a correction for asymmetric drift must be applied. Following the procedure used by Côté, Carignan & Freeman (2000), the corrected circular velocity is given by
| (5) |
where is the corrected velocity, is the observed one, is the velocity dispersion and is the gas surface density. The asymmetric drift corrections are uncertain by about 25% (Lake & Skillman, 1989).
Table 9 shows the radial profiles for the surface densities and the velocity dispersion that were derived using the task IRING in AIPS. For the mass models, the Hi surface densities will be multiplied by 4/3 to correct for Helium. The radial profiles will be used to correct for the asymmetric drift. Table 10 presents the corrected values: column (1) gives the radius in arcsec, column (2) the observed rotation velocities, column (3) the errors on those velocities, column (4) the ratio between the velocity dispersion and the circular velocity, column (5) gives the amplitude of the correction and column (6) the corrected velocities used for the mass models. As can be seen, when /V is greater than 20%, the corrections can be of the order of a few km s-1 which is nearly 10% for a slow rotator such as NGC 3109. Usually, when /V is less than 20%, the corrections are of 1 km s-1 or less and usually neglected because they are smaller than the errors.
| Radius | ||||
|---|---|---|---|---|
| (arcsec) | M⊙ pc-2 | M⊙ pc-2 | (km s-1) | (km s-1) |
| 160 | 6.03 | 0.38 | 15.31 | 0.06 |
| 374 | 3.44 | 0.31 | 14.32 | 0.15 |
| 608 | 2.00 | 0.21 | 12.35 | 0.24 |
| 839 | 1.63 | 0.18 | 10.82 | 0.31 |
| 1080 | 1.52 | 0.17 | 10.34 | 0.32 |
| 1324 | 1.42 | 0.15 | 9.83 | 0.28 |
| 1568 | 1.29 | 0.14 | 9.23 | 0.26 |
| 1807 | 1.02 | 0.11 | 8.56 | 0.27 |
| 2050 | 0.80 | 0.08 | 8.32 | 0.26 |
| 2287 | 0.56 | 0.06 | 8.12 | 0.23 |
| 2530 | 0.35 | 0.03 | 7.91 | 0.20 |
| 2765 | 0.22 | 0.02 | 7.27 | 0.27 |
| Radius | V0 | /V | Vcorr | VC | |
|---|---|---|---|---|---|
| (arcsec) | (km s-1) | (km s-1) | % | (km s-1) | (km s-1) |
| 240 | 28.0 | 4.4 | 53 | 3.0 | 31.0 |
| 480 | 45.5 | 3.6 | 29 | 3.3 | 48.8 |
| 720 | 58.5 | 1.5 | 20 | 1.7 | 60.2 |
| 960 | 63.9 | 1.2 | 17 | 1.0 | 64.9 |
| 1200 | 66.2 | 1.9 | 15 | 0.6 | 66.8 |
| 1440 | 70.6 | 6.5 | 14 | 0.8 | 71.4 |
| 1680 | 76.4 | 11.6 | 12 | 1.4 | 77.8 |
| 1920 | 81.1 | 27.3 | 10 | 0.6 | 81.7 |
4 Mass models analysis
Low mass Surface Density (LSD) galaxies are galaxies whose mass profiles are dominated by dark matter (DM) at all galactocentric radii. LSD properties were first identified in dwarf Irregular (dIrr) galaxies (such as the prototype dIrr DDO 154: Carignan & Freeman, 1988; Carignan & Purton, 1998) and later in late–type dwarf spirals (see e.g. NGC 5585: Côté, Carignan & Sancisi, 1991). Despite the uncertainties on the exact M/L ratio of the luminous disk, LSD galaxies, such as NGC 3109, are clearly DM dominated at all radii. For that reason, they can be used to constrain important properties of dark matter haloes, such as the characteristic scale density and radius, concentration, virial mass and the exact shape of the mass density profile. Ultimately, measuring the dark matter distribution of these galaxies is necessary if one wants to test the results obtained by numerical simulations of galaxy evolution in the framework of the Cold Dark Matter (CDM) paradigm (Navarro, Frenk & White, 1997) or test alternative gravity theories such as MOND (Milgrom, 1983).
The study of their mass distribution has generated in the last 15 years the so-called cusp-core controversy: are rotation curves of LSD galaxies better reproduced by a cuspy halo as seen in the CDM numerical simulations or by a halo with a nearly constant central density core as seen in most high spatial resolution observations (e.g. Blais–Ouellette, Amram & Carignan, 2001; de Blok, McGaugh & Rubin, 2001; Marchesini et al., 2002). A good review of this debate can be found in de Blok (2010).
Nowadays, galaxies are expected to form inside cuspy Cold Dark Matter halos. High resolution velocity fields have provided important observational constraints on the dark matter distribution in LSD galaxies. These two-dimensional data show clearly that dark matter-dominated galaxies tend to be more consistent with cored than cuspy halos, at odds with the theoretical expectations. So, a lot of efforts in the last few years has gone into identifying the physical processes that could have turned initially cuspy DM halos into cored ones (Governato et al., 2012; Pontzen & Governato, 2012; Kuzio de Naray & Spekkens, 2011; Kuzio de Naray et al., 2010; Governato et al., 2010). For example, one recently suggested solution to this problem is to enforce strong supernovae outflows that move large amounts of low-angular-momentum gas from the central parts and that pull on the central dark matter concentration to create a core (Famaey & McGaugh, 2013).
4.1 Dark Matter models
4.1.1 The pseudo-isothermal DM model (ISO)
The pseudo-isothermal DM halo is an observationally motivated model with a constant central density core. The density profile is given by:
| (6) |
where is the central density and the core radius 111Note that it is different from the definition of for the true isothermal sphere (see King, 1966; Carignan & Freeman, 1985).. The corresponding rotation velocities are given by:
| (7) |
We can describe the steepness of the inner slope of the mass density profile with a power law . In the case of the ISO halo, where the inner density is an almost constant density core, .
4.1.2 The Navarro, Frenk and White DM model (NFW)
The NFW profile, also known as the ”universal density profile” (Navarro, Frenk & White, 1997) is the commonly adopted dark matter halo profile in the context of the CDM cosmology. It was derived from N-body simulations. The density profile is given by:
| (8) |
where is the characteristic radius of the halo and is related to the density of the universe at the time of collapse of the dark matter halo.The corresponding rotation velocities are given by:
| (9) |
where . It is characterized by a concentration parameter and a velocity . The radius is the radius where the density contrast with respect to the critical density of the universe exceeds 200, roughly the virial radius (Navarro, Frenk & White, 1996). The characteristic velocity is the velocity at that radius. The NFW mass density profile is cuspy in the inner parts and can be represented by , where .
4.2 ISO & NFW Models for NGC 3109
Because of the way the different velocity points are weighted in the mass model fitting algorithm, we will not combine the high spatial resolution VLA data (Jobin & Carignan, 1990) with the low spatial resolution but high sensitivity KAT–7 data. Instead, we will run a set of models for each data set. The radial surface density profile of each data set will still be used, keeping in mind that the VLA data underestimate the Hi content, which will not be the case for the KAT–7 data. The I band luminosity profile of Jobin & Carignan (1990) is preferred to IR (e.g. 2.6m) profiles because it extends to much larger radii.
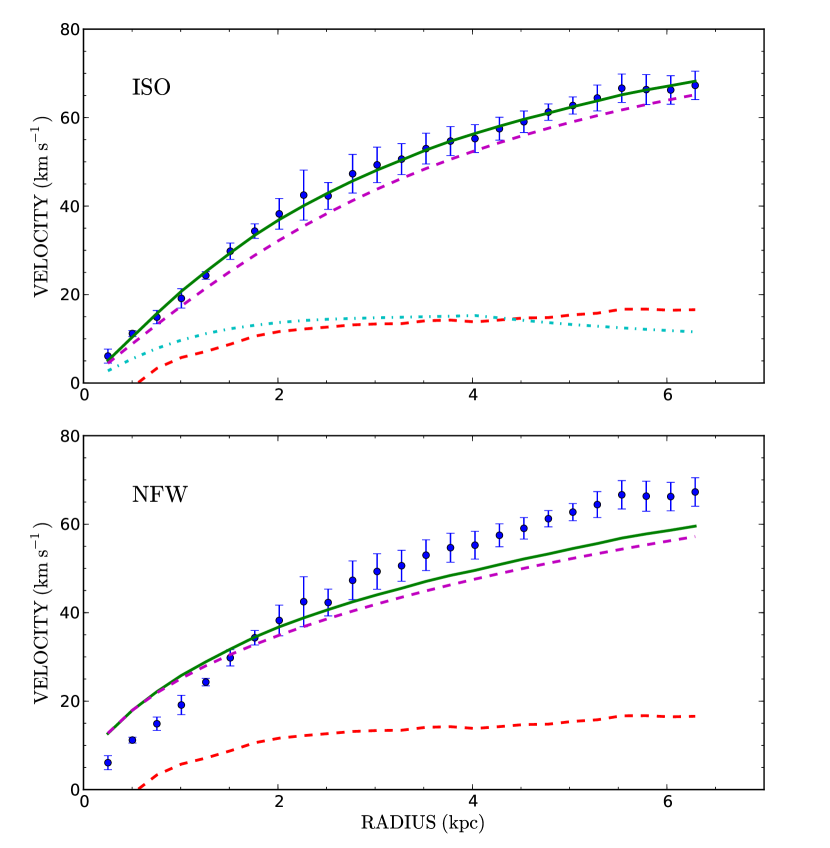
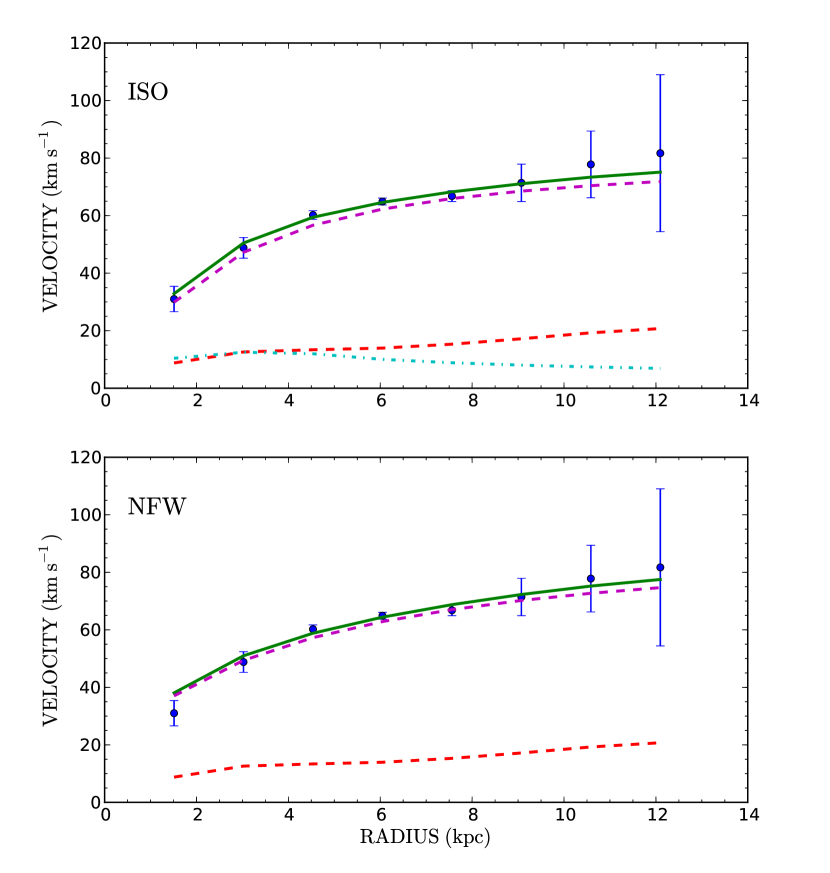
NGC 3109 presents an interesting test for the DM models. Because it has no bulge and a very shallow velocity gradient, it is an ideal system to address the cusp–core controversy. The DM models are shown in Fig. 12 for the Jobin & Carignan (1990) data and in Fig. 13 for the KAT–7 data. The results are summarized in Table 11. It can be seen that the ISO models fit almost perfectly the observed RC with a reduced of only 0.24 for the VLA data and 0.31 for the KAT–7 data. On the other hand, the NFW model has much less success with a reduced = 12.9 for the VLA data and 0.86 for the KAT–7 data. However, because of the low spatial resolution, the KAT–7 data do not probe the very inner parts where the discrepancy with the observations is expected to be the greatest.
| Telescope | Model | Parameter | Result |
|---|---|---|---|
| VLA | ISO | 0.76 | |
| 3.2 kpc | |||
| 0.018 M⊙ pc-3 | |||
| 0.24 | |||
| NFW | 0.00 | ||
| c | 2.1 | ||
| 77.4 kpc | |||
| 12.9 | |||
| KAT–7 | ISO | 0.55 | |
| 2.1 kpc | |||
| 0.028 M⊙ pc-3 | |||
| 0.31 | |||
| NFW | 0.00 | ||
| c | 3.9 | ||
| R200 | 58.1 kpc | ||
| 0.86 |
The NFW model completely fails in the inner 1 kpc, overestimating the first velocity point by a factor of two for the VLA data. However, the main problem with the NFW models is that the best fits to both the VLA and the KAT–7 data suggest a M/L of 0 for the stellar disk, which is unphysical. This is understandable since any stellar disk component would just increase the discrepancy in the inner parts. On the other hand, the best fit ISO model has (M/L)I = 0.55–0.76 which is quite compatible with the value predicted by stellar population models of 0.67 0.04 (Bell & de Jong, 2001) for the band. Without any doubt, in the DM halo paradigm, those results confirm that NGC 3109 has a cored and not a cuspy halo.
4.3 MOND models
MOND was proposed by Milgrom (1983) as an alternative to dark matter. Milgrom postulated that at small accelerations the usual Newtonian dynamics break down and the law of gravity needs to be modified. MOND has been claimed to be able to explain the mass discrepancies in galaxies without dark matter (e.g. Begeman, Broeils & Sanders, 1991; Sanders, 1996; Bottema et al., 2002). Therefore, in the MOND formalism, only the contributions of the gas component and of the stellar component are required to explain the observed rotation curves.
The transition between the Newtonian and the MONDian regime is characterized by an acceleration threshold value called a0 below which MOND should be used. So, in the MOND framework, the gravitational acceleration of a test particle is given by :
| (10) |
where is the gravitational acceleration, a0 is a new universal constant which should be the same for all galaxies, (x) is the MOND interpolating function and the Newtonian acceleration.
The standard and simple interpolating functions are mostly used in the literature. The standard -function is the original form of the interpolating function proposed by Milgrom (1983). However, Zhao & Famaey (2006) found that a simplified form of the interpolating function not only provides also good fits to the observed rotation curves but the derived mass-to-light ratios are more compatible with those obtained from stellar populations synthesis models.
4.3.1 MOND models using the ”standard” interpolation function
The standard interpolating function is given as
| (11) |
For the system is in deep MOND regime with a0)1/2 and for 1 the gravity is Newtonian.
The MOND rotation curve becomes:
| (12) |
where
| (13) |
, , are the contributions from the bulge, the disk and the gas to the rotation curve. In the case of the Magellanic-type spiral NGC 3109, there is no bulge to consider.
4.3.2 MOND models using the ”simple” interpolation function
The simple interpolating function is given by
| (14) |
Using the same procedure as in previous section we can easily obtain the corresponding rotation velocities:
| (15) |
4.4 MOND Models for NGC 3109
NGC 3109 presents an interesting test for MOND. As we have seen, it is close enough to have a very accurate distance determination using Cepheids and the largest portion of the luminous mass is in the form of gas and not stars, partly freeing us from the uncertainties due to the M/L value used for the disk. The internal accelerations are very low, therefore the galaxy is completely within the MOND regime (Lake, 1989).
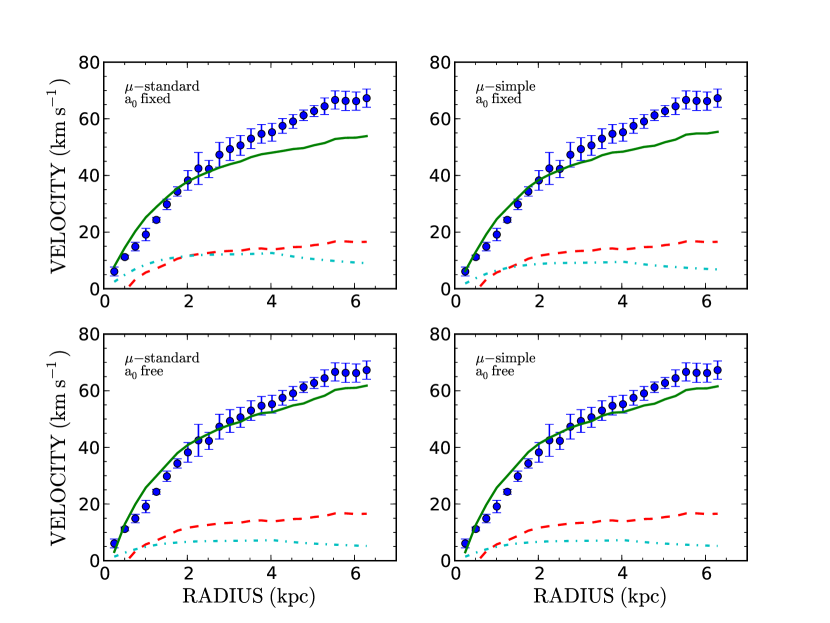
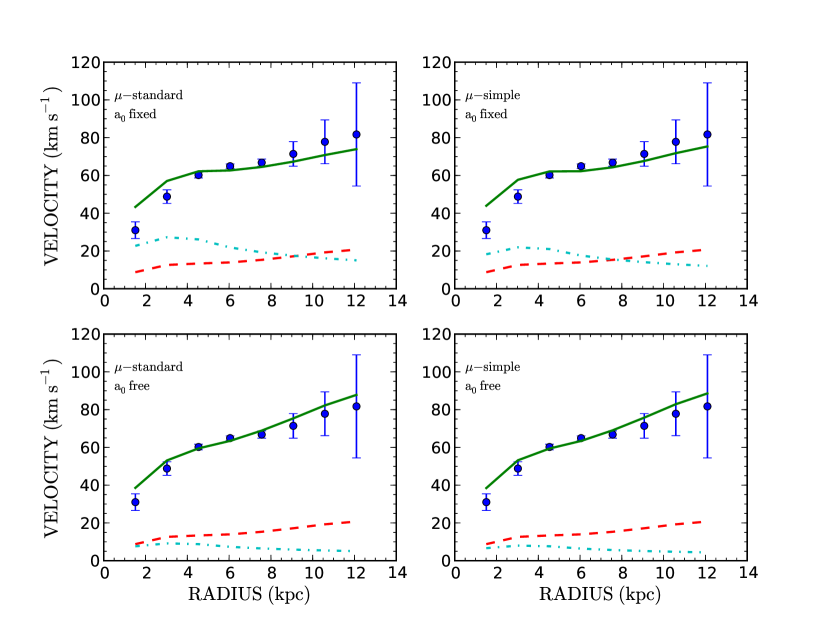
The MOND mass models for the VLA data are presented in Fig. 14 & Table 12 and in Fig. 15 & Table 13 for the KAT–7 data, for both the standard value of , namely 1.21 x 10⁻⁸ cm sec-2 (Begeman, Broeils & Sanders, 1991) and with left as a free parameter. The standard and the simple interpolation functions are also illustrated.
| a0 | Parameter | Result | |
|---|---|---|---|
| 10-8 cm s-2 | |||
| fixed | standard | (M/L)I | 0.45 |
| a0 | 1.21 | ||
| 12.01 | |||
| simple | (M/L)I | 0.26 | |
| a0 | 1.21 | ||
| 9.25 | |||
| free | standard | (M/L)I | 0.15 |
| a0 | 2.48 | ||
| 5.50 | |||
| simple | (M/L)I | 0.15 | |
| a0 | 2.07 | ||
| 5.57 |
| a0 | Parameter | Result | |
|---|---|---|---|
| 10-8 cm s-2 | |||
| fixed | standard | (M/L)I | 2.61 |
| a0 | 1.21 | ||
| 2.96 | |||
| simple | (M/L)I | 1.69 | |
| a0 | 1.21 | ||
| 3.38 | |||
| free | standard | (M/L)I | 0.29 |
| a0 | 3.48 | ||
| 1.30 | |||
| simple | (M/L)I | 0.22 | |
| a0 | 3.25 | ||
| 1.37 |
In the case of the VLA data, the fits are poor for all the cases: they overestimate the velocities in the inner parts and they underestimate them in the outer parts. The reduced are much larger than for the DM fits, varying from 5.5 to 12. However, since most of the luminous mass is in gas and since the VLA misses 40% of the flux, we should not expect good fits.
The MOND models have more significance for the KAT–7 data than for the VLA data, since we probe the gas on all scales. In this case we see that for the standard fixed value of a0 = 1.21 x 10⁻⁸ cm sec-2, the results of the models are poor with reduced of 3.0 to 3.4 and (M/L)B values 3 to 4 times larger than the value predicted by stellar population models. However, we see that if a0 is free to vary, we get more reasonable fits with reduced down to 1.30 and 1.37, still 4–5 times larger than for the DM ISO models. The main problems with those models are the very small (M/L)I values, 2 to 3 times smaller than the expected values and the large values of the constant which is greater than a factor of 2 compared to the standard value.
5 Discussion
We will now examine different questions that were raised by this study. The first one is the difference found between the kinematic inclination and the photometric values. This is an important point to understand since scales the RC and is responsible for the velocity gradient of the rising part of the RC, which really constrains the mass models and set the M/L ratio of the luminous disk. Both tilted-ring models using the intensity-weighted and the profile fitting techniques find the same inclination of = 61o. It is important to understand how this parameter is determined. Assuming an axisymmetric disk, the tilted–ring model tries to find the value that minimizes the dispersion of the velocities in the rings.
On the other hand, looking at Table 14, it can be seen that the inclination varies from 78.5o in B to 73.5o in I and 69.5o in the 3.6m. What is going on is quite clear. Each photometric band samples different stellar populations. The B–band samples the young blue Pop I stars which are confined to the thin disk, the I–band samples a mixture of young and old Pop I stars which are in a thicker disk while the 3.6m is completely dominated by an old disk population in an even thicker disk. This explains that progression of the inclination from 80o to 70o.
| Parameter | Ref | |
|---|---|---|
| Orientation parameters, | ||
| Axis ratio, b/a | 0.20 0.02 | (1) |
| Inclination**no correction for intrinsic flattening. | 78.5o | (1) |
| 91.5o | (1) | |
| Orientation parameters, | ||
| Axis ratio, b/a | 0.28 0.02 | (2) |
| Inclination**no correction for intrinsic flattening. | 73.5o | (2) |
| 93.0o | (2) | |
| Orientation parameters, 3.6 m | ||
| Axis ratio, b/a | 0.35 0.02 | (3) |
| Inclination**no correction for intrinsic flattening. | 69.5o | (3) |
| 95.0o | (3) | |
It is instructive to look at the ellipse fits to the Hi isophotes. As can be seen in Table 15, NGC 3109 is really composed of 2 disks: an inner one, corresponding to the optical disk, with 76o, which is the mean of the B and I inclinations and an outer disk with 63o which, within the errors, agree with the kinematical inclination. The double disk is quite apparent when looking at the Hi isophotes in Fig. 2. Therefore, since the photometric inclination is most sensitive to the emission of the stellar populations being traced, it is quite clear that the kinematic inclination should be preferred. The photometric values should only be used as starting values in the tilted–ring modeling.
| Isophotes | q (axis ratio) | q | i (inclination) | i |
|---|---|---|---|---|
| 1.00 | 0.506 | 0.049 | 59.6 | 3.3 |
| 3.00 | 0.403 | 0.022 | 66.2 | 1.4 |
| 5.00 | 0.256 | 0.029 | 75.2 | 1.8 |
| 7.00 | 0.246 | 0.018 | 75.8 | 1.1 |
| 9.00 | 0.257 | 0.011 | 75.1 | 0.7 |
| 11.00 | 0.255 | 0.007 | 75.2 | 0.3 |
| 13.00 | 0.247 | 0.005 | 75.7 | 0.3 |
| 15.00 | 0.247 | 0.004 | 75.7 | 0.2 |
| 17.00 | 0.255 | 0.004 | 75.2 | 0.2 |
| 19.00 | 0.278 | 0.005 | 73.9 | 0.3 |
| 21.00 | 0.326 | 0.006 | 71.0 | 0.4 |
| 23.00 | 0.448 | 0.011 | 63.4 | 0.7 |
| 25.00 | 0.460 | 0.016 | 62.6 | 1.0 |
| 27.00 | 0.460 | 0.018 | 62.6 | 1.2 |
| 29.00 | 0.446 | 0.018 | 63.5 | 1.2 |
| 31.00 | 0.446 | 0.010 | 63.5 | 0.6 |
Another point worth discussing is beam-smearing. With such a large synthesized beam 4′, one would have expected beam smearing to be quite important. However when looking at Figures 10 and 11, this does not seem to be the case. As explained in Carignan (1985), beam smearing is the result of the convolution of the Gaussian beam with the Hi distribution and the velocity gradient across the beam. If the Hi distribution is steep and/or the velocity gradient is large, the net effect will be to underestimate the observed velocity or conversely to overestimate the effective radius (the product of the convolution) that is observed. In the case of NGC 3109, the Hi distribution is fairly flat across the beam and the velocity gradient of that galaxy is very small. Those two properties render the beam smearing negligible. Should we be observing another galaxy with a step velocity gradient and/or a steep radial Hi distribution, beam smearing would be important.
Let us now turn to the mass models. First, the results of the DM ISO models for both RCs confirm the previous results that it provides an almost perfect fit to the observed kinematics with the difference that the KAT–7 model has a more massive Hi disk. As expected, this translates in a smaller stellar disk M/L value for the KAT–7 data. In both cases, the mass–to–light ratio found for the disk is compatible with population synthesis models. The NFW models again fail to reproduce the kinematics. In the inner kpc, the velocities are overestimated by a large factor, despite an unphysical M/L ratio of 0 for the stellar disk. In the DM halo paradigm, clearly NGC 3109 has a cored and not a cuspy halo, at least at the present epoch.
What about the MOND models ? Twenty-five years ago, Sanders (1986) pointed out that the MOND mass of NGC 3109 predicted using Milgrom’s suggested value for a0 was 5 x 10⁸ M⊙, thus larger than the Hi mass using the larger distance estimates known at the time between 1.7 to 2.6 Mpc (Carignan, 1985). This is not the case anymore with the smaller well determined distance of 1.3 Mpc, but still our determined Hi mass with KAT–7 is less than 10% smaller than this MOND mass, which implies unphysically small M/L values for the stars in the case where the fits have been improved letting the constant free to vary.
When Begeman, Broeils & Sanders (1991) produced a MOND model using the Jobin & Carignan (1990) VLA data, they argued that they could not get a good fit because the VLA data was missing a substantial part of the flux and that the Hi mass had to be multiplied by 1.67 to get a reasonable fit. However, since the KAT–7 data retrieve all the NGC 3109 flux, this cannot be used as an argument with the present data which convincingly show that MOND cannot reproduce the observed kinematics of NGC 3109 with physically acceptable parameter values. Unless some other explanation can be found, the KAT–7 data surely challenge the MOND theory.
What about the possible interaction between the Magellanic-type spiral NGC 3109 and the dIrr/dSph Antlia, suggested by the Hi isophotes being slightly elongated ? The high surface brightness sensitivity of the KAT-7 observations allow us to trace the lopsidedness of NGC 3109 to larger radii, however there is no further obvious evidence of an interaction with Antlia, leaving the question open for further investigation. NGC 3109 has a systemic velocity of 404 km s-1 while Antlia has 360 km s-1. Aparicio et al. (1997) calculated the physical separation between NGC 3109 and Antlia to be between 29 and 180 kpc, with a maximum separation of 37 kpc for the pair to be bound.
The situation for the Local Group dwarfs can guide us. Grcevich & Putman (2009) showed clearly that the majority of dwarf galaxies within 270 kpc of the Milky Way or Andromeda are undetected in Hi ( M⊙ for the Milky Way dwarfs), while those further than 270 kpc are predominantly detected with masses to M⊙ (Antlia has an Hi mass of 106 M⊙) meaning the nearby ones must have been stripped of their gas. While the halo of NGC 3109 is not as large as the Milky Way halo, if a close encounter had happened in the past, it is quite likely that Antlia would also have been stripped of its gas.
Nevertheless, some kind of interaction really seems to have taken place, as shown by the Hi isophotes of the two galaxies pointing toward each other. However, in view of the large difference in masses between the two systems and the absence of any external traces of such an interaction, it is believed that the internal kinematics of NGC 3109 cannot have been severely altered.
Anyway, if such an interaction did take place, it would be more the rule than the exception. Massive galaxies usually have a significant population of gas-rich dwarf companions and interaction with these will show kinematic and morphological signatures in the extended HI disks (Mihos et al., 2012) such as warps, plumes, tidal tails, high-velocity clouds (e.g. Hibbard et al., 2001; Sancisi et al., 2008) or even stellar streams (Lewis et al., 2013). Galaxies are said to be embedded in the cosmic web, seen in the CDM numerical simulations (Springel, Frenk &White, 2006). Such signatures of interaction have been studied close to massive galaxies such as the interconnecting network in the M81/M82 system (Yun, Ho & Lo, 1994) or the tidal tail in the Leo triplet (Haynes, Giovanelli & Roberts, 1979). More recently, Mihos et al. (2012) using the Green Bank Telescope (GBT) found a plume in the outer disk of M101 with a peak column density of 5 x 1017 cm-2 and two new Hi clouds close to that plume with masses of 107 M⊙. While KAT–7 would not have detected such low column densities, it is interesting to look at our detection cloud mass limit.
To calculate a characteristic Hi mass sensitivity, we assume that low–mass clouds would be unresolved in our beam and use the relation (Mihos et al., 2012):
| (16) |
where is the distance, is the rms noise in one channel and is the channel width. This means that our 3 cloud mass detection limit is around 5–6 x 10³ M⊙ at the distance of NGC 3109. We should thus have easily detected similar clouds like the ones observed around M101, if they had been present.
6 Summary and conclusions
The first Hi spectral line observations with the prototype radio telescope KAT–7 have been presented. The high sensitivity of KAT–7 to large scale, low column density emission comes not only from its compact configuration, but also from its very low Tsys receivers. With 25 hours of observations per pointing, surface densities of 1.0 x 10¹⁹ atoms cm-2 were reached, which could be improved when the telescope will be fully commissioned, since the theoretical noise was not reached with the present dataset.
The main results from this study are:
-
•
A total Hi mass of 4.6 x 10⁸ M⊙ is measured for NGC 3109, using our adopted distance of 1.3 Mpc. This Hi mass, which is 40% larger than the values calculated using VLA observations, is surely a better estimate of the total Hi mass of NGC 3109 since KAT–7 is sensitive to the large scales for which the VLA is not.
-
•
The Hi disk extends over a region of 58′(EW) x 27′(NS) down to a limiting column density of 1.0 x 10¹⁹ atoms cm-2.
-
•
The Hi distribution is lopsided with more Hi on the SW approaching side. Because of this, no intensity-weighted velocity is derived from the global profile but rather a mid-point velocity of 404 2 km s-1, believed to be more representative of the systemic velocity of NGC 3109. Profile widths of V50 = km s-1 and V20 = km s-1 are derived.
-
•
VLA-ANGST data were used to derive the Hi properties of the dSph/dIrr Antlia, since the spatial resolution of KAT–7 is too low to study this dwarf system. A total Hi mass of 1.5 x 10⁶ M⊙ is measured for our adopted distance of 1.31 Mpc. An intensity-weighted mean velocity of km s-1 is derived along with a V50 = km s-1 and a V20 = km s-1.
-
•
A tilted–ring model was obtained for the high velocity resolution VLA–ANGST data of NGC 3109. As on the Hi total intensity map, it can be seen that the warp is more important on the approaching side. The RC found is nearly identical to the one derived by Jobin & Carignan (1990) which had a velocity resolution of 10 km s-1. Because the latter study provides correction for asymmetric drift, it was preferred for the mass model analysis.
-
•
Rotation curves from the KAT–7 data of NGC 3109 were derived from two different types of analysis: an intensity–weighted moment analysis and a Gauss–Hermite polynomial profile fitting. Both data sets give essentially the same result with = 405 km s-1 and mean = 96o and = 61o, with very little difference between the approaching and the receding side. The KAT–7 RCs agree very well with the VLA data in the inner parts while allowing to extend the rotation data by a factor of 2 out to 32′. Since the moment analysis data allow us to derive the RC further out, it was used for the mass models.
-
•
The observationally motivated DM ISO model reproduces very well the observed RCs of both the Jobin & Carignan (1990) and the KAT–7 data while a cosmologically motivated NFW model gives a much poorer fit, especially in the very inner parts. Because of the high spatial and velocity resolutions data available and the very small errors on those velocities, this cannot be attributed to poor data. NGC 3109 definitely has a cored and not a cuspy DM halo.
-
•
While it is clear that having the proper gas distribution has reduced the discrepancies between the observed RC and the MOND models, the unreasonable (M/L) and large values obtained lead us to conclude that we cannot get acceptable MOND models for NGC 3109. The distance being so well determined with very small errors from Cepheids observations and the Hi mass so well constrained by the KAT–7 observations, uncertainties on these two values cannot explain why the MOND models fail to reproduce the observed kinematics with reasonable parameters.
-
•
Besides some elongation of the outer isophotes, already seen in previous observations, no further evidence is found for past encounter and/or interaction between the Magellanic-type spiral NGC 3109 and the dSph/dIrr Antlia.
Our findings for NGC 3109 are not an isolated case. Recently, Sánchez–Salcedo, Hidalgo–Gamez & Martinez–Garcia (2013) studied a sample of slowly rotating gas–rich galaxies in the MOND framework. These are again galaxies in the full low acceleration MOND regime. They found at least five such systems (especially NGC 4861 and Holmberg II) that deviate strongly from the MOND predictions, unless their inclinations and distances differ strongly from the nominal values. In the case of NGC 3109, those two parameters are much more constrained which makes it harder to reconcile MOND with the observed kinematics.
Those observations obtained with KAT-7 have shown that despite its relatively small collecting area (7 x 12 m antennae), this telescope really has a niche for detecting large scale low emission over the 1o FWHM of its antennae. It should be kept in mind that this telescope was built primarily as a testbed for MeerKAT and the SKA such that any scientific result that can be obtained is a bonus. While most of the extragalactic Hi sources would be unresolved by the 4′ synthesized beam, many projects such as this one on NGC 3109 can be done on nearby very extended objects such as Local Group galaxies or galaxies in nearby groups like Sculptor.
Appendix A Appendix: Other galaxies in the field
A.1 ESO 499-G037 (UGCA 196)
ESO 499-G037 is a SAB(s)d spiral (de Vaucouleurs et al., 1991). It has very bright Hii regions and star formation activity, as seen in the GALEX image (de Paz et al., 2007). Fig. 16 shows the Hi intensity map, superposed on an optical image. We see that the Hi disk has a diameter of 12.5′, nearly 4 times the optical size (de Vaucouleurs et al., 1991). Because of the low spatial resolution of the KAT–7 data, these observations do not allow to derive a proper RC.
Fig. 17 shows the global profile of ESO 499-G037. From it, a systemic velocity of 953 3 km s-1 is found, similar to the HIPASS determination of 954 5 km s-1 (Koribalski et al., 2004) and the value of 955 1 km s-1 determined by Barnes & de Blok (2001). Velocity widths of V50 = km s-1 and V20 = km s-1 are derived. A total flux of 51.7 5.2 Jy km s-1 is measured, which is 25% larger than the HIPASS flux of 40.2 4.2 Jy km s-1 but consistent with the value of 49 2 Jy km s-1 from Barnes & de Blok (2001), also using the Parkes multi–beam system, or the Green Bank value of 48.4 2.4 Jy km s-1 (Springob et al., 2005).

A.2 ESO 499-G038 & the Hi cloud
ESO 499-G038 is a late–type Sc galaxy with, as can be seen in Fig. 18, a very extended Hi component and a likely associated Hi cloud to the NW, as shown by the faintest contour at 2.5 x 1018 cm-2. While the velocity field shows clear rotation, it is not possible to say more about the kinematics with the present data. Our spatial resolution is sufficient, however, to nearly resolve the two components in the global Hi profile shown in Fig. 19.
We measured a systemic velocity of 871 4 km s-1 for ESO 499-G038 and 912 5 km s-1 for the Hi cloud. These are surely better estimates then the values of 885 5 km s-1 (Koribalski et al., 2004) and 888 3 km s-1 (Barnes & de Blok, 2001) given for the systemic velocity of ESO 499-G038 from their unresolved multi—beam profiles. Fluxes of 9.4 0.9 and 1.5 0.2 Jy km s-1 are measured for the galaxy and the cloud. This can be compared to 9.5 2 (Koribalski et al., 2004) and 11.4 1 Jy km s-1 (Barnes & de Blok, 2001) from the unresolved Parkes’ spectra.
 |
 |
References
- Aparicio et al. (1997) Aparicio, A., Dalcanton, J. J., Gallart, C., & Martinez-Delgado, D. 1997, AJ, 114, 1447
- Barnes & de Blok (2001) Barnes, D. G., & de Blok, W. J. G. 2001, AJ, 122, 825
- Begeman (1989) Begeman, K. G. 1989, A&A, 223, 47
- Begeman, Broeils & Sanders (1991) Begeman, K. G., Broeils, A. H., & Sanders, R. H. 1991, MNRAS, 249, 523
- Bell & de Jong (2001) Bell, E. F., & de Jong, R. S. 2001, ApJ, 550, 212
- Blais–Ouellette, Amram & Carignan (2001) Blais–Ouellette, S., Amram, P., & Carignan, C. 2001, AJ, 121, 1952
- Bottema et al. (2002) Bottema, R., Pestana, J. L. G., Rothberg, B., & Sanders, R. H. 2002, A&A, 393, 453
- Carignan (1985) Carignan, C. 1985, AJ, 299, 59
- Carignan & Freeman (1985) Carignan, C., & Freeman, K. C. 1985, ApJ, 294, 494
- Carignan & Freeman (1988) Carignan, C., Freeman, K.C., 1988, ApJ, 332, L33
- Carignan & Purton (1998) Carignan, C., Purton, C., 1998, AJ, 506, 125
- Capaccioli, Piotto & Bresolin (1992) Capaccioli, M., Piotto, G.,& Bresolin, F. 1992, AJ, 103, 1151
- Côté, Carignan & Freeman (2000) Côté, S., Carignan, C., & Freeman, K. C. 2000, AJ, 120, 3027
- Côté, Carignan & Sancisi (1991) Côté, S., Carignan, C., Sancisi, R., 1991, AJ, 102, 904
- Dean & Davies (1975) Dean, J. F., & Davies, R. D. 1975, MNRAS, 170, 503
- de Blok (2010) de Blok W.J.G. 2010, AdAst2010E, 5
- de Blok, McGaugh & Rubin (2001) de Blok W.J.G., McGaugh S.S., & Rubin V. C. 2001, AJ, 122, 2396
- de Blok et al. (2001) de Blok W. J. G., McGaugh S. S., Bosma A., & Rubin V. C. 2001, ApJ, 552, L23
- de Paz et al. (2007) de Paz, A. G. et al. 2007, ApJS, 173, 185
- de Vaucouleurs et al. (1991) de Vaucouleurs, G., de Vaucouleurs, A., Corwin, H. G., Jr, Buta, R. J., Paturel, G., & Fouqué, P. 1991, Third Reference Catalogue of Bright Galaxies, Vols. 1–3 (Berlin: Springer)
- de Villiers (2007) de Villiers, M. 2007, A&A, 469, 793
- Epstein (1964) Epstein, E. E. 1964, AJ, 69, 490
- Famaey & McGaugh (2013) Famaey, B., & McGaugh, S. 2013, arXiv1301.0623
- Fouqué et al. (1990) Fouqué, P., Bottinelli, L., Durand, N., Gouguenheim, L., & Paturel, G. 1990, A&AS, 86, 473
- Governato et al. (2010) Governato, F. et al. 2010, Nature, 463, 203
- Governato et al. (2012) Governato, F. et al. 2012, MNRAS, 422, 1231
- Grcevich & Putman (2009) Grcevich, J., & Putman, M.E. 2009, ApJ. 696, 385
- Grebel, Gallagher & Harbeck (2003) Grebel, E. K., Gallagher, J. S. III, & Harbeck, D. 2003, AJ, 125, 1926
- Greisen (2003) Greisen, E. W. 2003, Astrophysics and Space Science Library, 285, 109
- Haynes, Giovanelli & Roberts (1979) Haynes, M. P., Giovanelli, R., & Roberts, M. S. 1979, ApJ, 229, 83
- Hibbard et al. (2001) Hibbard, J.E., van Gorkom, J. H., Rupen, M. P., & Schiminovich, D. 2001, in Gas and Galaxy Evolution (ASP Conf. Ser. 240) ed. J. E. Hibbard, M. P. Rupen & J. H. van Gorkom (San Francisco, CA: ASP), 657
- Huchtmeier (1973) Huchtmeier, W. 1973, A&A, 22, 27
- Huchtmeier, Seiradakis & Materne (1980) Huchtmeier, W., Seiradakis, J. H., & Materne, J. 1980, A&A, 91, 341
- Jobin & Carignan (1990) Jobin, M., & Carignan, C. 1990, AJ, 100, 648
- King (1966) King, I. R. 1966, AJ, 71, 64
- Koribalski et al. (2004) Koribalski, B. S. et al. 2004, AJ, 128, 16
- Kuzio de Naray & Spekkens (2011) Kuzio de Naray R., & Spekkens, K. 2011, ApJ, 741, L29
- Kuzio de Naray et al. (2010) Kuzio de Naray R., Martinez, G.D., Bullock, J.S., & Kaplinghat, M. 2010, ApJ, 710, L161
- Lake (1989) Lake, G. 1989, ApJ, 345, L17
- Lake & Skillman (1989) Lake, G., & Skillman, E. D. 1989, AJ, 98, 1274
- Lewis et al. (2013) Lewis, G. F. et al. 2013, ApJ, 763, 4L
- Marchesini et al. (2002) Marchesini D., D’Onghia E., Chincarini G., Firmani C., Conconi P., Molinari E., & Zacchei A. 2002, ApJ, 575, 801
- Mateo (1998) Mateo, M. 1998, ARA&A, 36, 435
- McMullin et al. (2007) McMullin, J. P., Waters, B., Schiebel, D., Young, W., & Golap, K. 2007, Astronomical Data Analysis Software and Systems XVI, 376, 127
- Mihos et al. (2012) Mihos, J. C., Keating, K.M., Holley–Bockelmann, K., Pisano, D. J., & Kassim, N. E. 2012, ApJ, 761, 186
- Milgrom (1983) Milgrom, M. 1983, ApJ, 270, 365
- Milgrom (1988) Milgrom, M. 1988, ApJ, 333,689
- Musella, Piotto &Capaccioli (1997) Musella, I., Piotto, G., & Capaccioli, M. 1997, AJ, 114, 976
- Navarro, Frenk & White (1996) Navarro J. F., Frenk C. S., & White S. D. M. 1996, ApJ, 462, 563
- Navarro, Frenk & White (1997) Navarro J. F., Frenk C. S., & White S. D. M. 1997, ApJ, 490, 493
- Ott et al. (2012) Ott, J. et al. 2012, AJ, 144, 123
- Penny et al. (2012) Penny, S. J., Pimbblet, K. A., Conselice, C. J., Brown, M. J. I., Gr tzbauch, R., & Floyd, D. J. E. 2012, ApJ, 758, 32
- Pietrzyński et al. (2006) Pietrzyński, G. et al. 2006, ApJ, 648, 366
- Pimbblet & Couch (2012) Pimbblet, K. A., & Couch, W. J. 2012, MNRAS, 419, 1153
- Pontzen & Governato (2012) Pontzen, A., & Governato, F. 2012, MNRAS, 421, 3464
- Randriamampandry (2013) Randriamampandry, T. H. 2013, Msc thesis, University of Cape Town
- Sánchez–Salcedo, Hidalgo–Gamez & Martinez–Garcia (2013) Sánchez–Salcedo, F. J., Hidalgo–Gámez, A. M., & Martínez–García, E. E. 2013, AJ, 145, 61
- Sancisi et al. (2008) Sancisi, R., Fraternali, F., Oosterloo, T., & van der Hulst, T. 2008, A&AR, 15, 189
- Sandage (1961) Sandage, A. 1961, The Hubble Atlas of Galaxies, (Washington: Carnegie Institution), p. 39
- Sanders (1986) Sanders, R. H. 1986, MNRAS, 223, 539
- Sanders (1996) Sanders, R. H. 1996, ApJ, 473, 117
- Sault, Teuben & Wright (1995) Sault R. J., Teuben P. J., & Wright M. C. H. 1995. In Astronomical Data Analysis Software and Systems IV, ed. R. Shaw, H.E. Payne, J.J.E. Hayes, ASP Conference Series, 77, 433
- Skillman et al. (1987) Skillman, E. D., Bothun, G. D., Murray, M. A., & Warmels, R. H. 1987, A&A, 185, 61
- Soszyński et al. (2006) Soszyński, I., Gieren, W., Pietrzyński, G., Bresolin, F., Kudritzki, R.–P., & Strom, J. 2006, ApJ, 648, 375
- Springob et al. (2005) Springob, C. M., Haynes, M. P., Giovanelli, R., & Kent, B. R. 2005, ApJS, 160, 149
- van Damme (1966) van Damme, K. J. 1966, Aust. J. Phys, 19, 687
- van der Hulst et al. (1992) van der Hulst, J. M., Terlouw, J. P., Begeman, K., Zwitser, W., & Roelfsema, P.R. 1992, in ASP Conf. Ser., Vol. 25, P. 131
- van den Bergh (1994) van den Bergh, S. 1994, AJ, 107, 1328
- Springel, Frenk &White (2006) Springel, V., Frenk, C. S., & White, S. D. M. 2006, Nature, 440, 1137
- Whiteoak & Gardner (1977) Whiteoak, J. B., & Gardner, F. F. 1977, Aust. J. Phys, 30, 187
- Yun, Ho & Lo (1994) Yun, M. S., Ho, P. T. P., & Lo, K. Y. 1994, Nature, 372, 530
- Zhao & Famaey (2006) Zhao, H. S., & Famaey, B. 2006, ApJ, 638, L9