A low-mass cut-off near the hydrogen burning limit for Salpeter-like initial mass functions in early-type galaxies
Abstract
We conduct a detailed investigation of the properties of the stellar initial mass function (IMF) in two massive early-type lens galaxies with velocity dispersions of and , for which both HST imaging and X-Shooter spectra are available. We compare the inferences obtained from two fully independent methods: (i) a combined gravitational lensing and stellar dynamics (L&D) analysis of the data sets employing self-consistent axisymmetric models, and (ii) a spectroscopic simple stellar population (SSP) analysis of optical line-strength indices, assuming single power-law IMFs. The results from the two approaches are found to be in agreement within the 1- uncertainties. Both galaxies are consistent with having a Salpeter IMF (power-law slope of ), which is strongly favoured over a Chabrier IMF (), with probabilities inferred from the joint analysis of and , respectively. Bottom-heavy IMFs significantly steeper than Salpeter () are ruled out with decisive evidence (Bayes factor ) for both galaxies, as they exceed the total mass derived from the L&D constraints. Our analysis allows, for the first time, the inference of the low-mass cut-off of the IMF (). Combining the joint L&D and SSP analyses of both galaxies, we infer an IMF slope of , consistent with Salpeter IMF, and a low-mass limit , just above the hydrogen burning limit.
keywords:
gravitational lensing: strong — galaxies: elliptical and lenticular, cD — galaxies: kinematics and dynamics — galaxies: stellar content — galaxies: structure1 Introduction
The stellar initial mass function is a fundamental quantity to understand the evolution and structure of galaxies, since it is crucial in determining many key properties of stellar populations and galaxies, such as star formation rates and galaxy stellar masses. While it has long been assumed that the IMF is universal, given that the IMF appears to be largely invariant throughout the Local Group (Kroupa, 2001; Chabrier, 2003; Bastian et al., 2010; Kroupa et al., 2013), in recent years numerous extra-galactic studies have provided mounting evidence that the steepness of the IMF profile might vary with galaxy mass, stellar velocity dispersion or morphological type (e.g. Trager et al. 2000; Graves et al. 2009; Treu et al. 2010; van Dokkum & Conroy 2010; Auger et al. 2010; Barnabè et al. 2012, hereafter B12; Geha et al. 2013; Dutton et al. 2013). In particular, there are strong indications that massive elliptical galaxies are characterized by a classic single power-law Salpeter (1955) IMF ( with slope , where is the number of stars of mass ), possibly becoming steeper with increasing total galaxy mass (see e.g. Grillo et al. 2009; van Dokkum & Conroy 2010; Barnabè et al. 2009, 2011; Cappellari et al. 2012; Spiniello et al. 2011, 2012; van Dokkum & Conroy 2012; Conroy & van Dokkum 2012b; Sonnenfeld et al. 2012; Ferreras et al. 2013; Tortora et al. 2013).
Understanding the trend in the IMF slope is necessary to determine how the dark matter content of galaxies changes with mass, and thus to provide important insight into galaxy evolution mechanisms. Several works (e.g. Padmanabhan et al., 2004; Tortora et al., 2009; Graves & Faber, 2010; Barnabè et al., 2011) have shown that, under the assumption of a universal IMF, the inferred dark matter fraction within the inner regions of early-type galaxies (ETGs) increases with the total mass. However, it remains unclear whether (and how much) this effect can be countered by the observed variation in the IMF slope, and consequently to what extent (if at all) the actual dark matter content of ETGs scales with total mass.
The combination of gravitational lensing with stellar (or gas) dynamics has been proven to be a very robust and powerful method to investigate the mass structure of both early- and late-type galaxies beyond the local Universe (e.g. Treu & Koopmans, 2004; Jiang & Kochanek, 2007; Czoske et al., 2008; Koopmans et al., 2009; Barnabè et al., 2010; Suyu et al., 2012). When lensing and kinematic data of sufficient quality are available, this technique can also make it possible to put firm constraints on the stellar mass of the analyzed galaxy (see van de Ven et al. 2010; Dutton et al. 2011; B12), which can then be compared to the results of SSP modelling to draw inferences for the shape of the IMF of the galaxy. In this Letter we follow an analogous approach: by taking advantage of high-quality X-Shooter spectroscopic observations, we perform a fully self-consistent joint L&D analysis of two massive lens ETGs: SDSS J09360913 ( at ) and SDSS J09120029 ( at ), hereafter J0936 and J0912, respectively. The inferences for the stellar masses are then compared against the corresponding results from a completely independent method, viz., a spectroscopic SSP study of the same two systems based on line-strength indices analysis, thus yielding secure constraints on the IMF slope and, for the first time, on the IMF low-mass cut-off. The value of is an essential but often unappreciated parameter when determining the stellar mass-to-light ratio from stellar population evolutionary codes. In fact, different codes adopt a different choice for , implying different results for (e.g., Conroy & van Dokkum 2012a, hereafter CvD12, use , Bruzual & Charlot 2003 and Vazdekis et al. 2012 adopt , while all models based on the Padova 2000 isochrones use ).
2 Data set
Both galaxies were originally observed with HST as part of the Sloan Lens ACS Survey (SLACS). We refer to Bolton et al. (2008) and Auger et al. (2009) for a detailed presentation of all the SLACS spectrophotometric data sets. For the analysis presented here, we make use of the high-resolution F814W images of the lens systems. An elliptical B-spline model of the surface brightness distribution of the deflector is used to produce the galaxy-subtracted image that is used for the lensing modelling (see Bolton et al., 2008).
For both systems, UVB–VIS X-Shooter spectra with signal-to-noise high enough to perform SSP analysis () were obtained as part of the X-Shooter Lens Survey (XLENS, Spiniello et al. 2011). X-Shooter observations of J0912 and J0936 were carried out during two runs between 2011 and 2013 in slit mode (UVB: with slit; VIS: , with slit). The total exposure time on target was sec for J0912 and sec for J0936, with a typical seeing for both observations of . The data were reduced using the ESO X-Shooter pipeline v1.5.7. Stellar kinematic parameters were measured with the Penalized Pixel Fitting code of Cappellari & Emsellem (2004).
3 Simple stellar population modelling
For our analysis we use the SSP models of CvD12. To constrain the IMF slope, age and [/Fe] of the stellar populations, we follow the approach described by Spiniello et al. (2013). We use the nearly IMF-independent indicators H, Mg, Fe5270, and Fe5335 to constrain age and [/Fe], while the combination of CaH1 and four TiO features are used to measure the low-mass end of the IMF. We compare the indices of each galaxy with grids of SSPs spanning a range of and [/Fe] dex for different values of the IMF slope (), which is assumed to be a single power-law. In CvD12 the abundance variations of single elements are implemented at fixed [Fe/H], which implies that the total metallicity varies from model to model. For each model we calculate the and obtain a probability distribution function (PDF) via the likelihood function and assuming uniform priors over the above described ranges. We then marginalize over age and [/Fe] to obtain the best-fitting slope of the IMF and its uncertainty for each system: and .
| system | [/Fe] | IMF slope | with | with | |
|---|---|---|---|---|---|
| J0936 | |||||
| J0912 |
To determine , we use the isochrones at solar [Fe/H] from the state-of-the-art stellar evolution code DSEP (Dartmouth Stellar Evolution Program, Chaboyer et al. 2001), selecting IMF slope, age, and [/Fe] inferred from the line-strength analysis (see Table 1). Each includes the contribution from stellar remnants and gas ejected from stars at the end of their life-cycles. The lowest mass limit in the DSEP isochrones is . We extrapolate the luminosities for lower mass down to the hydrogen burning limit of (e.g. Kumar, 1963; Grossman, 1970), using a spline. We note that stars below remain mostly invisible in current spectral lines for any reasonable IMF slope (CvD12) and therefore we can move without any real impact on the spectra and on the line-strength measurements. Finally, we use the luminosities derived in Auger et al. (2009) to translate these numbers into stellar masses. The results are presented in Table 1.
4 Gravitational lensing and stellar kinematics modelling
We carry out an in-depth analysis of the mass and dynamical structure of the two lens systems by employing the fully Bayesian cauldron code (detailed by Barnabè & Koopmans 2007 and B12), which is designed to conduct a self-consistent combined modelling of both the lensing and kinematic constraints.
We adopt a flexible two-component axially-symmetric mass model for the lens galaxy. For the dark matter component, motivated by the findings of cosmological simulations, we use a generalized Navarro-Frenk-White (gNFW) halo characterized by four free parameters, namely the inner density slope , the axial ratio , the halo concentration parameter and the virial velocity (i.e. the circular velocity at the virial radius). The density profile of the luminous mass component is obtained by deprojecting the multi-Gaussian expansion (MGE) fit to the observed surface brightness distribution of the galaxy, a technique that has become the de facto standard in state-of-the-art dynamical studies of galaxies (e.g., the ATLAS3D project, Cappellari et al., 2011). The free parameter , or equivalently the total stellar mass , sets the normalization of the luminous distribution.
This mass profile is then used to simultaneously model both the lensing data set, by employing a pixelated source reconstruction method, and the stellar kinematic observables, i.e. the quantity , where and denote the line-of-sight projected stellar rotation velocity and velocity dispersion, respectively. The construction of the dynamical model is based on the flexible Jeans anisotropic MGE technique (JAM, see Cappellari, 2008), which allows for orbital anisotropy, specified by the meridional plane anisotropy parameter .
The adopted prior distributions for the six free parameters are presented in Table 2, together with the one-dimensional marginalized posterior PDFs derived from the combined L&D analysis. As discussed by B12, we choose very broad uninformative priors encompassing the entire range of realistic parameter values and allowing for a wide variety of galaxy models. In particular, the prior on is based on the velocity dispersion-halo virial mass relationship as determined by, e.g., Bundy, Treu, & Ellis (2007) for massive ellipticals, allowing for a broad standard deviation.
| parameter | prior | posterior | prior | posterior |
|---|---|---|---|---|
| J0936 | J0936 | J0912 | J0912 | |
| (350, 150) | (475, 200) | |||
| U(0, 2) | U(0, 2) | |||
| U(0, 50) | U(0, 50) | |||
| L(1, 0.3) | L(1, 0.3) | |||
| U(0, 10) | U(0, 35) | |||
| U(0, 5) | U(0, 5) |
In the prior columns, denotes a uniform distribution over the open interval . and denote a normal and lognormal distribution, respectively, with being the central value for the variable and the standard deviation (for the log of the variable, in the case of ). In the posterior columns we list, for each parameter, the median value of the corresponding marginalized posterior PDF and the uncertainty quantified by taking the 68% credible interval (i.e., the 16th and 84th percentiles). See Sect. 4 for a description of the six free model parameters.
5 Results and discussion
In this Letter we focus on the inferences for the total stellar mass of the two analyzed systems. The posterior PDFs for the quantity are shown in Fig. 1 as histograms. The values are tightly constrained: we find for J0936 and for J0912. The corresponding dark matter fractions within one effective radius are and , respectively. These values are in agreement within the uncertainties with the findings from the most accurate dynamical studies of local ellipticals, which measure median (see Williams et al., 2009; Thomas et al., 2011; Cappellari et al., 2013). We note that J0936 is at the lower limit of these values and is marginally consistent with having no dark matter contribution within its inner regions.
From the SSP analysis described in Sect. 3 we obtain a direct measurement of the IMF slope for the two systems, inferring and . From these values we derive the total of the two objects and we compare them with the corresponding independently determined from the lensing and dynamics study, as illustrated in Figure 1. As clearly seen, the stellar masses inferred from the two methods are consistent within the one-sigma uncertainties for both galaxies.
The first result is that both galaxies are consistent with a Salpeter-like IMF: for J0912, is within the 1-sigma uncertainties derived from the SSP analysis, and is actually preferred over the maximum a posteriori (MAP) slope with an probability (Bayes factor ). For J0936, a Salpeter IMF is slightly disfavoured with respect to the MAP slope , albeit only marginally (). In general, even though we see a weak steepening of the best-fit IMF when going from the slightly sub-Salpeter J0936 () to J0912 (best-fit slope ), there is no compelling indication of an IMF slope trend with galaxy mass from this data set.
A Chabrier IMF, on the other hand, is ruled out for both systems with a high degree of confidence. A Salpeter-like IMF is preferred over a Chabrier-like one at probability () for J0936, and at probability () for J0912, corresponding in the second case to very strong evidence.111Very similar values of the Bayes factors are obtained if we compare the Chabrier IMF with the MAP slopes rather than with Salpeter. This confirms the findings of several studies of ETGs, using a variety of methods (e.g. Grillo et al., 2009; Spiniello et al., 2011; Cappellari et al., 2012).
We note that the SSP results are obtained under the assumption of a single power-law IMF. A broken power-law (as proposed by Kroupa 2001) or a log-normal IMF (as in Chabrier 2003), both described by two different slopes for different mass ranges (“tapered IMFs”), will be considered in future works. In particular, we plan to apply the method presented here for the analysis of the entire XLENS sample (Spiniello et al., in prep.) testing different assumptions for the IMF with the value of as well as the peak mass characterizing a tapered IMF as free parameters.
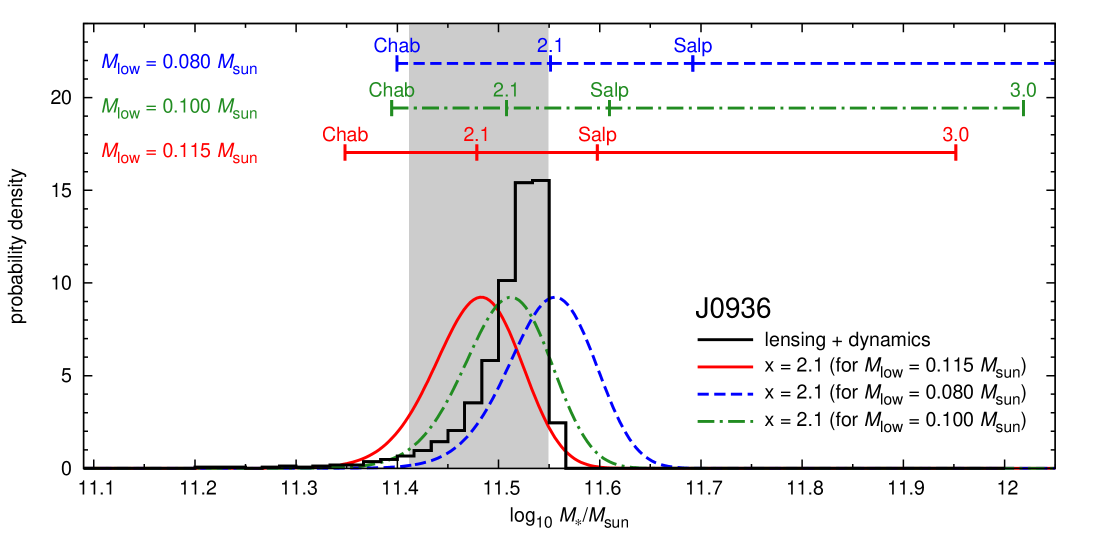
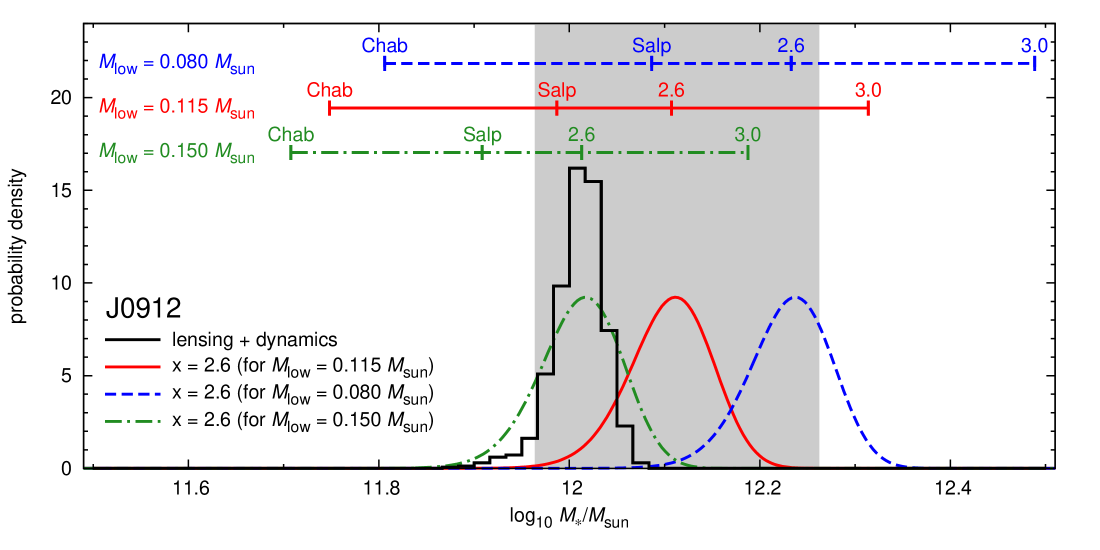
Some works based on absorption-line strengths (e.g., Ferreras et al. 2013) have suggested that the most massive ETGs () might have increasingly bottom-heavy IMFs, with slopes significantly steeper than Salpeter, i.e. . Even though one might have concluded from the inferences drawn from the spectroscopic SSP analysis alone that the massive galaxy J0912 is consistent with an super-Salpeter IMF, that scenario is clearly ruled out when also the results of the combined L&D analysis are brought into the picture. In fact, for J0912 (and even more so for J0936) a Salpeter IMF is favoured over a steep IMF by a Bayes factor , corresponding to decisive evidence.222It has been argued that is high enough to be used as conclusive forensic evidence in criminal trials, cf. Kass & Raftery (1995) and references therein. More intuitively, adopting a super-Salpeter IMF results in a stellar mass exceeding the galaxy total mass predicted by the combined model, and therefore this scenario must be ruled out as unphysical.
Finally, the approach presented in this Letter allows for the first time a resolution of the long-standing problem of constraining the low-mass cut-off for the IMF. In previous studies, has been treated as a fully unconstrained parameter, despite being critical to determine . Stars with masses below have very little effect on the spectral lines in the optical and near-infrared for any assumed IMF slope (CvD12) but they give a non-negligible contribution to the total mass budget of the system (Worthey, 1994). Therefore, it is impossible to determine from spectroscopic studies alone, since varying this parameter does not have any real impact on the spectra and on the line-index measurements. Luckily, this degeneracy can be broken when adding the information from the combined L&D analysis. The analysis conducted so far in this Letter has assumed the cut-off mass value assumed by DSEP. However, when adopting a lower value , corresponding to the hydrogen burning limit (as suggested by, e.g., CvD12), the inferred total stellar mass increases significantly for the steeper IMF slopes, i.e. around for (Salpeter) and for . For J0936 the constraints on are not good enough to discriminate between the two possibilities; on the other hand, in the case of J0912 (considering the MAP slope ), there is decisive evidence in favour of with , corresponding to probability.
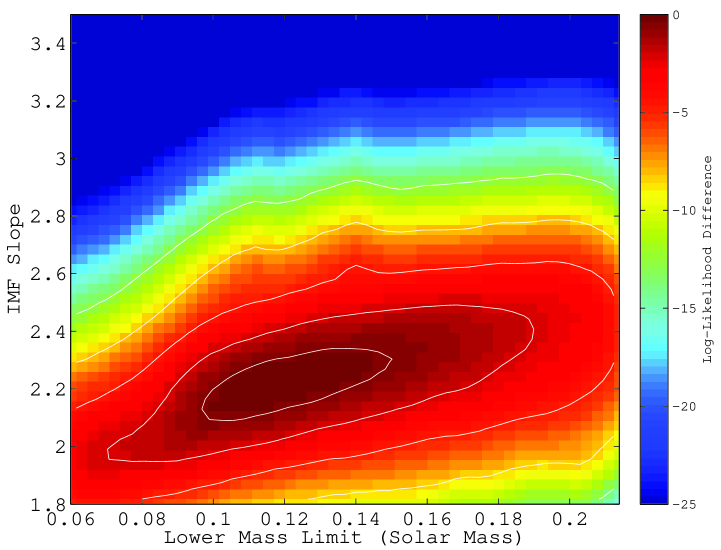
We combine the results of the L&D and SSP analyses of both galaxies to derive the joint inferences on the IMF slope and cut-off. To this purpose, we use the DSEP isochrones extrapolated down to to compute the V-band for different values of the IMF slope and for both ETGs; these are used to convert the observed luminosities into stellar masses. The probability density for this stellar mass is then determined from the posterior PDF of the L&D analysis (see Fig. 1), which acts as prior at this level of inference. In addition, we assume a Gaussian PDF for the IMF slope, as determined from the SSP modelling in this paper, and similarly a Gaussian PDF for the ETG luminosity, determined by Auger et al (2009), which both act as priors. We adopt a flat prior U(0.06, 0.25) on . We then run a Markov Chain Monte Carlo with samples drawn by varying , and ETG luminosity, to sample the joint lensing, dynamics and SSP posterior. Finally we combine the posteriors derived from the two galaxies, and marginalize over luminosity to obtain the joint 2-D posterior PDF, which is shown in Fig.2. The resulting marginalized MAP values are for the IMF slope, and a low-mass cut-off .
6 Conclusions
In this work, for the first time, we compare the results of a state-of-the-art combined lensing and dynamics analysis of two early-type galaxies with the corresponding inferences from a spectroscopic SSP study of line-strength indices. This is made possible by the exquisite quality of the data sets available for the two systems, J0936 and J0912, including HST high-resolution imaging and high signal-to-noise X-Shooter spectra.
We model simultaneously the lensing and kinematic data sets by adopting a flexible, axisymmetric, two-component mass distribution for the dark halo and the luminous profile (both self-gravitating), and solving the Jeans anisotropic equations. We derive tight constraints on the total stellar mass and dark matter fractions (within one ) of the two galaxies, i.e. (and ) for J0936 and (and ) for J0912, independent of the IMF. These dark matter contents are in agreement, within the uncertainties, with the findings of dynamical studies of local ellipticals (e.g. Cappellari et al., 2013). By comparing the posterior PDFs for derived from this combined analysis with the completely independent results from the spectroscopic SSP study of the two systems, under the assumption of a single power-law IMF, we draw the following conclusions on the properties of their IMFs:
-
1.
The modelling of the line-strength indices (adopting solar metallicity and a cut-off mass ) provides a direct determination of the IMF slopes for the two lenses, namely and . The total stellar masses inferred from this method are completely consistent within the one-sigma uncertainties with the results obtained from the combined lensing and dynamics analysis, which is a fully independent approach that makes no assumptions on the IMF.
-
2.
For both galaxies, an IMF with slope close to Salpeter () provides a much better description than a Chabrier profile: statistical analysis based on the calculation of evidence ratios (i.e., Bayes factor) shows that a Salpeter IMF model is preferred over a Chabrier one with and probability for J0936 and J0912, respectively.
-
3.
Bottom-heavy IMFs significantly steeper than Salpeter, i.e. with slopes , are ruled out with decisive evidence (Bayes factor ) for both galaxies. The values for implied by these super-Salpeter IMFs unphysically exceed the total galaxy mass derived from the combined lensing and dynamics analysis. This result contradicts the findings from absorption line spectroscopy studies (see e.g. Ferreras et al. 2013) which support IMF slopes for massive ETGs such as those considered here ( and ).
-
4.
For the system J0912, a low-mass IMF cut-off of (corresponding to the hydrogen burning limit) is ruled out with a probability of in favor of the value assumed by DSEP. For J0936, instead, it is not possible to reliably discriminate between the two values.
-
5.
By combining the L&D and SSP inferences of the two lenses, we obtain the marginalized MAP values for the IMF slope and , consistent with a Salpeter-like IMF and a low-mass cut-off slightly higher than the hydrogen burning limit.
Acknowledgments
The Dark Cosmology Centre is funded by the DNRF. CS acknowledges support from an Ubbo Emmius Fellowship. TT acknowledges support from a Packard Research Fellowship.
References
- Auger et al. (2009) Auger, M. W., Treu, T., Bolton, A. S., Gavazzi, R., Koopmans, L. V. E., Marshall, P. J., Bundy, K., & Moustakas, L. A. 2009, ApJ, 705, 1099
- Auger et al. (2010) Auger, M. W., Treu, T., Gavazzi, R., Bolton, A. S., Koopmans, L. V. E., & Marshall, P. J. 2010, ApJ, 721, L163
- Barnabè et al. (2010) Barnabè, M., Auger, M. W., Treu, T., Koopmans, L. V. E., Bolton, A. S., Czoske, O., & Gavazzi, R. 2010, MNRAS, 406, 2339
- Barnabè et al. (2011) Barnabè, M., Czoske, O., Koopmans, L. V. E., Treu, T., & Bolton, A. S. 2011, MNRAS, 415, 2215
- Barnabè et al. (2009) Barnabè, M., Czoske, O., Koopmans, L. V. E., Treu, T., Bolton, A. S., & Gavazzi, R. 2009, MNRAS, 399, 21
- Barnabè & Koopmans (2007) Barnabè, M., & Koopmans, L. V. E. 2007, ApJ, 666, 726
- Barnabè et al. (2012) Barnabè, M., et al. 2012, MNRAS, 423, 1073
- Bastian et al. (2010) Bastian, N., Covey, K. R., & Meyer, M. R. 2010, ARAA, 48, 339
- Bolton et al. (2008) Bolton, A. S., Burles, S., Koopmans, L. V. E., Treu, T., Gavazzi, R., Moustakas, L. A., Wayth, R., & Schlegel, D. J. 2008, ApJ, 682, 964
- Bruzual & Charlot (2003) Bruzual, G., & Charlot, S. 2003, MNRAS, 344, 1000
- Bundy et al. (2007) Bundy, K., Treu, T., & Ellis, R. S. 2007, ApJ, 665, L5
- Cappellari (2008) Cappellari, M. 2008, MNRAS, 390, 71
- Cappellari & Emsellem (2004) Cappellari, M., & Emsellem, E. 2004, PASP, 116, 138
- Cappellari et al. (2011) Cappellari, M., et al. 2011, MNRAS, 413, 813
- Cappellari et al. (2012) —. 2012, Nature, 484, 485
- Cappellari et al. (2013) —. 2013, MNRAS, in press
- Chaboyer et al. (2001) Chaboyer, B., Fenton, W. H., Nelan, J. E., Patnaude, D. J., & Simon, F. E. 2001, ApJ, 562, 521
- Chabrier (2003) Chabrier, G. 2003, PASP, 115, 763
- Conroy & van Dokkum (2012a) Conroy, C., & van Dokkum, P. G. 2012a, ApJ, 747, 69
- Conroy & van Dokkum (2012b) —. 2012b, ApJ, 760, 71
- Czoske et al. (2008) Czoske, O., Barnabè, M., Koopmans, L. V. E., Treu, T., & Bolton, A. S. 2008, MNRAS, 384, 987
- Dutton et al. (2011) Dutton, A. A., et al. 2011, MNRAS, 417, 1621
- Dutton et al. (2013) —. 2013, MNRAS, 428, 3183
- Ferreras et al. (2013) Ferreras, I., La Barbera, F., de la Rosa, I. G., Vazdekis, A., de Carvalho, R. R., Falcón-Barroso, J., & Ricciardelli, E. 2013, MNRAS, 429, L15
- Geha et al. (2013) Geha, M., et al. 2013, arXiv:astro-ph/1304.7769
- Graves & Faber (2010) Graves, G. J., & Faber, S. M. 2010, ApJ, 717, 803
- Graves et al. (2009) Graves, G. J., Faber, S. M., & Schiavon, R. P. 2009, ApJ, 698, 1590
- Grillo et al. (2009) Grillo, C., Gobat, R., Lombardi, M., & Rosati, P. 2009, A&A, 501, 461
- Grossman (1970) Grossman, A. S. 1970, ApJ, 161, 619
- Jiang & Kochanek (2007) Jiang, G., & Kochanek, C. S. 2007, ApJ, 671, 1568
- Kass & Raftery (1995) Kass, R. E., & Raftery, A. E. 1995, J. Amer. Statistical Assoc., 90, 773
- Koopmans et al. (2009) Koopmans, L. V. E., et al. 2009, ApJ, 703, L51
- Kroupa (2001) Kroupa, P. 2001, MNRAS, 322, 231
- Kroupa et al. (2013) Kroupa, P., Weidner, C., Pflamm-Altenburg, J., Thies, I., Dabringhausen, J., Marks, M., & Maschberger, T. 2013, The Stellar and Sub-Stellar Initial Mass Function of Simple and Composite Populations, ed. T. D. Oswalt & G. Gilmore, 115
- Kumar (1963) Kumar, S. S. 1963, ApJ, 137, 1121
- Padmanabhan et al. (2004) Padmanabhan, N., et al. 2004, New Astronomy, 9, 329
- Salpeter (1955) Salpeter, E. E. 1955, ApJ, 121, 161
- Sonnenfeld et al. (2012) Sonnenfeld, A., Treu, T., Gavazzi, R., Marshall, P. J., Auger, M. W., Suyu, S. H., Koopmans, L. V. E., & Bolton, A. S. 2012, ApJ, 752, 163
- Spiniello et al. (2011) Spiniello, C., Koopmans, L. V. E., Trager, S. C., Czoske, O., & Treu, T. 2011, MNRAS, 417, 3000
- Spiniello et al. (2013) Spiniello, C., Trager, S., Koopmans, L. V. E., & Conroy, C. 2013, arXiv:astro-ph/1305.2873
- Spiniello et al. (2012) Spiniello, C., Trager, S. C., Koopmans, L. V. E., & Chen, Y. P. 2012, ApJ, 753, L32
- Suyu et al. (2012) Suyu, S. H., et al. 2012, ApJ, 750, 10
- Thomas et al. (2011) Thomas, J., et al. 2011, MNRAS, 415, 545
- Tortora et al. (2009) Tortora, C., Napolitano, N. R., Romanowsky, A. J., Capaccioli, M., & Covone, G. 2009, MNRAS, 396, 1132
- Tortora et al. (2013) Tortora, C., Romanowsky, A. J., & Napolitano, N. R. 2013, ApJ, 765, 8
- Trager et al. (2000) Trager, S. C., Faber, S. M., Worthey, G., & González, J. J. 2000, AJ, 120, 165
- Treu et al. (2010) Treu, T., Auger, M. W., Koopmans, L. V. E., Gavazzi, R., Marshall, P. J., & Bolton, A. S. 2010, ApJ, 709, 1195
- Treu & Koopmans (2004) Treu, T., & Koopmans, L. V. E. 2004, ApJ, 611, 739
- van de Ven et al. (2010) van de Ven, G., Falcón-Barroso, J., McDermid, R. M., Cappellari, M., Miller, B. W., & de Zeeuw, P. T. 2010, ApJ, 719, 1481
- van Dokkum & Conroy (2010) van Dokkum, P. G., & Conroy, C. 2010, Nature, 468, 940
- van Dokkum & Conroy (2012) —. 2012, ApJ, 760, 70
- Vazdekis et al. (2012) Vazdekis, A., Ricciardelli, E., Cenarro, A. J., Rivero-González, J. G., Díaz-García, L. A., & Falcón-Barroso, J. 2012, MNRAS, 424, 157
- Williams et al. (2009) Williams, M. J., Bureau, M., & Cappellari, M. 2009, MNRAS, 400, 1665
- Worthey (1994) Worthey, G. 1994, ApJS, 95, 107