Time-monitoring Observations of the Ro-Vibrational Overtone CO bands in Young Stars
Abstract
We present near-IR spectra of a sample of T Tauri, Herbig Ae/Be, and FU Ori objects. Using the FSPEC instrument on the Bok 90-inch telescope, we obtained -band spectra with a resolution of . Here we present spectra of the –0 and –1 bandheads of ro-vibrational transitions of carbon monoxide. We observed these spectra over multiple epochs spaced by a few days and approximately one month. Several of our targets show CO emission or absorption features. However we see little evidence of variability in these features across multiple epochs. We compare our results with previous observations, and discuss the physical implications of non-variable CO emission across the sampled timescales.
1 INTRODUCTION
Young stellar objects have long been known as variable from UV to IR wavelengths (e.g., Joy 1942; Herbst et al. 1994; Skrutskie et al. 1996). Several different mechanisms have been proposed to explain various types of monochromatic and color variability: 1) variable stellar flux, for example due to magnetic cool spots or accretion hot spots; 2) variable extinction, perhaps caused by gas and dust orbiting in a circumstellar disk; and 3) variations intrinsic to the inner circumstellar disk, such as changing inner radii or temperatures.
Multi-wavelength photometric variability in a few objects has been used to constrain these scenarios (e.g., Carpenter et al. 2001; Eiroa et al. 2002; Forbrich et al. 2007; Flaherty et al. 2012). Optical spectroscopic monitoring has also provided constraints on variable stellar or accretion properties (e.g., Eisner et al. 2010; Mendigutía et al. 2011). Spectroscopic monitoring in the near-IR—the peak spectral region for thermal emission in the inner disk—can probe disk variability in particular.
The ro-vibrational overtone transitions of CO can be used to probe changes in the structure of hot, optically thin disk regions. Overtone transitions of CO have been detected in emission toward a number of young stars (Carr 1989; Najita et al. 1996, 2000, 2007, 2009; Biscaya et al. 1997; Thi et al. 2005; Brittain et al. 2007; Berthoud et al. 2007; Berthoud 2008). Because these transitions require high excitation temperatures, we expect this emission to trace disk regions close to the star (within AU). Analyses of spectrally resolved line profiles confirm that CO overtone emission generally arises in the inner regions of Keplerian disks (e.g., Najita et al. 1996, 2009; Thi et al. 2005).
CO overtone emission originates from stellocentric radii in between star/accretion flow interfaces and dust sublimation radii. While accretion rates and dust continuum emission are both known to vary for young stars (e.g., Carpenter et al. 2001; Eisner et al. 2010), less is known about the variability of inner disk gas. CO emission can therefore provide a valuable diagnostic of inner disk variability. Variability in the emission has been observed in some objects, with emission features disappearing entirely in some cases (e.g., Biscaya et al. 1997; Najita et al. 2000).
CO absorption is also observed toward some young stars. The CO overtone bandheads are seen in absorption from the photospheres of late-type stars. Since these absorption features occur in stellar photospheres, one might expect limited variability. However if this absorption is superposed on emission from circumstellar disk gas, then variability might be observed.
Absorption features may also arise purely from circumstellar disk gas in special cases. Emission from hot circumstellar matter may be absorbed by cooler CO along the line-of-sight. For example, a circumstellar disk midplane heated to a temperature of several thousand K (e.g., by viscous dissipation in accreting matter) can produce emission that is then absorbed by a cooler disk atmosphere. Such models can produce CO absorption spectra much like those produced by cool stellar photospheres (Calvet et al. 1991).
This scenario is thought to apply to the FU Orionis sources, a class of young stars surrounded by actively accreting, very hot disks (e.g., Hartmann & Kenyon 1985). Indeed, the narrow line widths and spatial distributions of CO emission in FU Ori stars (including the two in the sample presented here) confirm that the CO absorption features arise in extended circumstellar disks and not in stellar photospheres (Hartmann et al. 2004; Greene et al. 2008; Zhu et al. 2009; Eisner & Hillenbrand 2011). The CO absorption features around these objects—and their potential variability—can therefore probe inner disk conditions.
Here we present time-monitoring observations of the CO overtone emission in a number of young stars. Our sample includes FU Ori sources (V1515 Cyg and V1057 Cyg), T Tauri stars (AS 205 N, V 1002 Sco, V2508 Oph, AS 209), and Herbig Ae/Be objects (MWC 863, 51 Oph, MWC 275, V1685 Cyg, AS 442, and V1331 Cyg). In the next section we describe the observing and data reduction procedure. Results and discussion of the multi-epoch observations are described in Sections 3 and 4.
2 OBSERVATIONS AND DATA REDUCTION
We used the near-IR spectrograph FSPEC at the Bok 90-inch telescope to monitor the CO emission around a sample of young stars (Table 1). We used a grating with 600 grooves per mm, providing a resolving power of (per pixel). FSPEC provides a slit, with pixels. The slit is pixels wide, and the actual spectral resolution is closer to 3500.
In our observations we nodded along the slit, observing each object at 5–6 distinct slit positions. Total integration times (including all slit pointings) for each observation are listed in Table 1. Observations of target objects were interleaved with observations of telluric calibrators. We selected calibrators with spectral types earlier than A0. Because these calibrators do not show CO absorption (or emission) features in their photospheric spectra, no spurious signals are introduced into the target spectra.
We developed an IDL-based data reduction pipeline to produce calibrated spectra. The pipeline works on an entire night of data as a block, producing telluric-corrected, wavelength-calibrated spectra for each object observed during the night. Because we work with the entire night of data at once, we can use a weighted sum of all the data to produce higher signal-to-noise in certain calibrations.
The first step in the data reduction procedure is the production of median flat and dark images, and a bad pixel mask. The bad pixel mask specifies the location of hot, dead, and “flaky” pixels, where flaky pixels are those showing an abnormally high standard deviation between frames. We correct bad pixels in the raw data by replacing values flagged in the bad pixel mask with the median values of surrounding pixels.
After bad-pixel correction we perform sky subtraction for every observed object, including targets and calibrators. For each position of an object within the slit, data from adjacent slit positions are subtracted. Discarding values less than zero yields a sky-subtracted image of only the slit position of interest. We then divide by the flat.
At this point, we calculate a “sky frame”. We compute this frame from a weighted sum of all observations for the entire night. Since we are interested in sky emission, the weighting is higher for observations with longer integration times. Because every observation contains sky emission lines at the same wavelengths, these add coherently. Spectra from observed objects, which are nodded along the slits, do not add coherently. The result is an image of the sky emission lines, relatively “uncontaminated” by spectra of observed targets and calibrators.
We use the sky frame to determine the slope of sky emission lines across the detector. We need this information in order to determine how a spatial shift along the slit affects the wavelength direction. We determine the spatial positions of spectra at different slit positions by fitting Gaussians to spectra projected into the spatial dimension, then shift them along the determined slope to create a single, summed 2D spectrum. To ensure that sources and calibrators share a common wavelength calibration, we always shift the spectra to the same spatial position, typically in the middle of the slit.
From the summed, 2D spectrum, we determine the spectral trace, which is not exactly rectilinear on the detector, by fitting Gaussians to slices through each spatial position. We extract spectra from pixels around the trace positions. After extraction we are left with a 1D spectrum for each observed object.
Telluric calibration is accomplished by dividing the 1D spectrum for a target by the 1D spectrum of its corresponding calibrator. We multiply this result by a Kurucz model atmosphere appropriate for the calibrator’s spectral type to remove overall slopes associated with the calibrator spectrum. When more than one calibrator is observed, or if one is observed multiple times, we determine an average, calibrated spectrum.
Finally, we perform a wavelength calibration. We determine a solution for an entire night of data and then apply it to every observed object. The wavelength solution is computed for the sky frame (discussed above). Using the same trace determined for the extracted target and calibrator spectra, we extract a 1D sky spectrum. We identify telluric emission lines, of known wavelengths, in the sky spectrum, and compute a polynomial wavelength solution. We typically use a third-order polynomial, which provides solutions with slightly lower residuals than a second-order polynomial fit.
One might wonder why we compute a wavelength solution for the entire night rather than for individual objects. If the wavelength solution varies throughout the night, then solutions for individual objects would be preferred. However if the wavelength solution is stable, then low signal-to-noise in observed sky lines for some observations might limit the accuracy of the wavelength calibration.
We determine the stability of the wavelength solution by measuring the wavelengths of telluric lines across multiple sources and epochs. Using the average sky frame for wavelength calibration produces a smaller scatter in the source-to-source and epoch-to-epoch wavelength determinations of telluric lines than we see if we compute wavelength solutions for individual objects. The stability of FSPEC over a night is not surprising given the exceptional stability and negligible flexure of the instrument.
Since our observations were not taken under photometric conditions, we do not attempt to associate real continuum fluxes with our reduced spectra. Rather, we median-subtract each spectrum so that all spectra for a given object have the same continuum level. We thus ignore any potential variability in the continuum flux of our targets. Such variations would not be surprising given the known infrared variability of many young stars (e.g., Skrutskie et al. 1996; Eiroa et al. 2002).
3 RESULTS
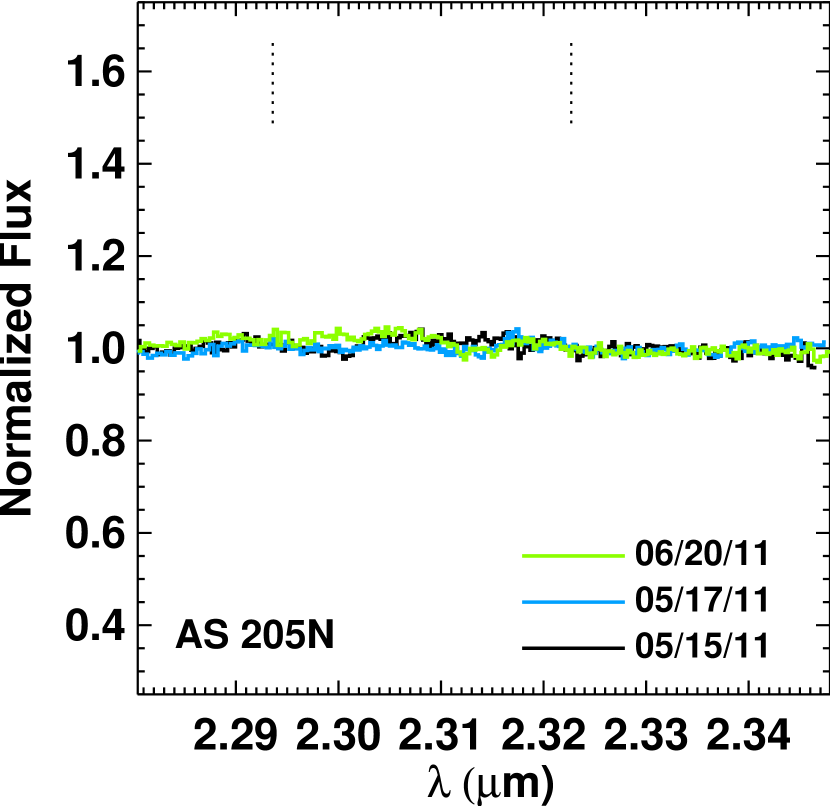
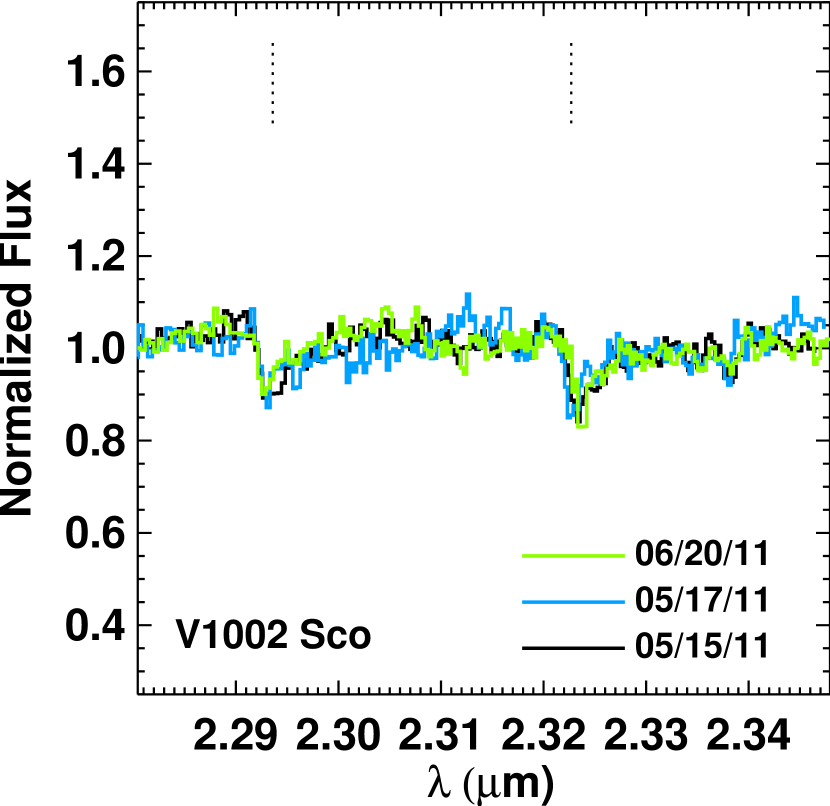
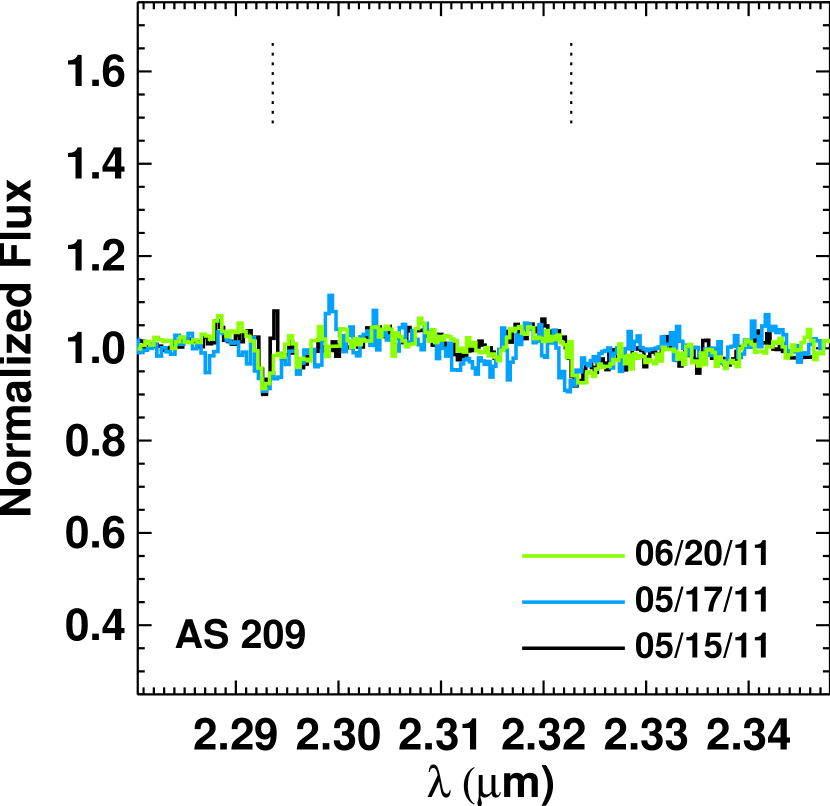
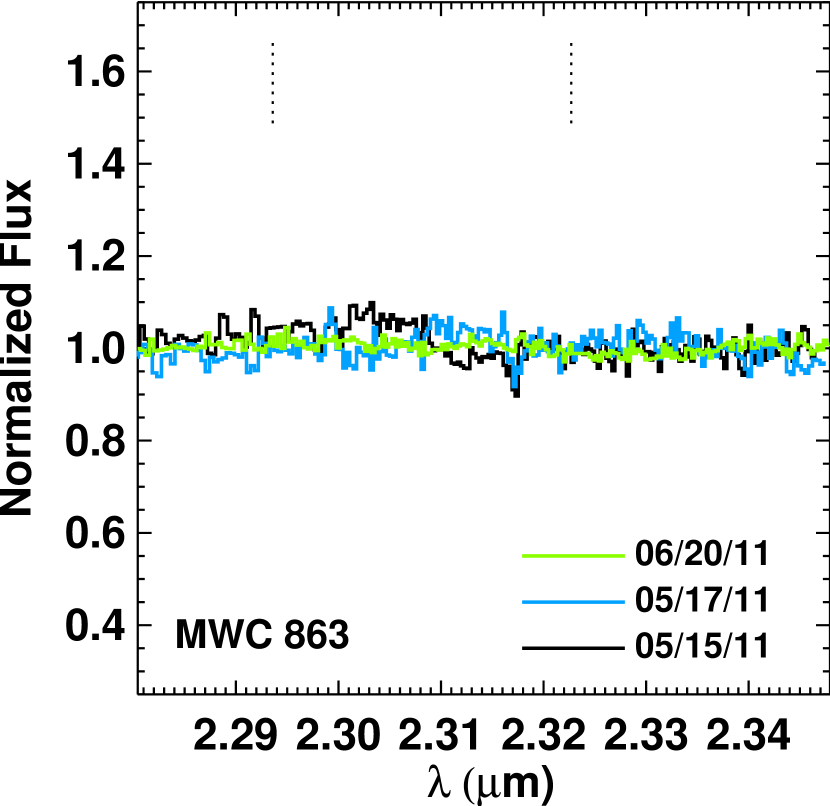
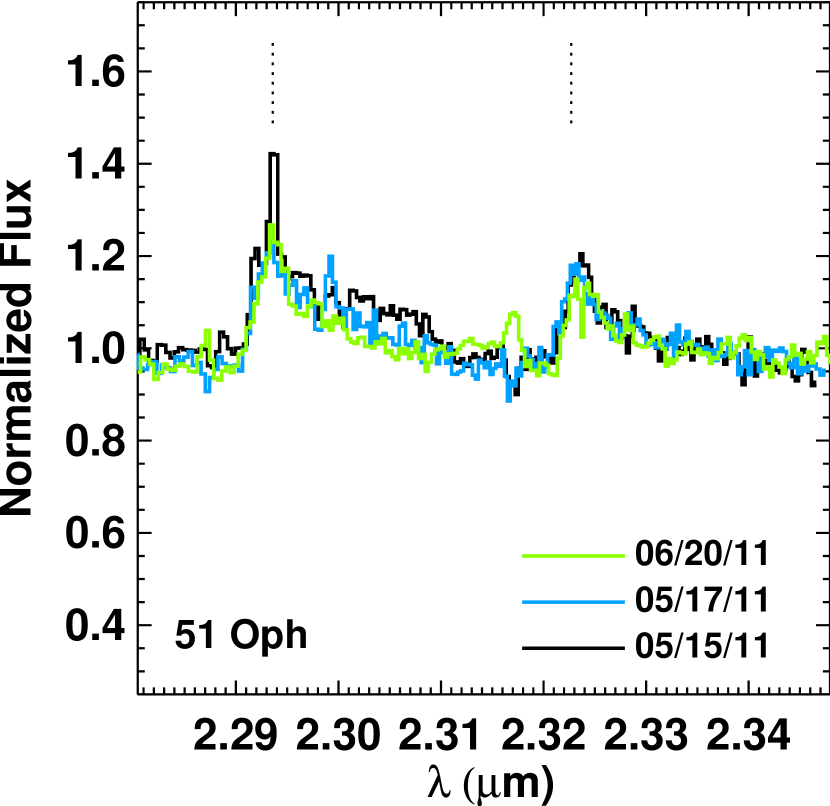
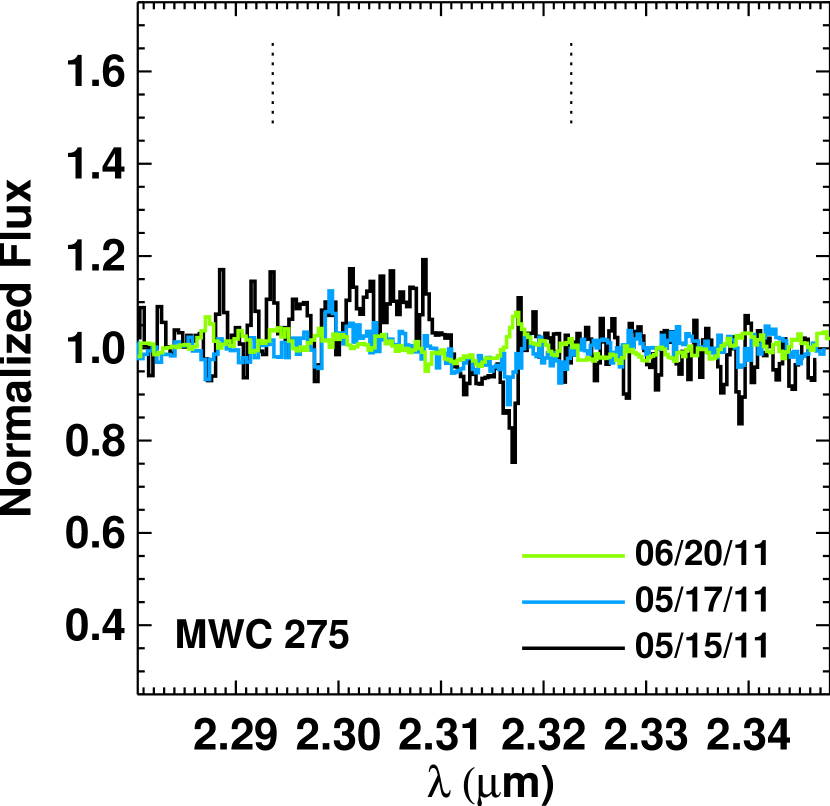
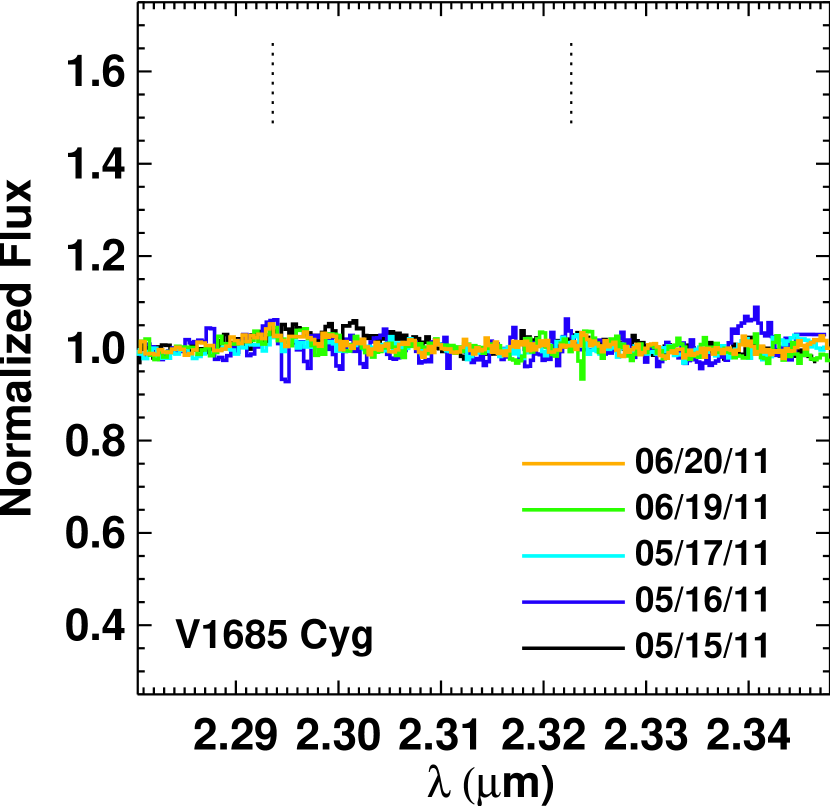
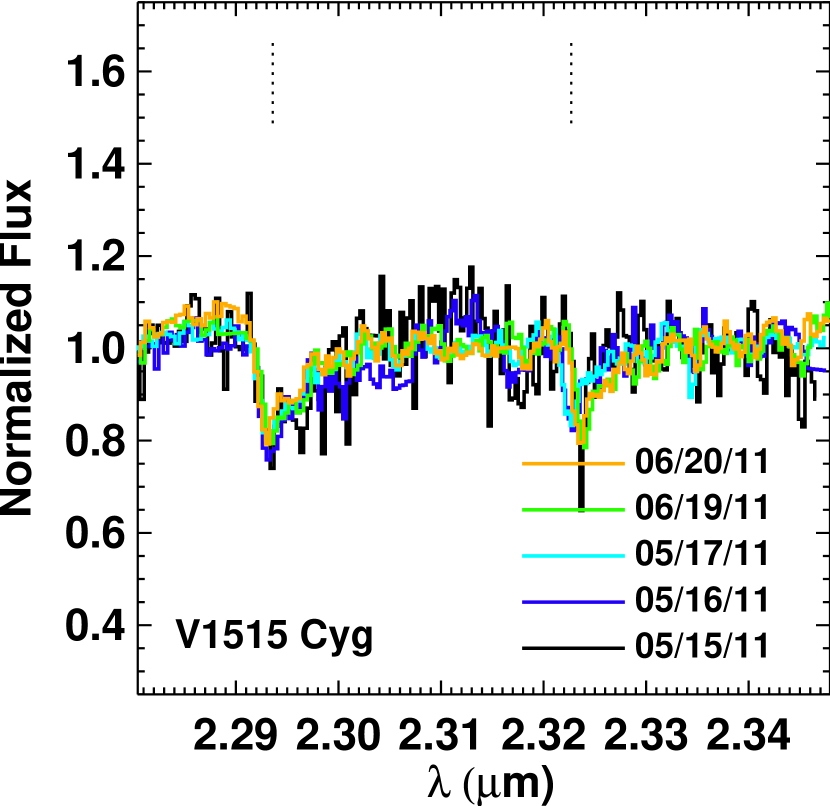
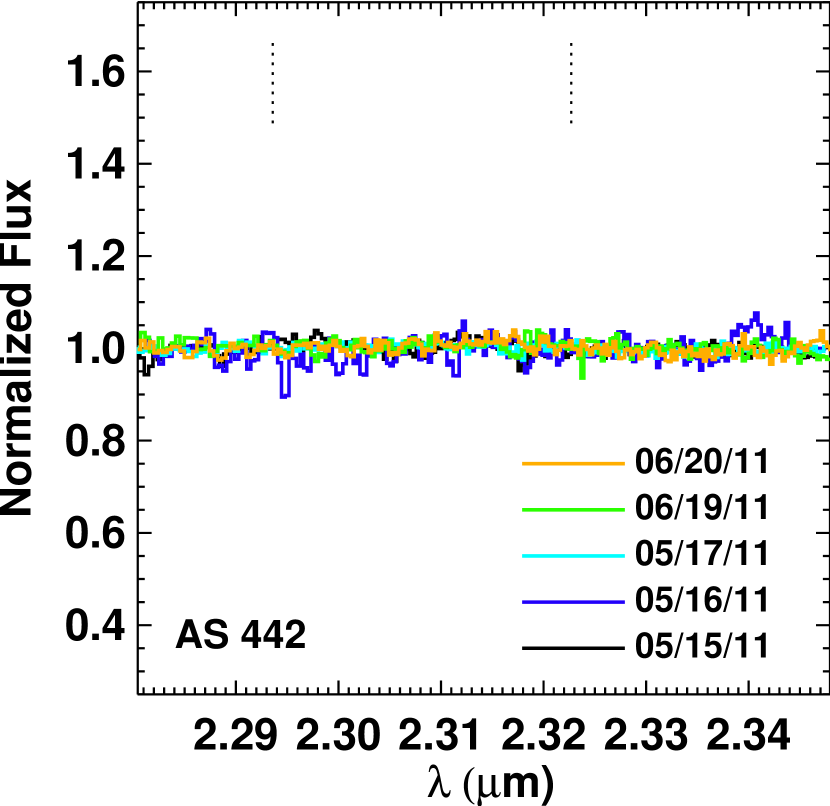
Spectra of our targets are plotted in Figures 1–12. Many of our targets show no evidence of CO emission or absorption in any observed epochs. Some targets show strong emission, and some show strong absorption features. However, as seen in Figures 1–12, strong variability is generally absent. While spectra do show differences from epoch-to-epoch, much or all of this may be attributed to noise in the data.
Beyond random noise, several objects (V2508 Oph, MWC 863, 51 Oph, MWC 275) appear to have variable features around 2.317 m. All of these sources used a common telluric calibrator star. The presence of this feature in all of these objects suggests it to be an artifact of calibration. There is a telluric absorption feature at approximately this wavelength, which may also lead to imperfect calibration.
Because we do not calibrate the continuum flux level of our observations, we can not calculate line fluxes in the CO bandheads. Rather we determine equivalent widths (EWs), which provide a measurement of line flux relative to the continuum level. To first approximation, the continuum emission in the near-IR traces dust, and so EWs provide a measure of CO gas to dust emission. However, some fraction of inner disk continuum emission may trace gas, perhaps free-free emission from H or H- (e.g., Tannirkulam et al. 2008; Eisner et al. 2009).
We measure equivalent widths (EWs) of the and CO bandhead features. After subtracting the continuum level, EWs are measured by simply integrating the flux in spectral regions appropriate to each bandhead. For the bandhead we integrate from 2.290 to 2.317 m. For the bandhead we integrate from 2.320 to 2.346 m.
To estimate errors in measured EWs, we simulate 1000 noise realizations for each spectrum. The noise is Gaussian, with determined from line-free regions of the observed spectrum. In addition, we include the effects of bad pixels at random locations, multiplying two pixel values in each synthetic spectrum by 5. The uncertainty in the data is estimated as the 3 confidence level of the 1000 resulting synthetic spectra. We choose 3 to facilitate inclusion of bad pixel events in our estimated errors. EWs and uncertainties for each target and observed epoch are listed in Table 2.
For essentially all sources in our sample, the EWs do not indicate statistically significant variations across epochs. As listed in Table 2, 51 Oph appears as if it may be an exception, with variations in the bandhead emission. However inspection of Figure 6 suggests that the epoch with a larger inferred EW may have a hot pixel coincident with the peak of the bandhead, and that the EW may thus be contaminated. The fact that the bandhead does not display variability supports this hypothesis.
4 DISCUSSION
Previous studies have shown the CO overtone bandhead emission or absorption to be variable in a number of objects (e.g., Biscaya et al. 1997; Najita et al. 2000, 2003). DG Tau, in particular, is seen to vary significantly, with CO emission strong in some epochs (e.g., Carr 1989; Biscaya et al. 1997) and undetected in others (e.g., Greene & Lada 1996; Biscaya et al. 1997; Eisner et al. 2009). While our sample does not include DG Tau, several of our sample objects have been observed previously, allowing comparison between the results presented above and conclusions from the literature.
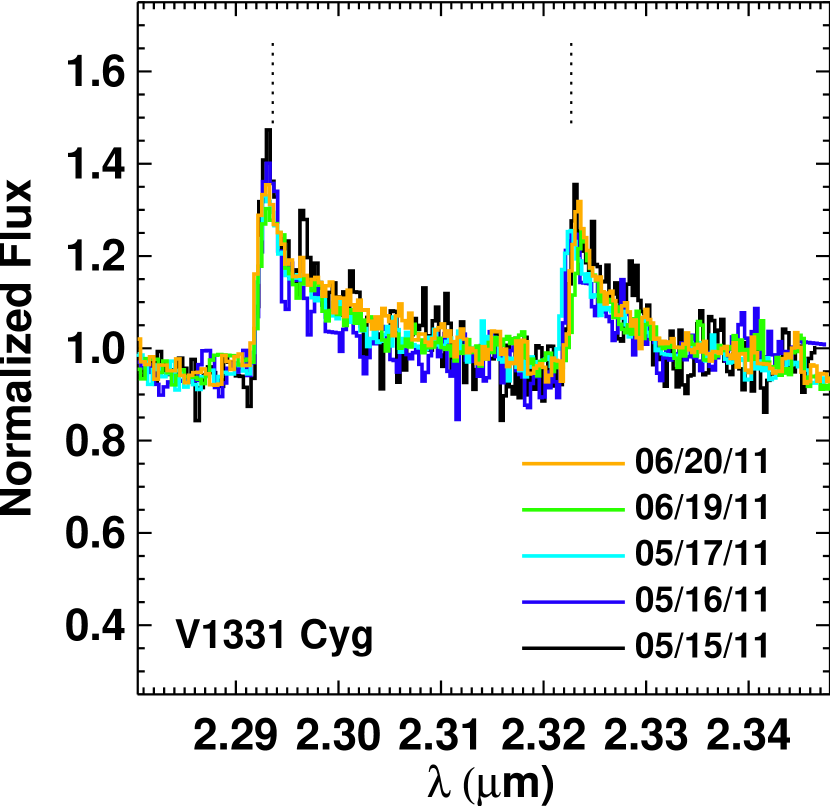
For example, in observations of V1331 Cyg across several nights and months, the EW of the CO bandhead emission varied by nearly a factor of two (Biscaya et al. 1997). The largest variability was observed over a one week interval, while smaller changes were observed over month-to-month timescales. In contrast our spectra of V1331 Cyg, which also sample day-to-day and month-to-month timescales, show no significant variability in either the or bandheads (Table 2).
Our spectra, while approximately constant across the observed epochs, do differ from previous observations. The EWs we measure for the bandhead appear to be those measured by Biscaya et al. (1997). Other previous observations of V1331 Cyg, generally with different spectral resolution than those presented here, also suggest higher EWs than seen in our data (e.g., Najita et al. 2009). Evidently the CO bandheads may vary sometimes, even though we do not see variations during the time-baseline of our observations.
Photometric observations of V1331 Cyg in the near-IR () suggest a similar trend. No significant variability in the flux of V1331 Cyg was observed on timescales of days, months, or years (Eisner et al. 2007). However differences between measurements in the literature, spanning decades, do suggest variations by up to magnitudes (Mendoza 1968; Glass & Penston 1974; Cohen & Kuhi 1979; Sun et al. 1991; Cutri et al. 2003; Ábrahám et al. 2004). These observations imply that V1331 Cyg has spent significant periods of time in at least two distinct photometric states. Thus, this object may have episodic variations on timescales not sampled in monitoring observations (e.g., Eisner et al. 2007).
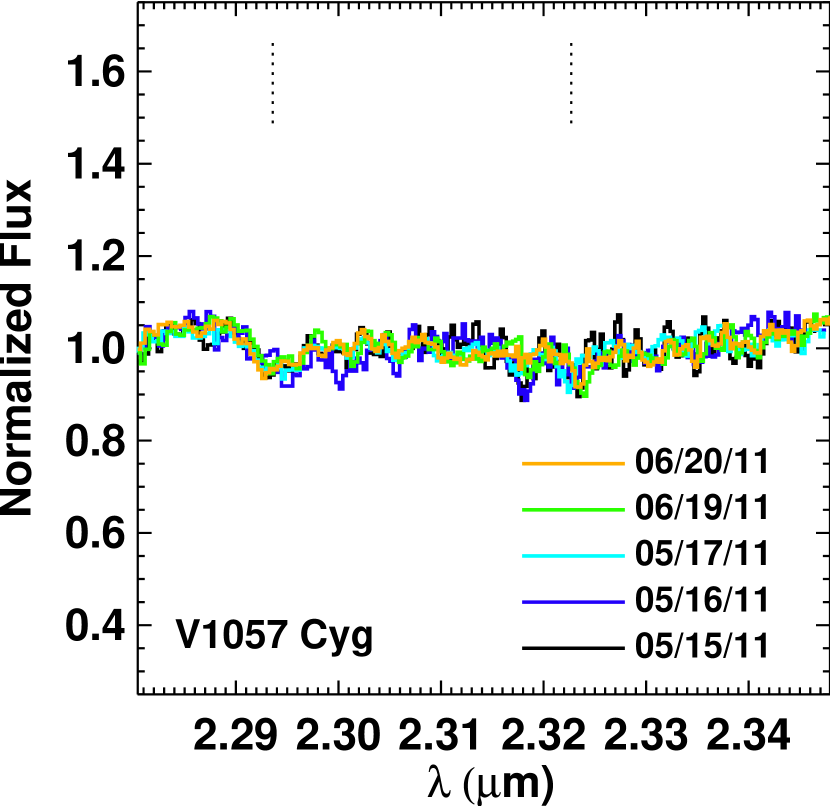
Multi-epoch observations of V1057 Cyg also suggested variability, in this case in CO overtone absorption spectra (Biscaya et al. 1997; Hartmann & Kenyon 1987). However this variability was inferred between spectra taken with different telescopes, and indeed very different spectrographs (one was an FTS spectrum and one a grating spectrum). In our observations of this object no significant variability is seen across days or months. While the EW of the bandhead measured here is lower than that measured by Biscaya et al. (1997), it is in fact consistent with the older measurement of Hartmann & Kenyon (1987).
Biscaya et al. (1997) suggested that they may have seen V1057 Cyg in outburst during their observations; this suggestion seems consistent with our observations and the older data from Hartmann & Kenyon (1987) tracing the quiescent state. As noted above, CO absorption in V1057 Cyg (and other FU Ori stars) likely traces circumstellar disk material rather than a stellar photosphere. The CO bandhead shapes for V1057 Cyg (Figure 11; see also Biscaya et al. 1997) differ from stellar photospheric absorption features, supporting this conclusion. The variability inferred between different observations in the literature likely arises in a circumstellar disk.
While our observations of 51 Oph suggested a higher EW in one of the CO bandheads in one epoch (Table 2), we argued above that this is probably due to an uncorrected bad pixel rather than true variability. Moreover, previous observations (at higher spectral resolution; Thi et al. 2005; Berthoud et al. 2007) show EWs for the bandhead that are consistent with those measured here. Both Thi et al. (2005) and Berthoud et al. (2007) find that the EWs of the and bandheads are comparable, while our results suggest the EWs of the bandhead are smaller. This may indicate long-term variation in the temperature of the CO emission, which would affect the ratio of the two bandheads (see Figure 13 below). However the difference between the EWs of the two bandheads in our data is only marginally significant (Table 2).
None of our sample—including 12 young star+disk systems—exhibit significant variability in their CO overtone emission/absorption during the observed epochs (Table 2). The fact that other objects, including some in our sample, have been seen to vary in previous observations begs the question of why we do not see such variability.
One possibility is that the duty cycle of variability in CO overtone emission or absorption features is low. For this scenario, we may simply have missed variability during the month of observations presented here. However under this scenario, multiple previous observations (some of similar duration to the observations presented here) would have needed to be lucky to have seen variations.
Another potential explanation is that some of the previous inferred variability was actually due to variable calibration, rather than intrinsic variability. Given that some of the previous observations also used the FSPEC instrument (Biscaya et al. 1997), this seems unlikely. Moreover, previous large-amplitude variability observed at the MMT (also with FSPEC; Biscaya et al. 1997) is difficult to explain through instrumental effects. However comparison of different datasets, taken with different instruments, may suffer to some extent from a lack of consistent calibration.
In terms of physical implications, the lack of significant variability in our data indicates a relatively quiescent inner disk environment around our sample objects. The magnitude of variability that is ruled out corresponds to ranges of gas temperatures or surface densities. For optically thin gas, the emission intensity scales directly with density, and thus the uncertainties in our data correspond directly to the amount of allowed variations in gas density. Including some uncertainty on estimation of continuum levels (which may influence the total measured EW), our data suggest that gas densities do not vary by more than during the observed epochs. Temperature variations may affect EWs, and will also change the relative strengths of the two CO overtone bandheads observed here. Lack of significant variations in either EWs of individual features or the ratios of EWs for the two bandheads indicates that gas temperature does not vary by more than .
To illustrate how variable densities and temperatures affect the CO overtone bandheads, we generate synthetic spectra for different parameter values. Using CO opacities from the HITRAN/HITEMP database (Rothman et al. 2005), we generate synthetic spectra, then smooth them to the resolution of our data. (We add a continuum level of unity to these spectra, to match the normalized spectra presented above.) Example spectra where density or temperature has been varied by are shown in Figure 13. Comparison of this Figure with the spectra of our observed sources shows that such variations–or anything larger–would produce observable effects. Indeed, the EWs and ratios of EWs for the two overtone bandheads in these examples vary more than seen in any of our sample objects.
If inner disk regions varied on dynamical timescales, we would expect to see variations in the CO emission/absorption on timescales of . Assuming that CO gas is found between magnetospheric and dust sublimation radii, measured radii for protoplanetary disks in our sample (Eisner et al. 2004, 2005, 2007; Tatulli et al. 2008; Eisner & Hillenbrand 2011) imply dynamical times days. Similar variability timescales are expected for processes related to the interaction between stellar magnetospheres and inner accretion disks. Changes in the magnetospheric radius with time (e.g., Goodson et al. 1999; Goodson & Winglee 1999), or the intrusion of time-variable accretion streams through the magnetosphere (e.g., Kulkarni & Romanova 2009), can alter the inner gaseous disk structure on timescales similar to .
The lack of observed variations on these timescales, which are well-sampled with our observing cadence, suggests a lack of inner disk changes on dynamical timescales. We note, though, that one of our targets did show such variability in a previous study (Biscaya et al. 1997).
Variation in the CO overtone emission may also occur because of density or temperature changes on timescales longer than those sampled here. The density of gas may vary if accretion through the disk is not steady; such variations would occur on viscous timescales. For an disk (e.g., Shakura & Sunyaev 1973), viscous timescales are
Typical values for the ratio of disk height to radius () and yield inner disk viscous timescales of years for our sample. Variable gas temperature, for example due to changing heating from a variable central star, can also lead to CO variability. Such variability would occur on thermal timescales, year for our sample. While our data do not sample such timescales, long-term variations between different observations in the literature may be due, in part, to such effects.
5 Conclusions
We presented multi-epoch FSPEC observations of the CO overtone bandheads in a sample of young stars. CO emission or absorption was observed in a number of targets, although no significant variability of the emission/absorption features was seen across timescales of days or months. In contrast, previous monitoring observations have found variability on such timescales. Moreover, for sources with previous CO-band spectra in the literature, the features seen in our data do appear different than those seen in previous observations.
These results indicate that variability in the CO overtone bandheads may have a low duty cycle, or that the sources in our sample undergo significant quiescent periods when the variability is small. Our observations sampled well the inner disk dynamical timescales of our targets, indicating that the inner disk density and/or temperature did not vary at a level above . The origin of long-term variations–i.e., those between our observations and previous data in the literature–is less well-constrained.
Acknowledgments. JAE gratefully acknowledges support from an Alfred P. Sloan Research Fellowship. Support for this work, largely for students affiliated with the project, comes from the National Science Foundation under Award No. AST-0847170, a PAARE Grant for the California-Arizona Minority Partnership for Astronomy Research and Education (CAMPARE). Any opinions, findings, and conclusions or recommendations expressed in this material are those of the author(s) and do not necessarily reflect the views of the National Science Foundation.
References
- Ábrahám et al. (2004) Ábrahám, P., Kóspál, Á., Csizmadia, S., Kun, M., Moór, A., & Prusti, T. 2004, A&A, 428, 89
- Berthoud (2008) Berthoud, M. G. 2008, PhD thesis, Cornell University
- Berthoud et al. (2007) Berthoud, M. G., Keller, L. D., Herter, T. L., Richter, M. J., & Whelan, D. G. 2007, ApJ, 660, 461
- Biscaya et al. (1997) Biscaya, A. M., Rieke, G. H., Narayanan, G., Luhman, K. L., & Young, E. T. 1997, ApJ, 491, 359
- Brittain et al. (2007) Brittain, S. D., Simon, T., Najita, J. R., & Rettig, T. W. 2007, ApJ, 659, 685
- Calvet et al. (1991) Calvet, N., Patino, A., Magris, G. C., & D’Alessio, P. 1991, ApJ, 380, 617
- Carpenter et al. (2001) Carpenter, J. M., Hillenbrand, L. A., & Skrutskie, M. F. 2001, AJ, 121, 3160
- Carr (1989) Carr, J. S. 1989, ApJ, 345, 522
- Cohen & Kuhi (1979) Cohen, M. & Kuhi, L. V. 1979, ApJS, 41, 743
- Cutri et al. (2003) Cutri, R. M., Skrutskie, M. F., van Dyk, S., Beichman, C. A., Carpenter, J. M., Chester, T., Cambresy, L., Evans, T., Fowler, J., Gizis, J., Howard, E., Huchra, J., Jarrett, T., Kopan, E. L., Kirkpatrick, J. D., Light, R. M., Marsh, K. A., McCallon, H., Schneider, S., Stiening, R., Sykes, M., Weinberg, M., Wheaton, W. A., Wheelock, S., & Zacarias, N. 2003, 2MASS All Sky Catalog of point sources. (The IRSA 2MASS All-Sky Point Source Catalog, NASA/IPAC Infrared Science Archive. http://irsa.ipac.caltech.edu/applications/Gator/)
- Eiroa et al. (2002) Eiroa, C., Oudmaijer, R. D., Davies, J. K., de Winter, D., Garzón, F., Palacios, J., Alberdi, A., Ferlet, R., Grady, C. A., Cameron, A., Deeg, H. J., Harris, A. W., Horne, K., Merín, B., Miranda, L. F., Montesinos, B., Mora, A., Penny, A., Quirrenbach, A., Rauer, H., Schneider, J., Solano, E., Tsapras, Y., & Wesselius, P. R. 2002, A&A, 384, 1038
- Eisner et al. (2010) Eisner, J. A., Doppmann, G. W., Najita, J. R., McCarthy, D., Kulesa, C., Swift, B. J., & Teske, J. 2010, ApJ, 722, L28
- Eisner et al. (2009) Eisner, J. A., Graham, J. R., Akeson, R. L., & Najita, J. 2009, ApJ, 692, 309
- Eisner & Hillenbrand (2011) Eisner, J. A. & Hillenbrand, L. A. 2011, ApJ, 738, 9
- Eisner et al. (2005) Eisner, J. A., Hillenbrand, L. A., White, R. J., Akeson, R. L., & Sargent, A. I. 2005, ApJ, 623, 952
- Eisner et al. (2007) Eisner, J. A., Hillenbrand, L. A., White, R. J., Bloom, J. S., Akeson, R. L., & Blake, C. H. 2007, ApJ, 669, 1072
- Eisner et al. (2004) Eisner, J. A., Lane, B. F., Hillenbrand, L., Akeson, R., & Sargent, A. 2004, ApJ, 613, 1049
- Flaherty et al. (2012) Flaherty, K. M., Muzerolle, J., Rieke, G., Gutermuth, R., Balog, Z., Herbst, W., Megeath, S. T., & Kun, M. 2012, ApJ, 748, 71
- Forbrich et al. (2007) Forbrich, J., Preibisch, T., Menten, K. M., Neuhäuser, R., Walter, F. M., Tamura, M., Matsunaga, N., Kusakabe, N., Nakajima, Y., Brandeker, A., Fornasier, S., Posselt, B., Tachihara, K., & Broeg, C. 2007, A&A, 464, 1003
- Glass & Penston (1974) Glass, I. S. & Penston, M. V. 1974, MNRAS, 167, 237
- Goodson et al. (1999) Goodson, A. P., Böhm, K.-H., & Winglee, R. M. 1999, ApJ, 524, 142
- Goodson & Winglee (1999) Goodson, A. P. & Winglee, R. M. 1999, ApJ, 524, 159
- Greene et al. (2008) Greene, T. P., Aspin, C., & Reipurth, B. 2008, AJ, 135, 1421
- Greene & Lada (1996) Greene, T. P. & Lada, C. J. 1996, AJ, 112, 2184
- Hartmann et al. (2004) Hartmann, L., Hinkle, K., & Calvet, N. 2004, ApJ, 609, 906
- Hartmann & Kenyon (1985) Hartmann, L. & Kenyon, S. J. 1985, ApJ, 299, 462
- Hartmann & Kenyon (1987) —. 1987, ApJ, 312, 243
- Herbst et al. (1994) Herbst, W., Herbst, D. K., Grossman, E. J., & Weinstein, D. 1994, AJ, 108, 1906
- Joy (1942) Joy, A. H. 1942, PASP, 54, 15
- Kulkarni & Romanova (2009) Kulkarni, A. K. & Romanova, M. M. 2009, MNRAS, 398, 701
- Mendigutía et al. (2011) Mendigutía, I., Eiroa, C., Montesinos, B., Mora, A., Oudmaijer, R. D., Merín, B., & Meeus, G. 2011, A&A, 529, A34
- Mendoza (1968) Mendoza, E. E. 1968, ApJ, 151, 977
- Najita et al. (1996) Najita, J., Carr, J. S., Glassgold, A. E., Shu, F. H., & Tokunaga, A. T. 1996, ApJ, 462, 919
- Najita et al. (2003) Najita, J., Carr, J. S., & Mathieu, R. D. 2003, ApJ, 589, 931
- Najita et al. (2007) Najita, J. R., Carr, J. S., Glassgold, A. E., & Valenti, J. A. 2007, in Protostars and Planets V, B. Reipurth, D. Jewitt, and K. Keil (eds.), University of Arizona Press, Tucson, 951 pp., 2007., p.507-522, ed. B. Reipurth, D. Jewitt, & K. Keil, 507–522
- Najita et al. (2009) Najita, J. R., Doppmann, G. W., Carr, J. S., Graham, J. R., & Eisner, J. A. 2009, ApJ, 691, 738
- Najita et al. (2000) Najita, J. R., Edwards, S., Basri, G., & Carr, J. 2000, Protostars and Planets IV, 457
- Rothman et al. (2005) Rothman, L. S., Jacquemart, D., Barbe, A., Benner, D. C., Birk, M., Brown, L. R., Carleer, M. R., Chackerian, C., Chance, K., Coudert, L. H., Dana, V., Devi, V. M., Flaud, J. M., Gamache, R. R., Goldman, A., Hartmann, J. M., Jucks, K. W., Maki, A. G., Mandin, J. Y., Massie, S. T., Orphal, J., Perrin, A., Rinsland, C. P., Smith, M. A. H., Tennyson, J., Tolchenov, R. N., Toth, R. A., Vander Auwera, J., Varanasi, P., & Wagner, G. 2005, Journal of Quantitative Spectroscopy and Radiative Transfer, 96, 139
- Shakura & Sunyaev (1973) Shakura, N. I. & Sunyaev, R. A. 1973, A&A, 24, 337
- Skrutskie et al. (1996) Skrutskie, M. F., Meyer, M. R., Whalen, D., & Hamilton, C. 1996, AJ, 112, 2168
- Sun et al. (1991) Sun, J., Wu, Y.-F., Mao, X.-J., & Li, S.-Z. 1991, Acta Astronomica Sinica, 32, 134
- Tannirkulam et al. (2008) Tannirkulam, A., Monnier, J. D., Millan-Gabet, R., Harries, T. J., Pedretti, E., ten Brummelaar, T. A., McAlister, H., Turner, N., Sturmann, J., & Sturmann, L. 2008, ApJ, 677, L51
- Tatulli et al. (2008) Tatulli, E., Malbet, F., Ménard, F., Gil, C., Testi, L., Natta, A., Kraus, S., Stee, P., & Robbe-Dubois, S. 2008, A&A, 489, 1151
- Thi et al. (2005) Thi, W.-F., van Dalen, B., Bik, A., & Waters, L. B. F. M. 2005, A&A, 430, L61
- Zhu et al. (2009) Zhu, Z., Hartmann, L., Gammie, C., & McKinney, J. C. 2009, ApJ, 701, 620
| Source | Night | Airmass | Calibrators | Airmass | ||||
|---|---|---|---|---|---|---|---|---|
| (J2000) | (J2000) | (s) | (s) | |||||
| AS 205 N | 16 11 31.40 | -18 38 24.5 | 05/15/11 | 300 | 2.1 | HD 145127 | 150, 300 | 2.4, 2.0 |
| 05/17/11 | 300 | 1.7 | HD 145188 | 300 | 1.9 | |||
| 06/20/11 | 125 | 1.7 | HD 145188 | 250 | 1.8 | |||
| V1002 Sco | 16 12 40.51 | -18 59 28.1 | 05/15/11 | 150 | 2.0 | HD 145127 | 150,300 | 2.4, 2.0 |
| 05/17/11 | 300 | 1.7 | HD 145188 | 300 | 1.9 | |||
| 06/20/11 | 250 | 1.7 | HD 145188 | 250 | 1.8 | |||
| V2508 Oph | 16 48 45.63 | -14 16 40.0 | 05/15/11 | 300 | 2.0 | HD 145127 | 150, 300 | 2.4, 2.0 |
| 05/17/11 | 300 | 1.6 | HD 145188, HD 145127 | 300, 150 | 1.9, 1.8 | |||
| 06/20/11 | 250 | 1.5 | HD 145188 | 250 | 1.8 | |||
| AS 209 | 16 49 15.30 | -14 22 08.6 | 05/15/11 | 300 | 1.9 | HD 145127 | 150, 300 | 2.4, 2.0 |
| 05/17/11 | 300 | 1.5 | HD 145127 | 150 | 1.8 | |||
| 06/20/11 | 250 | 1.5 | HD 145188 | 250 | 1.8 | |||
| MWC 863 | 16 40 17.92 | -23 53 45.2 | 05/15/11 | 150 | 2.1 | HD 145127 | 300 | 2.0 |
| 05/17/11 | 150 | 1.8 | HD 145127 | 150 | 1.8 | |||
| 06/20/11 | 125 | 2.0 | HD 145127 | 250 | 2.2 | |||
| 51 Oph | 17 31 24.95 | -23 57 45.5 | 05/15/11 | 150 | 2.3 | HD 145127 | 300 | 2.0 |
| 05/17/11 | 150 | 1.8 | HD 145127 | 150 | 1.8 | |||
| 06/20/11 | 125 | 1.9 | HD 145127 | 250 | 2.2 | |||
| MWC 275 | 17 56 21.29 | -21 57 21.9 | 05/15/11 | 150 | 2.4 | HD 145127 | 300 | 2.0 |
| 05/17/11 | 150 | 1.8 | HD 145127 | 150 | 1.8 | |||
| 06/20/11 | 125 | 1.7 | HD 145127 | 250 | 2.2 | |||
| V1685 Cyg | 20 20 28.24 | 41 21 51.6 | 05/15/11 | 300 | 1.4 | HD 192538 | 300 | 1.5 |
| 05/16/11 | 150 | 1.3 | HD 192538, HD 199312 | 300, 450 | 1.3, 1.3 | |||
| 05/17/11 | 300 | 1.1 | HD 192538, HD 199312 | 300, 300 | 1.1, 1.1 | |||
| 06/19/11 | 250 | 1.0 | HD 192538, HD 199312 | 250, 375 | 1.0, 1.0 | |||
| 06/20/11 | 125 | 1.0 | HD 192538, HD 199312 | 125, 250 | 1.0, 1.1 | |||
| V1515 Cyg | 20 23 48.02 | 42 12 25.8 | 05/15/11 | 300 | 1.6 | HD 192538 | 300 | 1.5 |
| 05/16/11 | 570 | 1.5 | HD 192538 | 300 | 1.3 | |||
| 05/17/11 | 300 | 1.2 | HD 192538 | 300 | 1.1 | |||
| 06/19/11 | 375 | 1.0 | HD 192538 | 250 | 1.0 | |||
| 06/20/11 | 250 | 1.1 | HD 192538 | 125 | 1.0 | |||
| AS 442 | 20 47 37.47 | 43 47 24.9 | 05/15/11 | 300 | 1.5 | HD 192538 | 300 | 1.5 |
| 05/16/11 | 300 | 1.3 | HD 192538, HD 199312 | 300, 450 | 1.3, 1.3 | |||
| 05/17/11 | 300 | 1.1 | HD 192538, HD 199312 | 300, 300 | 1.1, 1.1 | |||
| 06/19/11 | 125 | 1.0 | HD 192538, HD 199312 | 250, 375 | 1.0, 1.0 | |||
| 06/20/11 | 125 | 1.1 | HD 192538, HD 199312 | 125, 250 | 1.0, 1.1 | |||
| V1057 Cyg | 20 58 53.73 | 44 15 28.5 | 05/15/11 | 300 | 1.8 | HD 192538 | 300 | 1.5 |
| 05/16/11 | 300 | 1.6 | HD 192538, HD 199312 | 300, 450 | 1.3, 1.3 | |||
| 05/17/11 | 300 | 1.2 | HD 192538 | 300 | 1.1 | |||
| 06/19/11 | 200 | 1.0 | HD 192538 | 250 | 1.0 | |||
| 06/20/11 | 125 | 1.1 | HD 192538 | 125 | 1.0 | |||
| V1331 Cyg | 21 01 09.21 | 50 21 44.8 | 05/15/11 | 150 | 1.7 | HD 192538 | 300 | 1.5 |
| 05/16/11 | 150 | 1.3 | HD 193369, HD 199312 | 150, 450 | 1.1, 1.3 | |||
| 05/17/11 | 150 | 1.1 | HD 192538 | 300 | 1.1 | |||
| 06/19/11 | 500 | 1.1 | HD 192538 | 250 | 1.0 | |||
| 06/20/11 | 250 | 1.1 | HD 192538 | 125 | 1.0 |
Note. — Sources are listed roughly in order or right ascension, keeping targets that share common calibration in consecutive order.
| Source | Night | EW | EW |
|---|---|---|---|
| (Å) | (Å) | ||
| AS 205N | 05/15/11 | ||
| 05/17/11 | |||
| 06/20/11 | |||
| V1002 Sco | 05/15/11 | ||
| 05/17/11 | |||
| 06/20/11 | |||
| V2508 Oph | 05/15/11 | ||
| 05/17/11 | |||
| 06/20/11 | |||
| AS 209 | 05/15/11 | ||
| 05/17/11 | |||
| 06/20/11 | |||
| MWC 863 | 05/15/11 | ||
| 05/17/11 | |||
| 06/20/11 | |||
| 51 Oph | 05/15/11 | ||
| 05/17/11 | |||
| 06/20/11 | |||
| MWC 275 | 05/15/11 | ||
| 05/17/11 | |||
| 06/20/11 | |||
| V1685 Cyg | 05/15/11 | ||
| 05/16/11 | |||
| 05/17/11 | |||
| 06/19/11 | |||
| 06/20/11 | |||
| V1515 Cyg | 05/15/11 | ||
| 05/16/11 | |||
| 05/17/11 | |||
| 06/19/11 | |||
| 06/20/11 | |||
| AS 442 | 05/15/11 | ||
| 05/16/11 | |||
| 05/17/11 | |||
| 06/19/11 | |||
| 06/20/11 | |||
| V1057 Cyg | 05/15/11 | ||
| 05/16/11 | |||
| 05/17/11 | |||
| 06/19/11 | |||
| 06/20/11 | |||
| V1331 Cyg | 05/15/11 | ||
| 05/16/11 | |||
| 05/17/11 | |||
| 06/19/11 | |||
| 06/20/11 |
Note. — Uncertainties include statistical uncertainties and uncertainties related to uncorrected bad pixels, but do not include errors in estimation of continuum level.