VLT/X-Shooter Near-Infrared Spectroscopy and HST Imaging of Gravitationally-Lensed Compact Quiescent Galaxies††thanks: Based on observations collected at the European Organization for Astronomical Research in the Southern Hemisphere, Chile, under programs 087.B-0812 (PI: Toft) and 073.A-0537 (PI: Kneib)
Abstract
Quiescent massive galaxies at are thought to be the progenitors of present-day massive ellipticals. Observations revealed them to be extraordinarily compact. The determination of stellar ages, star formation rates and dust properties via spectroscopic measurements has up to now only been feasible for the most luminous and massive specimens (). Here we present a spectroscopic study of two near-infrared selected galaxies which are close to the characteristic stellar mass ( and ) and whose observed brightness has been boosted by the gravitational lensing effect. We measure the redshifts of the two galaxies to be and . By fitting stellar population synthesis models to their spectro-photometric SEDs we determine their ages to be Gyr and Gyr, respectively, which implies that the two galaxies have higher mass-to-light ratios than most quiescent galaxies in other studies. We find no direct evidence for active star-formation or AGN activity in either of the two galaxies, based on the non-detection of emission lines. Based on the derived redshifts and stellar ages we estimate the formation redshifts to be and , respectively. We use the increased spatial resolution due to the gravitational lensing to derive constraints on the morphology. Fitting Sersic profiles to the de-lensed images of the two galaxies confirms their compactness, with one of them being spheroid-like, and the other providing the first confirmation of a passive lenticular galaxy at a spectroscopically derived redshift .
1 Introduction
The study of galaxy formation and evolution has taken giant leaps forward in the last 15 years. In particular the use of the Lyman-break (or drop-out) selection technique has revealed large numbers of star-forming galaxies over a wide range of redshifts all the way back to (e.g., Steidel et al., 2003; Bouwens et al., 2011).
The current overall stellar mass density is about 5108 M☉ Mpc-3 (Fukugita et al., 1998; Dickinson et al., 2003; Bell et al., 2003; Baldry et al., 2012) and the early build-up of this mass is now becoming observationally accessible (only accurate to a factor of a few at the highest redshifts) from roughly (0.1% of the present value) to (10–20% of the present value) (Labbé et al., 2010). Roughly 80–90% of present day stars must have formed at (Marchesini et al., 2009). The cosmic star-formation history at seems to proceed in a manner that has been referred to as ”Downsizing”, i.e. proceeding from high- to low-mass systems as a function of cosmic time (e.g. Juneau et al., 2005). A similar picture emerges from the morphological evolution of galaxies at different stellar masses (Cameron et al., 2011).
It has become evident that the redshift interval constitutes the most important phase in the formation and evolution of massive ( M☉) galaxies. This is the cosmic era when massive galaxies had the peak of their star-formation and AGN activity and when their morphologies began to be transformed from being disk-like into being dominated by spheroids, and even having their star formation quenched (Lilly et al., 1996; Madau et al., 1996, 1998; Hopkins, 2004; Stockton et al., 2005; Hopkins & Beacom, 2006; Kodama et al., 2007; Zirm et al., 2008; Cano-Díaz et al., 2012). These processes are probably connected, with massive star-forming galaxies building up their stellar mass, subsequent mergers igniting nuclear starbursts, transforming the morphology from disks to spheroids, and finally ignition of the AGN shutting down star-formation.
Furthermore, it appears that the mass-metallicity and color-magnitude relations we observe at lower redshifts were most likely established in that era (Mannucci et al., 2010).
The advent of deep near-infrared (NIR) surveys revealed a population of massive galaxies that seem to have had their star-formation quenched already at (Franx et al., 2003; van Dokkum et al., 2003). These must have been the first massive galaxies that stopped forming stars.
Many of these galaxies have been shown to be extremely compact (effective radii kpc), with mean sizes of about one sixth to one third of that of local elliptical galaxies of the same stellar mass (Trujillo et al., 2006b, a; Toft et al., 2007; Zirm et al., 2007; Buitrago et al., 2008; Kriek et al., 2009; Toft et al., 2009; Newman et al., 2012).
This probably reflects their very early formation epochs, when the Universe was much denser than today.
Trujillo et al. (2009) and Taylor et al. (2010) find that in the local Universe this type of galaxies is extremely rare, which means that the massive compact galaxies we see at must have experienced significant structural evolution since then. The picture that has been put together in the last few years is that of inside-out growth due to mostly minor merging (Bezanson et al., 2009; Naab et al., 2009; van Dokkum et al., 2010; Newman et al., 2012; Oogi & Habe, 2013).
Quiescent galaxies contain a large fraction of the total stellar mass at , and need to be studied in greater detail in order to obtain a complete picture of all types of galaxy populations at .
Our understanding of these distant massive quiescent galaxies is still limited, as redshifts
and stellar population studies have been mainly based on broad-band
photometry. Spectroscopic confirmation of their redshifts and stellar
properties is very important but also very challenging, as these objects are extremely
faint in the observed optical wavelength range (mag) and in the absence of star formation do not exhibit emission lines.
Up to now spectroscopic investigations have only been possible for the brightest galaxies of this class which may not be representative for the overall population.
Previous spectroscopic studies, such as GMASS
(Cimatti et al., 2008; Kurk et al., 2008), have used hours of 8-m
telescope time (per MOS mask) to obtain redshifts. To push from mere redshift determinations to stellar population studies and stellar velocity dispersions, higher signal-to-noise ratios are required, which reduces the target sample size even further and renders statistical studies challenging with currently available instrumentation.
As a way to circumvent this problem we select massive quiescent galaxies that have been strongly lensed by intermediate redshift galaxy clusters.
Gravitational lensing can boost the observed magnitudes to a level at which spectroscopy of continuum and absorption lines becomes feasible within a reasonable amount of observing time, even for galaxies with luminosities around .
The approach to make use of the strong gravitational lensing effect of galaxy clusters to identify galaxies at high redshifts (Pelló et al., 1998; Richard et al., 2004) for easier photometric (Pelló et al., 1999, 2007) and spectroscopic follow-up studies (Campusano et al., 2001; Lemoine-Busserolle et al., 2003) has been in use for more than a decade and has been proven a very powerful method for many types of high-redshift objects (Richard et al., 2006; Schaerer et al., 2007; Hempel et al., 2008; Maizy et al., 2010; Richard et al., 2011; Christensen et al., 2012a, b).
We now extend this method to the above-described population of distant massive quiescent galaxies.
With the help of already available mass-models (Ebeling et al., 2007; Richard et al., 2010) for clusters in which strong lensing is observed, we can determine the intrinsic
luminosities of distant massive quiescent galaxies identified in the high-magnification regions of the cluster images.
In this way we have identified significantly magnified distant massive quiescent galaxies with intrinsic luminosities (assuming ) around with observed -band (Vega) magnitudes mag. These galaxies are within reach of spectrographs like X-Shooter on the VLT with total exposure times of 5–10 h, as has been shown in recent studies (van de Sande et al., 2011, 2012; Toft et al., 2012).
In this paper we present NIR spectra of two gravitationally-lensed distant massive quiescent galaxies obtained with VLT/X-Shooter, combined with broad-band photometry from the Hubble Space Telescope (HST) and ground-based facilities. In the next section we describe how the targets were selected from imaging data, and how the spectroscopic data were reduced. Sect. 3 contains the analysis of the spectra, with the obtained redshifts, stellar population synthesis models, constraints on potentially on-going star formation, and a structural analysis for the galaxies with resolved imaging from HST. In Sect. 4 we discuss the interpretation of these results with respect to currently discussed paradigms of galaxy formation and evolution.
We adopt a flat cosmology with , and
, according to Komatsu et al. (2011). Magnitudes and colors in this paper are given in the Vega magnitude system, except where they are explicitly marked to be in the AB system.
2 Object selection, data reduction and SEDs
2.1 Target selection
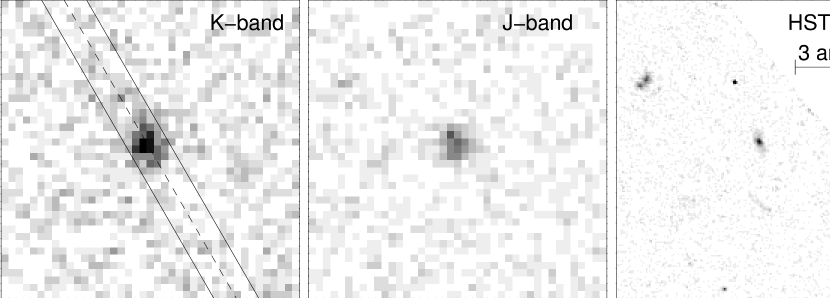
The two candidate massive quiescent galaxies which we present in this article were identified behind the strong lensing clusters Abell 1413 (, Böhringer et al., 2000) and MACS2129-0741 (, Ebeling et al., 2007). For A1413 - and -band images were available from the WIRC instrument (Wilson et al., 2003) on the Palomar 200-inch telescope, with depths of 22.1mag in and 20.5mag in , respectively (see also Richard et al., 2010, for details on the data reduction). Near-Infrared imaging data of MACS2129-0741 was available from VLT/ISAAC (with depths of 22.9mag and 20.8mag in and , respectively). We adopt in SExtractor (Bertin & Arnouts, 1996) for total magnitudes and determine the photometric zeropoints using bright (mag in each band) stars from the 2MASS catalog (Skrutskie et al., 2006) within the same field. For both clusters, colors were obtained by using the dual mode of SExtractor with the -band image as detection image and measuring fluxes in small circular apertures of about the size of the seeing disc. To account for seeing differences, the WIRC -band image of A1413 was Gaussian-convolved to the -band seeing. In both the ISAAC images of MACS2129-0741, we measure seeing FWHMs of , thus no convolution was necessary. Galactic extinction corrections were applied according to the Schlegel et al. (1998) extinction maps.
One of the red galaxies, which we identified in the A1413 field, and which we refer to as A1413-1, was selected as one of the spectroscopic targets. Out of the lensed sources identified in the field of MACS2129-0741, we present spectroscopy for the brightest one which we refer to as MACS2129-1. Both were selected mainly for their relatively bright apparent magnitudes and the lensing magnification. The color-criterion of , originally proposed by Franx et al. (2003) was used as a guideline, but given that the brightest lensed red galaxy in the field of A1413 exhibits a color of , this was not followed strictly. A short summary of the two objects is given in Table 1.
At the time of target selection we assumed a redshift of the sources of and using the mass models from Richard et al. (2010), we estimated the lensing magnifications to be 0.8mag for A1413-1 and 1.87mag for MACS2129-1, respectively. Later we will refine the de-lensing, based on more accurate redshifts, to be described in the following chapters.
| Name | Facility | RA | DEC | |||
|---|---|---|---|---|---|---|
| A1413-1 | WIRC | 2.15 | 19.81 | |||
| MACS2129-1 | ISAAC | 2.42 | 19.68 |
In Fig. 1 we show cutout images of the two galaxies. It is clearly visible that the image of MACS2129-1 is stretched to an arc with an extension of about (FWHM) by the strong lensing effect of the foreground cluster. We will discuss its morphology later in more detail, where MACS2129-1 turns out to be a disk-like galaxy in the source-plane at .
2.2 Spectroscopic data
Both targets (A1413-1 and MACS2129-1) were observed as part of the ESO program 087.B-0812 (PI: Toft) with the X-shooter spectrograph (D’Odorico et al., 2006) on VLT/UT2. This instrument is a medium-resolution Echelle spectrograph capable of obtaining spectra from the UV () to the NIR () simultaneously. The data were collected with a generic offset template that obtained six 480s long exposures per observation block in the NIR arm, using the slit. The total exposure times in the NIR arm were 3.2h for both A1413-1 and MACS2129-1, in seeing conditions which varied between and .
2.3 Spectroscopic Data Reduction
For the reduction of the spectroscopic data the ESO X-shooter pipeline version 1.3.7 (Modigliani et al., 2010) was used. The calibration steps (master darks, order prediction, flat fields, and the 2d maps for later rectification of the spectra) were run for each night separately, with the default parameters in the pipeline (Goldoni, 2011).
With the output from these five calibration steps the scientific raw frames are reduced: The Echelle spectra get dark-subtracted, flatfielded, and rectified. We experiment with different pipeline recipes and parameter settings for the reduction of the science frames. It turned out that reducing them in ”stare-mode”, where the sky-background for a given object frame is estimated from that same object frame, results in poor sky-subtraction and large skyline-residuals, especially in the wavelength range of the -band. Instead, using the nodding recipe, where dithered frames are used pairwise for subtraction of the sky-background, provides the best sky-subtraction and signal-to-noise ratio (SNR) for data from the NIR arm. Thus we decided to use this method for the reduction of the object frames, which results in one reduced 2d image for each adjacent pair of raw object frames, which comprises 16min of exposure time. For consistency, the data from the UV and optical arms were also reduced with the nodding recipe and sampled onto the same grid.
2.4 Flux calibration, combination and 1d extraction
For flux calibration, standard stars were observed in each night in which the data were obtained. They are taken from a list of eight white dwarfs, the intrinsic spectra of which have been modeled very accurately. Each standard star observation is reduced with the same calibration data as the science frames from the same night and the same pipeline parameters are employed for the reduction of the raw standard frames. From the observed shape of the flux standard spectrum we derive the spectral response curve: the 1d extracted spectrum of the standard star is divided by the tabulated known intrinsic spectrum (which is first interpolated and re-gridded to the same pixel binning on the wavelength axis) and the resulting curve is smoothed with a kernel of 15 pixels to obtain a smooth response curve and to minimize artificial effects introduced by pixels with abnormal values. We apply the flux calibration by first dividing the 2d spectra of our science targets as well as the 1d response curve by the respective exposure times (thus normalizing them to 1s exposure time) and then dividing the normalized 2d spectra along the wavelength axis by the normalized response curve for the respective night. In the NIR, atmospheric extinction is negligible, and no atmospheric extinction table is available for that wavelength range in the pipeline release. Telluric absorption is accounted for by the flux standard, as we apply only little smoothing to the overall response curve.
By collapsing and weighting the spectrum along the wavelength axis, we determine the shapes of the spectral point spread function (SPSF) on the individual 2d spectra which we get as output from the pipeline, and thus determine the shifts to register and co-add the 2d spectra, which is done as a mean combination with rejection of outliers, which we define as pixel values which deviate from the mean by more than . We apply the same calibrations to the error maps as well, and combine them according to
| (1) |
The final SPSF is determined by collapsing the weighted 2d stack along the wavelength axis in the -band wavelength range (where the SNR per pixel is highest) and the 1d spectrum is extracted by applying the corresponding normalized weights, a procedure which is similar to the optimal extraction procedure described in Horne (1986). The extraction window spans a spatial extension of around the centre of the trace for the point-source-like A1413-1, and for MACS2129-1, which is extended to an arc with a FWHM of , we extract the 1d spectrum in a window. A 1d error spectrum is extracted the following way: with NSP being the normalized SPSF along the extraction window, the 1d variance is calculated as
| (2) |
and the 1d errors are then the square root of that variance.
Galactic extinction corrections are taken from Schlegel et al. (1998) and implemented with the code in IDL.
To check the flux level we integrate the extracted 1d spectra over the transmission curves of the -band filters of the instrument from which the imaging data originate and compare with the photometric measurement. We subsequently scale both 1d spectra to match the -band photometry, thus correcting for slit losses.
2.5 HST imaging data
To add further information to the SEDs of the two galaxies we include photometry from publicly available HST images of the two galaxies. For A1413-1 we use images obtained with the Advanced Camera for Surveys (ACS) in the and bands as part of program 9292 (PI: Holland Ford). For MACS2129-1 we use images obtained with ACS in the band and with Wide Field Camera 3 (WFC3) in the , , , and bands. These images were obtained as part of the CLASH Survey (program 12100, PI: Marc Postman). Photometry for A1413-1 is done with circular apertures (diameter ). For MACS2129-1, which is extended to an arc, we use SExtractor (Bertin & Arnouts, 1996) to define elliptical apertures and measure the total counts using . For the image of MAC2129-1 we used the image (re-binned and rotated to the pixel size and orientation) to define the aperture as the source is very faint in this band. We adopt zeropoints and aperture corrections from the ACS and WFC3 instrument handbooks. The Schlegel et al. (1998) maps again provide the galactic extinction corrections. The error bars on the photometry are conservative estimations, in order to account for cross-calibration issues when used together with the X-Shooter spectra to construct the SEDs of the two galaxies. We check the accuracy of the relative flux-calibration in both spectra by over-plotting the HST photometry and conclude from the good agreement that no further flux correction of the spectra is necessary.
2.6 Spitzer imaging data
Both MACS2129 and A1413 had also been observed with the Multiband Imaging Photometer (MIPS) on the Spitzer Space Telescope, in the -band. 1320s of integration time were obtained on MACS2129 as part of program 50610 (PI: Yun) and 480s on A1413 as part of program 41011 (PI: Egami). Both galaxies in our study are undetected on these images. Because of noise structures in the images it was also not possible to derive upper limits on their fluxes.
3 Data analysis
The signal-to-noise ratio in the spectra of both targeted galaxies is relatively low. We estimated the S/N in bins of several nm along the wavelength axis, where we sum up the flux in the object trace in a spatial window of about one seeing FWHM, and estimated the noise from the regions of the same size without object flux below and above the trace. For MACS2129-1 we thus estimate a mean of , , and in the -, -, and -band wavelength regions, respectively. For the spectrum of the significantly fainter A1413-1 the values are , , and for , , and , respectively.
3.1 Redshift determination and spectral energy distribution analysis
3.1.1 Emission and absorption lines
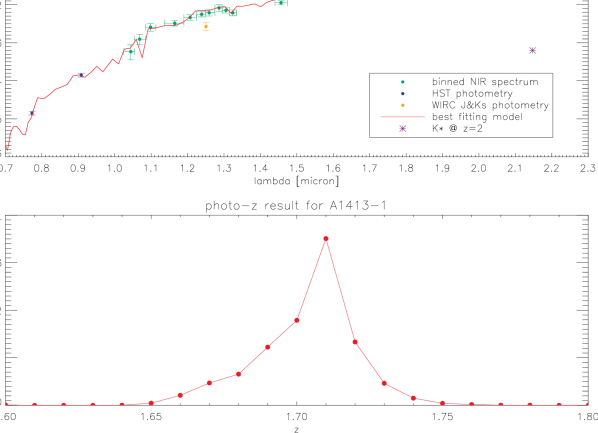
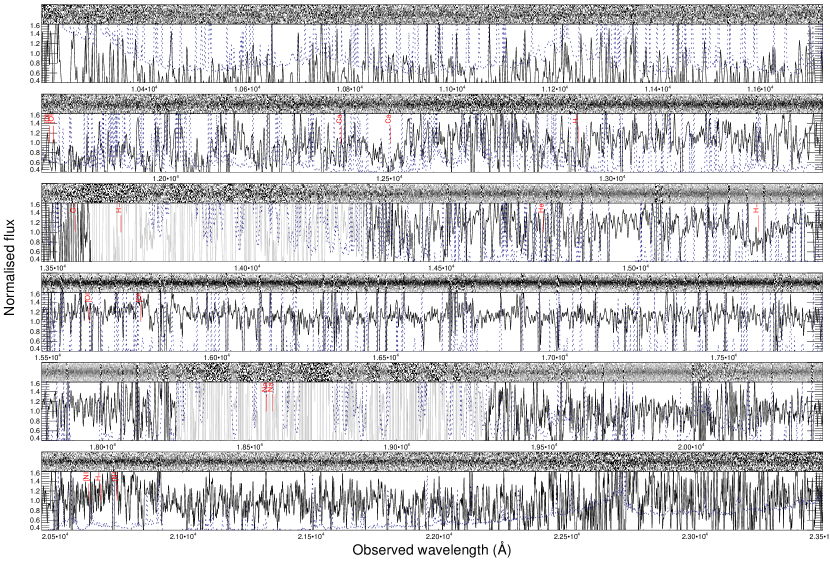
The NIR 2d spectra of both galaxies were examined visually to search for emission lines and absorption features. Visualizations of both the NIR 2d and 1d spectra are shown in Figures 4, 5, and 6. For better visibility, we also smooth them along the wavelength axis. We do not detect emission lines in the spectra of any of the two galaxies. At several positions we see hints of absorption lines, but we did not consider these significant and reliable enough for an independent robust redshift measurement. Instead we proceed with an analysis of the spectral energy distributions and photometric redshift measurements in Sect. 3.1.2 and Sect. 3.1.3. Guided by those we then in Sect. 3.1.4 return to the issue of the nature of the tentative spectral lines.
We do not find any trace in the UV arm data for both objects. Over the whole optical wavelength range, a trace is detected from MACS2129-1, and partly from A1413-1. Even in big bins, however, we only find very low S/N. As a consequence we will later rely on the HST broad-band magnitudes for this wavelength range.
3.1.2 Construction of spectro-photometric Spectral Energy Distributions
Although the potential absorption lines in the NIR spectra of both galaxies are not significant enough to reliably determine independent spectroscopic redshifts, there is still the possibility to determine their redshifts (although with higher uncertainties than for line measurements) from the shape of the NIR spectrum, i.e. mainly the position of the Balmer/4000Å-break which both are distinctive (but partly overlapping) features in stellar populations with ages of several hundred Myrs and above.
In order to have a well-sampled Spectral Energy Distribution (SED) with sufficient S/N in each data point, we bin the NIR spectrum, with bin sizes ranging between 15nm and 70nm.
For each bin we regard the wavelength range as the transmission curve of a
“synthetic filter” with cut-on and cut-off wavelengths and
and mean wavelength , which we all define below.
Furthermore, the combined fluxes and errors in each bin are calculated from the
original fluxes and errors as follows:
| (3) |
| (4) |
| (5) |
| (6) |
| (7) |
One can see from the above formulae that the relative weights of each contributing wavelength pixel are used as “transmission” of our individually defined “synthetic filters”.
To obtain reliable constraints on the redshifts via the position of the Balmer/4000Å-break we want to sample this region with several data points on each side of the feature. From visual inspection of the shape of both spectra we conclude that the Balmer/4000Å-break is located in the range of the - and -bands. We thus manually define 10 bins in this wavelength region, which turn out to exhibit S/N ratios between 5.5 and 16 for the A1413-1 spectrum and between 13 and 32 for the MACS2129-1 spectrum. We then divide the -band wavelength region into two parts, one ranging from 1440nm to 1521nm with lower S/N, and one from 1521nm to 1798nm, where the S/N ratio reaches its highest values across the whole NIR wavelength range. Both of them are binned by an algorithm which sets the bin sizes such that they result in a certain S/N ratio. We thus bin the short wavelength region of the H-band with S/N per bin of 20 for the A1413-1 spectrum and 50 for MACS2129-1, and for the longer wavelength range of the -band we bin up to a S/N per bin of 35 for A1413-1 and 75 for MACS2129-1. For the -band wavelength range from 1970nm to 2300nm we again define bins manually: we exclude noisy regions (where absorption is high) and split the rest into 7 bins, with S/N ratios between 6 and 24 for A1413-1 and 22 and 49 for MACS2129-1. Wavelengths beyond the end of the -band at were excluded as the sky-subtraction here was not sufficiently good to allow robust measurements.
In addition to the SEDs constructed out of the NIR spectra, we add the above-mentioned HST photometry in the band for MACS2129-1 and in the and bands for A1413-1, in order to extend the SEDs of the two galaxies also to optical wavelengths.
3.1.3 Stellar population synthesis fits to the SEDs
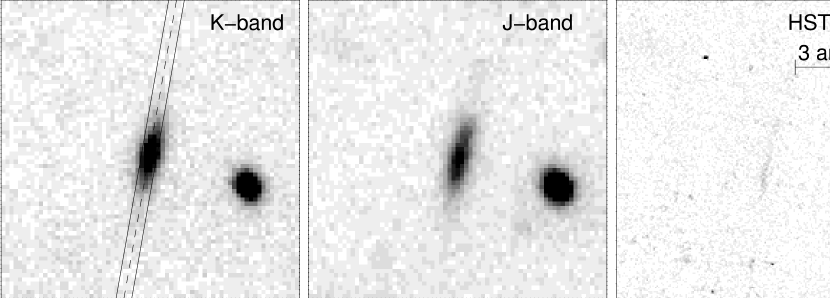
We use the multi-wavelength SEDs, described in section 3.1.2, to fit stellar population synthesis models, in order to determine photometric redshifts as well as stellar ages, masses, and dust extinctions from them. Given the limited SNR of the available spectra and the low significance of absorption lines, it is not possible to place robust constraints on the metallicities. We fit the data using the LePhare code (Arnouts et al., 1999; Ilbert et al., 2006) and galaxy models from Bruzual & Charlot (2003, BC03 hereafter), based on the Chabrier initial mass function (IMF) (Chabrier, 2003), and the Calzetti extinction law (Calzetti et al., 1994, 2000). The assumed star formation histories in the BC03 models follow an exponential declining rate, , with 9 different e-folding timescales , ranging from 0.1 Gyr to 30 Gyr. Furthermore, they come with three different metallicities, (solar value), and . LePhare is based on a template-fitting procedure (Arnouts et al., 1999, 2002), with an input grid comprising of the above-mentioned list of 27 BC03 models, a range of redshifts in steps , extinction coefficients , and a list of ages for the models. A library of theoretical magnitudes is built by redshifting each SED in steps of and convolving them with the transmission curves of the filters. In our case, these filters are those defined synthetically by the binning procedure described in Sec. 3.1.2. LePhare also takes into account the opacity of the inter-galactic medium as described in Madau (1995, see also ). After the determination of the value taken from the input grid which minimizes the merit function , the best fitting redshift is derived with a parabolic interpolation of the redshift probability distribution. Following Ilbert et al. (2006, 2009) the level errors obtained from the probability distribution function are a reliable estimate of the actual photo-z accuracy. In the computation of the library of theoretical galaxy magnitudes, we follow an iterative approach: we first adopt a wide-spaced grid covering a large range of input values to obtain first estimates on the (photometric) redshift, the range of possible stellar ages, and the extinction coefficient . With the help of those, we narrow down the range of redshifts, ages and values used in a second iteration of the LePhare fitting procedure, enabling us to use smaller steps and thus a finer input grid for and . The main motivation for this approach is the technical limitation of the libraries to a maximum of entries, i.e. the product of number of input BC03 models, extinction laws, and the numbers of entries on the grids of ages, steps and values. The finer sampling on the redshift grid allows us to reduce the systematics and obtain more detailed insights in the shape of the redshift probability distribution, especially about potential secondary or double peaks. The lower uncertainties in the redshift due to the finer redshift grid and the smaller steps in the used values allow us to obtain a more accurate estimation of the latter and thus result in more reliable constraints on the stellar ages. The best fit models for both galaxies are overplotted in Fig. 2 and Fig. 3, and the results for the derived physical parameters are summarized in Table 2. It has to be emphasized here that the stellar masses are subject to systematic uncertainties (which can easily exceed a factor of 2) which are not included in the quoted error budget but originate in the uncertainty on the initial mass function (IMF) which is not well constrained at high redshifts. It turns out that the input SEDs are best fit by the BC03 models with an e-folding timescale for star formation of 0.1 Gyr (A1413-1) and 0.3 Gyr (MACS2129-1), respectively. The model fit for A1413-1 indicates no on-going star formation (with an upper limit of ), and for MACS2129-1 the fit allows for a star formation rate of which according to the resulting specific star formation rate of means that MACS2129-1 can be regarded as a passively evolving galaxy. We emphasize that this value for star formation is solely based on the best-fit model with the assumption of an exponentially declining star formation rate. This approximation does most likely not represent reality (Anderson & Soto, 2012) and as a consequence the computed star formation rates should not be taken too literally. Given the non-detection of emission lines we conclude that the MACS2129-1 spectrum is still consistent with no ongoing star formation.

| Parameter | A1413-1 | MACS2129-1 |
|---|---|---|
| Age [Gyr] | ||
| [mag] | ||
| [mag] | ||
| [] | ||
| SFR [] | ||
| sSFR [] | ||
3.1.4 Nature of tentatively detected spectral lines
Guided by the photometric redshifts found above we now return to the issue of tentative absorption lines in the spectrum. As can be seen in Fig. 4 and Fig. 5 there are indications of very broad H absorption at the expected positions dictated by the photometric redshifts for both MACS2129-1 () and A1413. For MACS2129-1 there are also hints of absorption at the expected position of CaII + H. Based on the position of the tentative H lines we infer spectroscopic redshifts of and , which are fully consistent with the photometric redshifts. We defer further analysis of these tentative features (e.g. velocity dispersions) to a future study. To double-check the SED fitting performed in Sect. 3.1.3 we re-ran the same procedure, but this time with the redshifts fixed to the spectroscopic redshifts inferred from the H lines. The results from the new LePhare fits show no significant changes with respect to the results reported in Table 2.
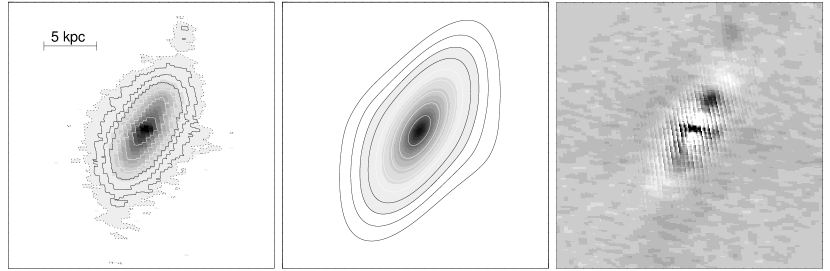
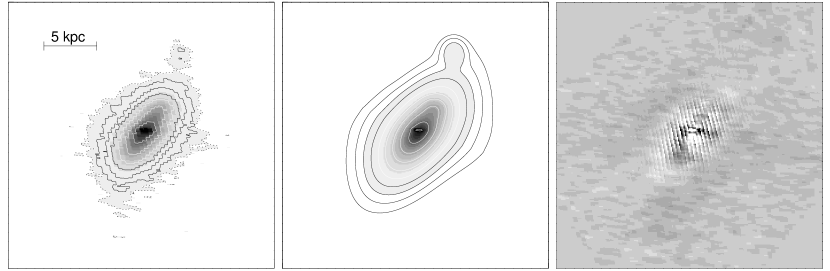
3.2 Profile fits to the de-lensed images
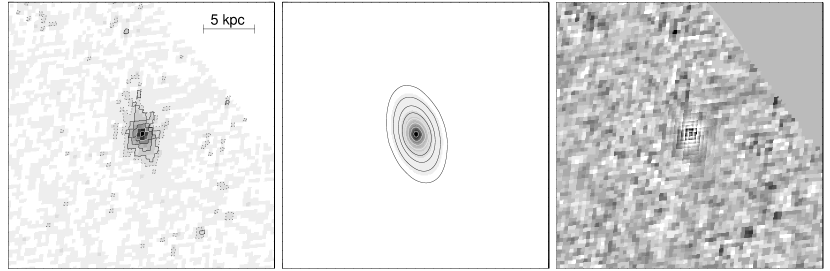
Of the two targets in this study, MACS2129-1 shows a clearly extended morphology, which is most prominent on the HST F160W image. We use this image to reconstruct the shape of the object in the source plane, based on the determined redshift. We show the resulting de-lensed image in Fig. 8. Similarly, we use the HST F850LP image of A1413 to reconstruct the unlensed image of A1413-1, which is shown in Fig. 7.
We use GALFIT version 3.0 (Peng et al., 2002; Peng, 2010) to fit a 2D Sersic model convolved with the reconstructed PSF, to the de-lensed F160W image of MACS2129-1, and to the F850LP image of A1413-1. The code is run on 100 Monte Carlo realizations of the reconstructions. In the case of MACS2129-1, three of the 100 realizations give highly deviant results with very high , which we subsequently discard. Uncertainties are computed as the standard deviation of all (remaining) results. The best-fit parameters (effective half-light radius , Sersic index , and axis ratio ) are then used to quantify the structure of the galaxies. We compute the circularized radii as . The Sersic index provides an indication whether the light profile resembles more an exponential disk profile () or an elliptical galaxy (). The results are summarized in Table 3 and visualized in Fig. 7 and Fig 8. As can be seen in the upper half of Fig. 8, the one-component Sersic fit to MACS2129-1 leaves two residuals, one in the core and one in the northern part of the galaxy. To account for these deviations from a simple Sersic profile, we produced a second fit, which models the two extra components with a psf, i.e. a point-source-like component. The lower half of Fig. 8 shows the residuals of this better fit. We note that the multi-component fit does not significantly alter the result for the Sersic index and effective radius of MACS2129-1.
We use the definition of Barro et al. (2012) of compactness (at )
| (8) |
to assess how compact the two galaxies in our study are. Here R corresponds to the circularized effective radius. It is thus confirmed that MACS2129-1 is indeed a compact galaxy according to that definition, with . The compactness of A1413-1 is computed as and thus also fulfills the criterion for compactness.
| Parameter | A1413-1 | MACS2129-1 |
|---|---|---|
| PA |
4 Discussion and conclusions
In this article we analyzed the spectra of two gravitationally-lensed distant compact quiescent galaxies and derived their redshifts, stellar masses and ages, as well as constraints on dust extinction and potential star formation, from SED fitting. We also analyzed their morphologies based on HST images which we de-lensed with available mass-models for the lensing clusters. Interpretations of the results are presented below.
4.1 Redshifts and derivation of intrinsic magnitudes
In the SED fitting procedure, the Balmer/4000Å-break is the feature which enables a reliable and robust determination of the redshifts of galaxies with evolved stellar populations. The resulting redshifts are for A1413-1 and for MACS2129-1. The respective error bars are taken from the confidence intervals of the best fits. To visualize where spectral lines are expected to be at these redshifts, we overplot their positions at those redshifts in Figures 4, 5, and 6. We also use the derived redshifts to determine the magnifications according to the available mass models for both clusters. The resulting lensing magnifications are for A1413-1 and for MACS2129-1 and thus lower than the initial estimations based on the assumption of . Adopting as the typical luminosity () of red galaxies at (Marchesini et al., 2007), the two galaxies in this study exhibit luminosities of (A1413-1) and (MACS2129-1). Their stellar masses correspond to and (Marchesini et al., 2009). The de-lensed magnitudes according to the lensing magnifications were used to scale the stellar masses and star formation rates of the SED fits.
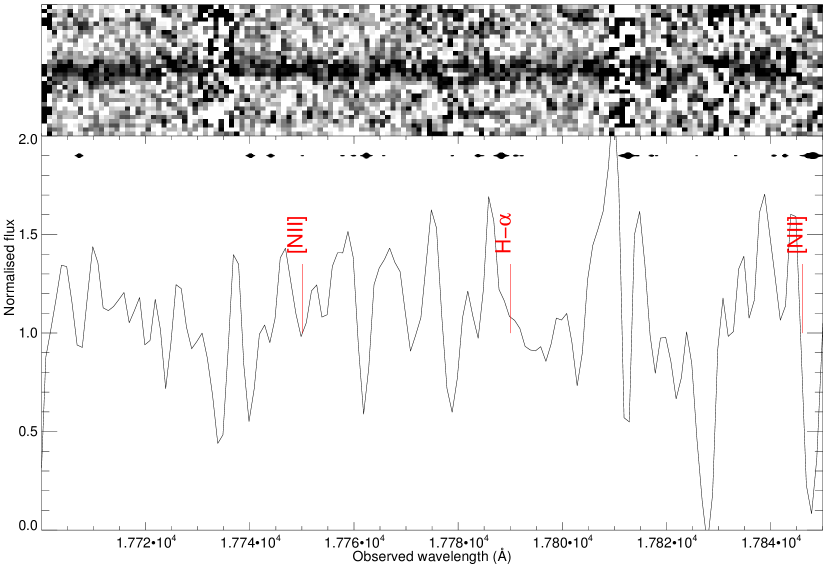
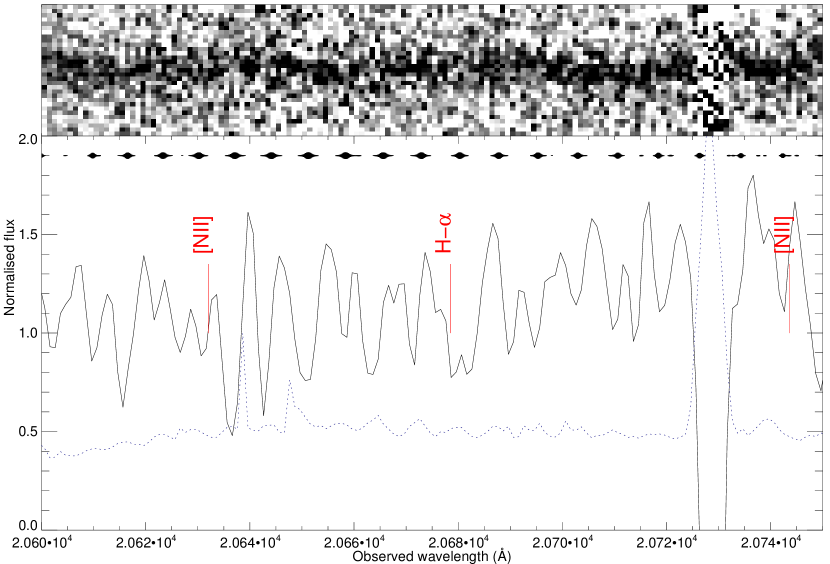
4.2 Constraints on line-fluxes and star formation
In Fig. 6 we demonstrate the non-detectability of potential emission by zooming in on the wavelength regions where is expected at the redshifts of the two galaxies. In both the 1D and 2D spectral cutouts it is clearly visible that there is no detectable emission line. In order to constrain the amount of star formation which might have been still on-going in the two galaxies, despite the lack of detectable emission lines, we determined upper limits on potential line emission in the spectra. For that purpose, we subtracted the continuum around the positions where we would expect the line at the respective redshifts and added artificial emission lines. In this way, we infer limits on line emission of and for A1413-1 and MACS2129-1, respectively. Converting into intrinsic potential luminosities (taking also the lensing magnification into account) and applying the Kennicutt (1998) relation, the upper limits on star formation rates in A1413-1 and MACS2129-1 turn out to be and , respectively. The Kennicutt relation is based on the assumption of a Salpeter (1955) IMF and solar metallicities. Converting to the assumed Chabrier IMF via division by a factor of 1.58 (Treyer et al., 2007), the upper limits are of the order of . These are the best limits on potentially on-going star-formation in quiescent galaxies so far, even compared to the most recent similar studies (Kriek et al., 2009; Onodera et al., 2010; van de Sande et al., 2011; Toft et al., 2012).
4.3 Stellar population properties
From SED modeling, we derived the ages of the stellar populations to be in the range of Gyr (A1413-1) and Gyr (MACS2129-1). This is an intriguing result, as they turn out to be older and thus exhibit higher mass-to-light ratios than most galaxies from other studies (Kriek et al., 2008, 2009; van Dokkum & Brammer, 2010; van de Sande et al., 2011; Toft et al., 2012; van de Sande et al., 2012). This is mostly due to the fact that younger galaxies are easier to detect. van de Sande et al. (2012) indeed argue that their sample is biased towards young galaxies, compared to a mass-limited sample. By scaling to the intrinsic luminosities, taking into account the enhancement of the observed brightness by the lensing effect, and including the uncertainty on the lensing magnification in quadrature into the error budget, we infer their stellar masses to be (A1413-1) and (MACS2129-1). This makes them two of the least (intrinsically) luminous quiescent high-z galaxies whose properties have been studied spectroscopically. As visualized in Fig. 9 this mass range has been probed before, which was however only possible with exorbitant use of telescope time ( for the GMASS sample). The lensing approach makes these studies much more feasible, and will in the future also give us the possibility to test the properties of larger samples of quiescent (and even ) galaxies, which are much more representative of the overall population than the brightest ones (see also van de Sande et al. (2012) for a more detailed discussion of this issue).
4.4 Morphologies
In section 3.2 we described the fitting of surface brightness profiles with the GALFIT tool, the results of which we summarize in Table 3. For A1413-1 we find a relatively high Sersic index of which resembles an early-type galaxy. The structural analysis of galaxy MACS2129-1 reveals a profile which is more disky than an exponential disk with . This shape classifies it as an S0 like galaxy. Only relatively recently it has been possible to identify disk-like galaxies around (e.g. Stockton et al., 2004, 2008; Genzel et al., 2006; van der Wel et al., 2011; Chang et al., 2013). Combined with the constraints on potentially on-going star formation it constitutes the first spectroscopically confirmed passive lenticular galaxy at .
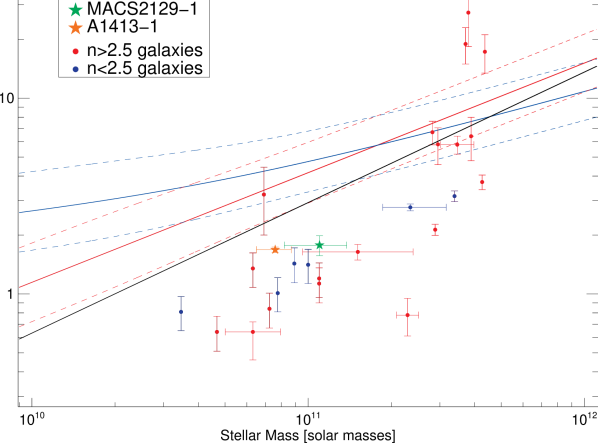
4.5 Stellar masses and sizes
In order to compare the stellar masses and sizes of the two galaxies in our study, we compile a sample of passive galaxies in the redshift range from the literature. All these studies used the Chabrier IMF (Chabrier, 2003) and thus provide some useful comparison of stellar masses, and estimate their (circularized) half-light radii via Sersic profile fits. The 24 galaxies in this comparison sample are taken from Toft et al. (2012), van de Sande et al. (2011), Kriek et al. (2009); van Dokkum et al. (2009), van Dokkum & Brammer (2010), Onodera et al. (2010), Muzzin et al. (2012), Mancini et al. (2010), and Cimatti et al. (2008). For comparison with the typical properties of galaxies in today’s Universe, in Fig. 9 we plot the local stellar mass-size-relations for early-type (red color) and late-type (blue color) galaxies from Shen et al. (2003), with their intrinsic scatter plotted in dashed lines. The same color scheme is used to divide the galaxy sample into early-type () and late-type () galaxies. The two galaxies from our study are plotted in green (MACS2129-1) and orange (A1413-1) colors. As found in previous studies, quiescent galaxies at are significantly more compact than galaxies in today’s local Universe. The compactness criterion of Barro et al. (2012) is indicated by the bold black line.
The intriguing diversity of quiescent galaxies at (see also Onodera et al., 2010) clearly indicates that the spectroscopic sample of quiescent galaxies needs to be extended significantly to establish a robust picture of their role in the formation and evolution of early-type galaxies at all redshifts.
.
4.6 Prospects for future detailed studies
An additional advantage of observing lensed high-redshift galaxies is the increased spatial resolution due to the gravitational lensing effect. For unlensed compact galaxies there is essentially no spatial information available in ground based observations, given the extreme compactness of these objects, (e.g. Toft et al., 2012). The additional spatial information is in particular striking for MACS2129-1 that is stretched along a caustic line resulting in an observed extension of almost . With a deeper observation using multiple slit positions it should be possible to determine both the dependence of the (line-of-sight) velocity dispersion on position within the galaxy as well as to establish if there is rotation of the overall system (Buitrago et al., 2013a). We point out that the lensing approach will greatly increase the feasibility of continuum and absorption line spectroscopy of faint, i.e. quiescent galaxies at high redshifts ().
We emphasize the interesting finding that MACS2129-1 exhibits a surface brightness profile which strongly resembles a disk galaxy, which corroborates the existence of a significant fraction of massive passive disks at . The question whether disk-like galaxies dominate the passive galaxy population at is still a highly-debated topic, with no firm conclusion at hand yet (e.g. van der Wel et al., 2011; Wuyts et al., 2011; Buitrago et al., 2013b).
In this current study, we have demonstrated that even in cases with limited S/N
it is possible to use the
continuum emission to derive useful constraints on important properties like
redshifts, stellar masses and ages as well as the resulting formation
redshifts. Subsequent studies of
larger samples of quiescent galaxies with intrinsic luminosities down
to will allow for statistically more robust insights into
relationships between (stellar) masses, sizes, morphologies, and formation
redshifts.
References
- Anderson & Soto (2012) Anderson, J. P., & Soto, M. 2012, ArXiv e-prints
- Arnouts et al. (1999) Arnouts, S., Cristiani, S., Moscardini, L., Matarrese, S., Lucchin, F., Fontana, A., & Giallongo, E. 1999, MNRAS, 310, 540
- Arnouts et al. (2002) Arnouts, S., et al. 2002, MNRAS, 329, 355
- Baldry et al. (2012) Baldry, I. K., et al. 2012, MNRAS, 421, 621
- Barro et al. (2012) Barro, G., et al. 2012, ArXiv e-prints
- Bell et al. (2003) Bell, E. F., McIntosh, D. H., Katz, N., & Weinberg, M. D. 2003, ApJS, 149, 289
- Bertin & Arnouts (1996) Bertin, E., & Arnouts, S. 1996, A&AS, 117, 393
- Bezanson et al. (2009) Bezanson, R., van Dokkum, P. G., Tal, T., Marchesini, D., Kriek, M., Franx, M., & Coppi, P. 2009, ApJ, 697, 1290
- Böhringer et al. (2000) Böhringer, H., et al. 2000, ApJS, 129, 435
- Bouwens et al. (2011) Bouwens, R. J., et al. 2011, Nature, 469, 504
- Bruzual & Charlot (2003) Bruzual, G., & Charlot, S. 2003, MNRAS, 344, 1000
- Buitrago et al. (2013a) Buitrago, F., Conselice, C. J., Epinat, B., Bedregal, A. G., & Grutzbauch, R. 2013a, ArXiv e-prints
- Buitrago et al. (2008) Buitrago, F., Trujillo, I., Conselice, C. J., Bouwens, R. J., Dickinson, M., & Yan, H. 2008, ApJ, 687, L61
- Buitrago et al. (2013b) Buitrago, F., Trujillo, I., Conselice, C. J., & Häußler, B. 2013b, MNRAS, 428, 1460
- Calzetti et al. (2000) Calzetti, D., Armus, L., Bohlin, R. C., Kinney, A. L., Koornneef, J., & Storchi-Bergmann, T. 2000, ApJ, 533, 682
- Calzetti et al. (1994) Calzetti, D., Kinney, A. L., & Storchi-Bergmann, T. 1994, ApJ, 429, 582
- Cameron et al. (2011) Cameron, E., Carollo, C. M., Oesch, P. A., Bouwens, R. J., Illingworth, G. D., Trenti, M., Labbé, I., & Magee, D. 2011, ApJ, 743, 146
- Campusano et al. (2001) Campusano, L. E., Pelló, R., Kneib, J.-P., Le Borgne, J.-F., Fort, B., Ellis, R., Mellier, Y., & Smail, I. 2001, A&A, 378, 394
- Cano-Díaz et al. (2012) Cano-Díaz, M., Maiolino, R., Marconi, A., Netzer, H., Shemmer, O., & Cresci, G. 2012, A&A, 537, L8
- Chabrier (2003) Chabrier, G. 2003, PASP, 115, 763
- Chang et al. (2013) Chang, Y.-Y., van der Wel, A., Rix, H.-W., Wuyts, S., Zibetti, S., Ramkumar, B., & Holden, B. 2013, ApJ, 762, 83
- Christensen et al. (2012a) Christensen, L., et al. 2012a, MNRAS, 427, 1973
- Christensen et al. (2012b) —. 2012b, MNRAS, 427, 1953
- Cimatti et al. (2008) Cimatti, A., et al. 2008, A&A, 482, 21
- Dickinson et al. (2003) Dickinson, M., Papovich, C., Ferguson, H. C., & Budavári, T. 2003, ApJ, 587, 25
- D’Odorico et al. (2006) D’Odorico, S., et al. 2006, in Society of Photo-Optical Instrumentation Engineers (SPIE) Conference Series, Vol. 6269, Society of Photo-Optical Instrumentation Engineers (SPIE) Conference Series
- Ebeling et al. (2007) Ebeling, H., Barrett, E., Donovan, D., Ma, C.-J., Edge, A. C., & van Speybroeck, L. 2007, ApJ, 661, L33
- Franx et al. (2003) Franx, M., et al. 2003, ApJ, 587, L79
- Fukugita et al. (1998) Fukugita, M., Hogan, C. J., & Peebles, P. J. E. 1998, ApJ, 503, 518
- Genzel et al. (2006) Genzel, R., et al. 2006, Nature, 442, 786
- Goldoni (2011) Goldoni, P. 2011, Astronomische Nachrichten, 332, 227
- Hempel et al. (2008) Hempel, A., Schaerer, D., Egami, E., Pelló, R., Wise, M., Richard, J., Le Borgne, J.-F., & Kneib, J.-P. 2008, A&A, 477, 55
- Hopkins (2004) Hopkins, A. M. 2004, ApJ, 615, 209
- Hopkins & Beacom (2006) Hopkins, A. M., & Beacom, J. F. 2006, ApJ, 651, 142
- Horne (1986) Horne, K. 1986, PASP, 98, 609
- Ilbert et al. (2006) Ilbert, O., et al. 2006, A&A, 457, 841
- Ilbert et al. (2009) —. 2009, ApJ, 690, 1236
- Juneau et al. (2005) Juneau, S., et al. 2005, ApJ, 619, L135
- Kennicutt (1998) Kennicutt, Jr., R. C. 1998, ARA&A, 36, 189
- Kodama et al. (2007) Kodama, T., Tanaka, I., Kajisawa, M., Kurk, J., Venemans, B., De Breuck, C., Vernet, J., & Lidman, C. 2007, MNRAS, 377, 1717
- Komatsu et al. (2011) Komatsu, E., et al. 2011, ApJS, 192, 18
- Kriek et al. (2009) Kriek, M., van Dokkum, P. G., Labbé, I., Franx, M., Illingworth, G. D., Marchesini, D., & Quadri, R. F. 2009, ApJ, 700, 221
- Kriek et al. (2008) Kriek, M., et al. 2008, ApJ, 677, 219
- Kurk et al. (2008) Kurk, J. D., et al. 2008, in Astronomical Society of the Pacific Conference Series, Vol. 381, Infrared Diagnostics of Galaxy Evolution, ed. R.-R. Chary, H. I. Teplitz, & K. Sheth, 303–+
- Labbé et al. (2010) Labbé, I., et al. 2010, ApJ, 716, L103
- Lemoine-Busserolle et al. (2003) Lemoine-Busserolle, M., Contini, T., Pelló, R., Le Borgne, J.-F., Kneib, J.-P., & Lidman, C. 2003, A&A, 397, 839
- Lilly et al. (1996) Lilly, S. J., Le Fevre, O., Hammer, F., & Crampton, D. 1996, ApJ, 460, L1
- Madau (1995) Madau, P. 1995, ApJ, 441, 18
- Madau et al. (1996) Madau, P., Ferguson, H. C., Dickinson, M. E., Giavalisco, M., Steidel, C. C., & Fruchter, A. 1996, MNRAS, 283, 1388
- Madau et al. (1998) Madau, P., Pozzetti, L., & Dickinson, M. 1998, ApJ, 498, 106
- Maizy et al. (2010) Maizy, A., Richard, J., de Leo, M. A., Pelló, R., & Kneib, J. P. 2010, A&A, 509, A105
- Mancini et al. (2010) Mancini, C., et al. 2010, MNRAS, 401, 933
- Mannucci et al. (2010) Mannucci, F., Cresci, G., Maiolino, R., Marconi, A., & Gnerucci, A. 2010, MNRAS, 408, 2115
- Marchesini et al. (2009) Marchesini, D., van Dokkum, P. G., Förster Schreiber, N. M., Franx, M., Labbé, I., & Wuyts, S. 2009, ApJ, 701, 1765
- Marchesini et al. (2007) Marchesini, D., et al. 2007, ApJ, 656, 42
- Modigliani et al. (2010) Modigliani, A., et al. 2010, in Society of Photo-Optical Instrumentation Engineers (SPIE) Conference Series, Vol. 7737, Society of Photo-Optical Instrumentation Engineers (SPIE) Conference Series
- Møller & Jakobsen (1990) Møller, P., & Jakobsen, P. 1990, A&A, 228, 299
- Muzzin et al. (2012) Muzzin, A., et al. 2012, ArXiv e-prints
- Naab et al. (2009) Naab, T., Johansson, P. H., & Ostriker, J. P. 2009, ApJ, 699, L178
- Newman et al. (2012) Newman, A. B., Ellis, R. S., Bundy, K., & Treu, T. 2012, ApJ, 746, 162
- Onodera et al. (2010) Onodera, M., et al. 2010, ApJ, 715, L6
- Oogi & Habe (2013) Oogi, T., & Habe, A. 2013, MNRAS, 428, 641
- Pelló et al. (1999) Pelló, R., Kneib, J.-P., Bolzonella, M., & Miralles, J. M. 1999, in Astronomical Society of the Pacific Conference Series, Vol. 191, Photometric Redshifts and the Detection of High Redshift Galaxies, ed. R. Weymann, L. Storrie-Lombardi, M. Sawicki, & R. Brunner, 241
- Pelló et al. (1998) Pelló, R., Kneib, J. P., & Bruzual, G. 1998, Ap&SS, 263, 55
- Pelló et al. (2007) Pelló, R., et al. 2007, Highlights of Astronomy, 14, 250
- Peng (2010) Peng, C. 2010, in Bulletin of the American Astronomical Society, Vol. 42, American Astronomical Society Meeting Abstracts #215, 229.09
- Peng et al. (2002) Peng, C. Y., Ho, L. C., Impey, C. D., & Rix, H.-W. 2002, AJ, 124, 266
- Richard et al. (2011) Richard, J., Jones, T., Ellis, R., Stark, D. P., Livermore, R., & Swinbank, M. 2011, MNRAS, 413, 643
- Richard et al. (2004) Richard, J., Pelló, R., Kneib, J.-P., Schaerer, D., Santos, M. R., & Ellis, R. 2004, in Astrophysics and Space Science Library, Vol. 301, Astrophysics and Space Science Library, ed. M. Plionis, 27
- Richard et al. (2006) Richard, J., Pelló, R., Schaerer, D., Le Borgne, J.-F., & Kneib, J.-P. 2006, A&A, 456, 861
- Richard et al. (2010) Richard, J., et al. 2010, MNRAS, 404, 325
- Salpeter (1955) Salpeter, E. E. 1955, ApJ, 121, 161
- Schaerer et al. (2007) Schaerer, D., et al. 2007, A&A, 469, 47
- Schlegel et al. (1998) Schlegel, D. J., Finkbeiner, D. P., & Davis, M. 1998, ApJ, 500, 525
- Shen et al. (2003) Shen, S., Mo, H. J., White, S. D. M., Blanton, M. R., Kauffmann, G., Voges, W., Brinkmann, J., & Csabai, I. 2003, MNRAS, 343, 978
- Skrutskie et al. (2006) Skrutskie, M. F., et al. 2006, AJ, 131, 1163
- Steidel et al. (2003) Steidel, C. C., Adelberger, K. L., Shapley, A. E., Pettini, M., Dickinson, M., & Giavalisco, M. 2003, ApJ, 592, 728
- Stockton et al. (2004) Stockton, A., Canalizo, G., & Maihara, T. 2004, ApJ, 605, 37
- Stockton et al. (2005) Stockton, A., McGrath, E., & Canalizo, G. 2005, in Bulletin of the American Astronomical Society, Vol. 37, American Astronomical Society Meeting Abstracts, 1293
- Stockton et al. (2008) Stockton, A., McGrath, E., Canalizo, G., Iye, M., & Maihara, T. 2008, ApJ, 672, 146
- Taylor et al. (2010) Taylor, E. N., Franx, M., Glazebrook, K., Brinchmann, J., van der Wel, A., & van Dokkum, P. G. 2010, ApJ, 720, 723
- Toft et al. (2009) Toft, S., Franx, M., van Dokkum, P., Förster Schreiber, N. M., Labbe, I., Wuyts, S., & Marchesini, D. 2009, ApJ, 705, 255
- Toft et al. (2012) Toft, S., Gallazzi, A., Zirm, A., Wold, M., Zibetti, S., Grillo, C., & Man, A. 2012, ApJ, 754, 3
- Toft et al. (2007) Toft, S., et al. 2007, ApJ, 671, 285
- Treyer et al. (2007) Treyer, M., et al. 2007, ApJS, 173, 256
- Trujillo et al. (2009) Trujillo, I., Cenarro, A. J., de Lorenzo-Cáceres, A., Vazdekis, A., de la Rosa, I. G., & Cava, A. 2009, ApJ, 692, L118
- Trujillo et al. (2006a) Trujillo, I., et al. 2006a, MNRAS, 373, L36
- Trujillo et al. (2006b) —. 2006b, ApJ, 650, 18
- van de Sande et al. (2011) van de Sande, J., et al. 2011, ApJ, 736, L9
- van de Sande et al. (2012) —. 2012, ArXiv e-prints
- van der Wel et al. (2011) van der Wel, A., et al. 2011, ApJ, 730, 38
- van Dokkum & Brammer (2010) van Dokkum, P. G., & Brammer, G. 2010, ApJ, 718, L73
- van Dokkum et al. (2009) van Dokkum, P. G., Kriek, M., & Franx, M. 2009, Nature, 460, 717
- van Dokkum et al. (2003) van Dokkum, P. G., et al. 2003, ApJ, 587, L83
- van Dokkum et al. (2010) —. 2010, ApJ, 709, 1018
- Wilson et al. (2003) Wilson, J. C., et al. 2003, in Society of Photo-Optical Instrumentation Engineers (SPIE) Conference Series, Vol. 4841, Society of Photo-Optical Instrumentation Engineers (SPIE) Conference Series, ed. M. Iye & A. F. M. Moorwood, 451–458
- Wuyts et al. (2011) Wuyts, S., et al. 2011, ApJ, 742, 96
- Zirm et al. (2007) Zirm, A. W., et al. 2007, ApJ, 656, 66
- Zirm et al. (2008) —. 2008, ApJ, 680, 224
| Facility | Filter/ | |||||
|---|---|---|---|---|---|---|
| HST/ACS | F775W | - | - | 24.25 | 0.05 | 24.85 |
| HST/ACS | F850LP | - | - | 23.25 | 0.05 | 23.85 |
| XSH/NIR | 1044.09 | 1025.0 | 1055.0 | 22.634 | 0.216 | 23.234 |
| XSH/NIR | 1068.59 | 1055.0 | 1085.0 | 22.306 | 0.147 | 22.906 |
| XSH/NIR | 1098.27 | 1085.0 | 1113.0 | 21.992 | 0.103 | 22.592 |
| XSH/NIR | 1164.83 | 1136.0 | 1190.0 | 21.885 | 0.073 | 22.485 |
| XSH/NIR | 1207.11 | 1190.0 | 1225.0 | 21.735 | 0.073 | 22.335 |
| XSH/NIR | 1238.78 | 1225.0 | 1250.0 | 21.651 | 0.068 | 22.251 |
| WIRC | J | - | - | 21.93 | 0.12 | 22.53 |
| XSH/NIR | 1259.32 | 1250.0 | 1275.0 | 21.611 | 0.087 | 22.211 |
| XSH/NIR | 1286.26 | 1275.0 | 1295.0 | 21.485 | 0.091 | 22.085 |
| XSH/NIR | 1305.40 | 1295.0 | 1315.0 | 21.548 | 0.069 | 22.148 |
| XSH/NIR | 1324.02 | 1315.0 | 1335.0 | 21.612 | 0.079 | 22.212 |
| XSH/NIR | 1456.64 | 1440.0 | 1474.3 | 21.347 | 0.056 | 21.947 |
| XSH/NIR | 1488.54 | 1474.4 | 1498.5 | 21.185 | 0.056 | 21.785 |
| XSH/NIR | 1511.31 | 1498.6 | 1521.0 | 21.185 | 0.059 | 21.785 |
| XSH/NIR | 1541.88 | 1521.0 | 1562.2 | 21.084 | 0.031 | 21.684 |
| XSH/NIR | 1587.96 | 1562.3 | 1609.7 | 21.079 | 0.031 | 21.679 |
| XSH/NIR | 1627.22 | 1609.8 | 1645.0 | 21.001 | 0.031 | 21.601 |
| XSH/NIR | 1661.47 | 1645.1 | 1679.3 | 21.038 | 0.031 | 21.638 |
| XSH/NIR | 1692.84 | 1679.4 | 1708.6 | 21.011 | 0.031 | 21.611 |
| XSH/NIR | 1722.86 | 1708.7 | 1737.1 | 20.922 | 0.031 | 21.522 |
| XSH/NIR | 1751.04 | 1737.2 | 1763.7 | 20.964 | 0.031 | 21.564 |
| XSH/NIR | 1781.63 | 1763.8 | 1798.0 | 20.955 | 0.035 | 21.555 |
| XSH/NIR | 1984.47 | 1971.0 | 1995.0 | 20.928 | 0.052 | 21.528 |
| XSH/NIR | 2035.02 | 2021.0 | 2048.0 | 20.733 | 0.046 | 21.333 |
| XSH/NIR | 2081.69 | 2058.0 | 2100.0 | 20.710 | 0.050 | 21.310 |
| XSH/NIR | 2130.80 | 2112.0 | 2149.0 | 20.656 | 0.048 | 21.256 |
| WIRC | Ks (2147.40) | - | - | 20.839 | 0.064 | 21.439 |
| XSH/NIR | 2179.26 | 2151.0 | 2211.0 | 20.692 | 0.050 | 21.292 |
| XSH/NIR | 2232.73 | 2212.0 | 2260.0 | 20.693 | 0.078 | 21.293 |
| XSH/NIR | 2287.43 | 2275.0 | 2300.0 | 21.006 | 0.186 | 21.606 |
| Facility | Filter/ | |||||
|---|---|---|---|---|---|---|
| HST/ACS | F606W | - | - | 23.7 | 0.3 | 25.21 |
| HST/WFC3 | F105W | - | - | 22.14 | 0.15 | 23.65 |
| XSH/NIR | 1064.01 | 1025.0 | 1095.0 | 22.108 | 0.087 | 23.618 |
| HST/WFC3 | F110W | - | - | 21.36 | 0.10 | 22.87 |
| XSH/NIR | 1130.41 | 1095.0 | 1165.0 | 21.889 | 0.078 | 23.399 |
| XSH/NIR | 1190.63 | 1165.0 | 1215.0 | 21.319 | 0.046 | 22.829 |
| HST/WFC3 | F125W | - | - | 20.90 | 0.09 | 22.41 |
| XSH/NIR | 1228.36 | 1215.0 | 1240.0 | 20.977 | 0.045 | 22.487 |
| XSH/NIR | 1249.32 | 1240.0 | 1260.0 | 20.973 | 0.044 | 22.483 |
| ISAAC | J (1250.5) | - | - | 20.914 | 22.424 | |
| XSH/NIR | 1276.50 | 1260.0 | 1290.0 | 20.709 | 0.043 | 22.219 |
| XSH/NIR | 1298.29 | 1290.0 | 1305.0 | 20.727 | 0.044 | 22.237 |
| XSH/NIR | 1312.77 | 1305.0 | 1320.0 | 20.596 | 0.034 | 22.106 |
| XSH/NIR | 1327.19 | 1320.0 | 1335.0 | 20.593 | 0.041 | 22.103 |
| HST/WFC3 | F140W | - | - | 20.33 | 0.06 | 21.84 |
| XSH/NIR | 1457.87 | 1440.0 | 1476.3 | 20.328 | 0.022 | 21.838 |
| XSH/NIR | 1492.49 | 1476.4 | 1504.4 | 20.262 | 0.022 | 21.772 |
| XSH/NIR | 1514.68 | 1504.5 | 1521.0 | 20.245 | 0.028 | 21.755 |
| XSH/NIR | 1544.03 | 1521.0 | 1566.8 | 20.259 | 0.015 | 21.769 |
| XSH/NIR | 1588.99 | 1566.9 | 1608.2 | 20.115 | 0.015 | 21.625 |
| HST/WFC3 | F160W | - | - | 20.16 | 0.07 | 21.626 |
| XSH/NIR | 1626.76 | 1608.3 | 1646.4 | 20.170 | 0.015 | 21.680 |
| XSH/NIR | 1660.86 | 1646.5 | 1677.7 | 20.082 | 0.015 | 21.592 |
| XSH/NIR | 1688.87 | 1677.8 | 1702.2 | 20.059 | 0.015 | 21.569 |
| XSH/NIR | 1717.68 | 1702.3 | 1733.6 | 20.041 | 0.015 | 21.551 |
| XSH/NIR | 1746.74 | 1733.7 | 1758.4 | 19.965 | 0.015 | 21.475 |
| XSH/NIR | 1775.39 | 1758.5 | 1794.4 | 19.973 | 0.015 | 21.483 |
| XSH/NIR | 1984.37 | 1971.0 | 1995.0 | 19.860 | 0.023 | 21.370 |
| XSH/NIR | 2034.97 | 2021.0 | 2048.0 | 19.779 | 0.022 | 21.289 |
| XSH/NIR | 2081.61 | 2058.0 | 2100.0 | 19.658 | 0.022 | 21.168 |
| XSH/NIR | 2130.72 | 2112.0 | 2149.0 | 19.708 | 0.024 | 21.218 |
| ISAAC | Ks (2165.2) | - | - | 19.704 | 0.01 | 21.214 |
| XSH/NIR | 2179.10 | 2151.0 | 2211.0 | 19.712 | 0.024 | 21.222 |
| XSH/NIR | 2232.38 | 2212.0 | 2260.0 | 19.751 | 0.039 | 21.261 |
| XSH/NIR | 2287.42 | 2275.0 | 2300.0 | 19.443 | 0.049 | 20.953 |