Evolution of the gas kinematics of galaxies in cosmological simulations
Abstract
We studied the evolution of the gas kinematics of galaxies by performing hydrodynamical simulations in a cosmological scenario. We paid special attention to the origin of the scatter of the Tully-Fisher relation and the features which could be associated with mergers and interactions. We extended the study by De Rossi et al. (2010) and analysed their whole simulated sample which includes both, gas disc-dominated and spheroid-dominated systems. We found that mergers and interactions can affect the rotation curves directly or indirectly inducing a scatter in the Tully-Fisher Relation larger than the simulated evolution since . In agreement with previous works, kinematical indicators which combine the rotation velocity and dispersion velocity in their definitions lead to a tighter relation. In addition, when we estimated the rotation velocity at the maximum of the rotation curve, we obtained the best proxy for the potential well regardless of morphology.
PRESENTACIÓN ORAL
(1) Instituto de Astronomía y Física del Espacio (CONICET-UBA)
(2) Consejo Nacional de Investigaciones Científicas y Técnicas, CONICET, Argentina (derossi@iafe.uba.ar)
(3) Facultad de Ciencias Exactas y Naturales, Universidad de Buenos Aires, Ciudad Autónoma de Buenos Aires, Argentina
Resumen. Estudiamos la evolución de la cinemática del gas en galaxias realizando simulaciones hidrodinámicas en un escenario cosmológico. Prestamos especial atención al origen del scatter de la relación de Tully-Fisher y los rasgos que podrían ser asociados a fusiones e interacciones. Extendimos el estudio de De Rossi et al. (2010) y analizamos su muestra simulada completa, la cual incluye tanto sistemas dominados por discos como esferoides de gas. Encontramos que las fusiones e interacciones pueden afectar las curvas de rotación directa o indirectamente induciendo un scatter en la relación de Tully-Fisher mayor que la evolución simulada desde . En acuerdo con trabajos previos, los indicadores cinemáticos que combinan la velocidad de rotación y la velocidad de dispersión en sus definiciones conducen a una relación más estrecha. Más aún, cuando estimamos la velocidad de rotación en el máximo de la curva de rotación, obtenemos el mejor sustituto para el pozo de potencial independientemente de la morfología.
1. Introduction
Recent observational and theoretical works have suggested that the Tully-Fisher relation (TFR) can be generalized to include dispersion dominated galaxies (e.g. Weiner et al. 2006; Kassin et al. 2007; Covington et al. 2010; Vergani et al. 2012). In this context, a new kinematical indicator () which combines the rotation () and dispersion velocity () is used:
| (1) |
where is a constant . In particular, Kassin et al. (2007) found that the use of leads to a unified correlation between mass and velocity for galaxies of all morphological types in their sample, which included merging and distubed systems. By performing pre-prepared merger simulations, Covington et al. (2010) also reported a reduction in the scatter of the TFR when using . These authors claimed that the scatter in the TFR is closely related with mergers and interactions.
In this work, we used cosmological simulations to study the kinematics of surviving gaseous discs in galaxies of all morphological types. We derived the simulated TFR and determined which kinematical indicator is the best proxy for the potential well in these simulations.
2. Numerical simulations and galaxy sample
We performed numerical simulations consistent with the concordance -CDM universe with , a normalisation of the power spectrum of and km s with . These simulations were performed by using the chemical code GADGET-3 (Scannapieco et al. 2008), which includes treatments for metal-dependent radiative cooling, stochastic star formation, chemical enrichment and supernovae feedback. The simulated volume corresponds to a cubic box of a comoving 10 Mpc side length. The masses of dark matter and initial gas-phase particles are and , respectively.
For each simulated galaxy, we determined the gas-phase rotation curve and measured the rotation, dispersion and circular velocity at different radii. In particular, we determined the radius () where the rotation velocity is maximum and defined this velocity as . Unless otherwise specified, all simulated properties were calculated inside the baryonic radius (), defined as the one which encloses 83% of the baryonic mass of a galactic system. A detailed description of this analysis and more information about these simulations can be found in De Rossi et al. (2010, 2012).
3. Results and discussion
As shown in De Rossi et al. (2010, 2012), these simulations predict a tight TFR for disc galaxies that is in very good agreement with recent observations (e.g. Reyes et al. 2011). However, when including dispersion dominated systems, the scatter in the TFR tends to increase with maximum velocity variations in the range [0.4, 0.5] dex. Hence, the scatter becomes larger than the mean velocity evolution since ( dex). Consistently with previous works, the analysis of the merger trees of simulated systems indicates that this scatter is mainly caused by mergers and interactions which drive turbulent and disordered motions of gas and also lead to other processes as star formation, gas infall and outflows. These mergers and interactions alter the morphologies of the remnant galaxies and strongly infuence the evolutionary tracks of the systems along the TFR-plane. In particular, De Rossi et al. (2012) found that the tracks given by and can significantly depart during merger events. In this context, it is worth analysing if there is a kinematical indicator which can be considered a good proxy for the potential well regadless of the galaxy morphology and, in that case, if this kinematical indicator can generate a tighter and unified TFR for galaxies of all morphology types, as it was reported in previous works.
In Fig. 1, we can appreciate (diamonds) as a function of the gas-fraction in the spheroidal component () of simulated galaxies and at different radii: (solid blue lines), (dotted pink lines) and (black dashed lines). The curves represent the mean relations while the vertical lines correspond to the standard deviations. We also show with triangles the mean relations obtained when estimating (left panel) and (right panel) at (dotted pink lines) and (black dashed lines).
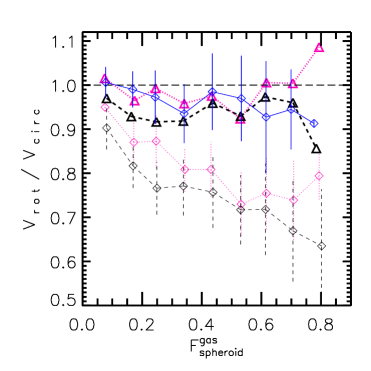
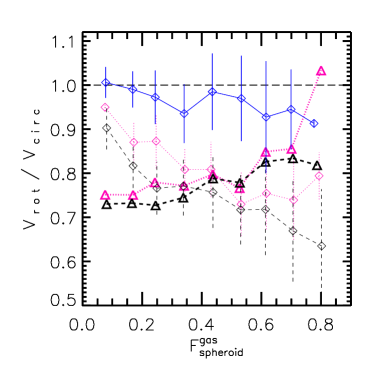
It is clear from the left panel of Fig. 1 that, when the disc dominates the gas-phase (i.e. ), and are good proxies for the circular velocity. On the other hand, for gas-spheroid-dominated systems, is a good proxy for the potential well only if estimated at the maximum of the rotation curve. At larger radii ([]), tends to understimate , on average. However, when combining and in the definition of the kinematical indicator , a good tracer for the potential well is obtained at large radii, in agreement with previous works. It is worth noting that in these simulations the best proxy for at large radii is , while is used more frequently in the literature. We verified that can reduce the scatter of the simulated TFR but as shown in the right panel of Fig. 1, tends to underestimate . This issue is discussed in detail in De Rossi et al. (2012).
4. Conclusions
We analysed the gas kinematics of galaxies in a -CDM cosmology by using hydrodynamical simulations. We obtained a TFR in good agreement with observational works when using only disc-like systems. However, when including dispersion-dominated galaxies, the scatter of the TFR significantly increases. We found that this scatter is strongly related with galaxy interactions and merger events that can significantly disturbed the rotation curve of simulated systems, specially at large radii. Our simulations predict that this scatter can be reduced by combining and in the definition of the kinematical indicator. In particular, we obtained that does not only reduce the scatter but also seems to be a good tracer of the potential well for all morphological types, at least in these simulations. In the inner part of simulated galaxies, we found that the best proxy for is the maximum rotation velocity , regardless of morphology.
More details about this work can be found in De Rossi et al. (2012).
Acknowledgments.
We thank the anonymous referee for his/her useful comments that helped to improve this article. We acknowledge support from the PICT 32342 (2005), PICT 245-Max Planck (2006) of ANCyT (Argentina), PIP 2009-112-200901-00305 of CONICET (Argentina) and the L’oreal-Unesco-Conicet 2010 Prize. Simulations were run in Fenix and HOPE clusters at IAFE.
References
Covington, M. D., et al. 2010, ApJ, 710, 279
de Rossi, M. E., Tissera, P. B., & Pedrosa, S. E. 2010, A&A, 519, A89
De Rossi, M. E., Tissera, P. B., & Pedrosa, S. E. 2012, A&A, 546, A52
Kassin, S. A., et al. 2007, ApJ, 660, L35
Reyes, R., Mandelbaum, R., Gunn, J. E., Pizagno, J., & Lackner, C. N. 2011, MNRAS, 417, 2347
Scannapieco, C., Tissera, P. B., White, S. D. M., & Springel, V. 2008, MNRAS, 389, 1137
Tully, R. B., & Fisher, J. R. 1977, A&A, 54, 661
Vergani, D., Epinat, B., Contini, T., et al. 2012, A&A, 546, A118
Weiner, B. J., et al. 2006, ApJ, 653, 1027