Pressure-induced softening as a common feature of framework structures that have negative thermal expansion
Abstract
Results of a series of molecular dynamics simulations of cubic siliceous zeolites suggest that pressure-induced softening – the phenomenon in which a material becomes progressively more compressible under pressure – is likely to be a common feature of framework materials that show negative thermal expansion. The correlation between the negative thermal expansion and the pressure-induced softening is investigated on the basis of thermodynamics.
pacs:
62.20.-x, 65.40.De, 64.30.-tI Introduction
Almost all materials become stiffer when compressed, as a result of the constituent atoms being squeezed together. It therefore comes as something of a shock that some materials – among them amorphous silica Tsiok 1998 , ZrW2O8 Pantea 2006 and Zn(CN)2 Chapman 2007 – actually become softer under compression. Formally, the stiffness is defined through the zero-pressure bulk modulus , and the change in stiffness is defined through the differential , which is a positive quantity for almost all materials. However, in these cited examples it is found that has a negative value. There is as yet no theoretical explanation for this effect, which can be called “pressure-induced softening”, but in a simulation study of pressure-induced softening in amorphous silica Walker 2007 we drew attention to the role of fluctuations involving whole-body rotations of SiO4 tetrahedra. Given that the same fluctuations are implicated in the similarly counter-intuitive phenomenon of negative thermal expansion (NTE) Lind 2012 , and given that the few materials in which pressure-induced softening has been identified also show NTE, we suggest that most NTE materials will show pressure-induced softening, and in this paper we demonstrate the plausibility of this hypothesis.
The basis for linking pressure-induced softening with negative thermal expansion can be understood by considering the relatively simple example of Zn(CN)2.Goodwin 2005 Its perfect structure has linear Zn–C–N–Zn linkages of bonds along the crystallographic directions. Uniform compression of the perfect structure will force compression of these bonds, which are stiff and will become stiffer on further compression. Hence at a temperature of 0 K, or in a static lattice energy calculation, we might expect to find a positive value of . However, on heating thermal fluctuations will cause instantaneous buckling of the Zn–C–N–Zn linkages – a process aided by the fact that the rigid-unit-mode flexibility of the structure allows for localised distortions Goodwin2006 – so that an external compressive force can be accommodated with relatively low energy cost by further buckling without the need to compress the individual bonds. If we now consider the case of stretching the structure (application of negative pressure), the stretch will first be accommodated by reducing the buckling of the linkages of bonds, but when the buckling has been stretched out the second process is to stretch the individual bonds. This will cost a lot more energy, and the volume change per unit of stretch force will reduce. This means that the bulk modulus will increase on stretching, and hence we have a negative value of .
Because the fluctuations that buckle the linkages give rise to a reduction in crystal volume in many framework, and because their amplitude increases with temperature, we have the possibility – perhaps in some cases inevitability – for negative thermal expansion. Thus we might expect pressure-induced softening to be linked to NTE. Put another way, we might expect that many NTE materials will also show pressure-induced softening. In the case of Zn(CN)2, experimentally it is found to have large NTE, and a negative value of , i.e. pressure-induced softening.Chapman 2007 Our recent simulation study of Zn(CN)2 our_MD is consistent with the experimental data our_Exp and shows that has a dependence on temperature of the form described above.
In this paper we test the proposal of a direct link between NTE and pressure-induced softening by performing simulation experiments on the full suite of zeolites with cubic lattice symmetry zeolite_note . Zeolites are low-density framework structures built from corner-linked SiO4 tetrahedra, many of which are found naturally with ionic substitution on the tetrahedral site (e.g. Al for Si) with associated charge-balancing cations (e.g. Na) found in the large pores in the structure. It has long been recognised that some zeolites show NTE Miller 2009 ; Lightfoot 2001 , although there has not yet been a systematic study of the set of the cubic zeolites. Here we make two predictions, first that most cubic zeolites will show NTE, and second, based on the preceding discussion, that those that do have NTE will also show pressure-induced softening. This is much easier tested by molecular dynamics simulation than experiment, and for siliceous zeolites we have some good force fields derived from quantum mechanical calculations and tested in many independent studies. There are 13 candidate zeolites with crystal structures of cubic symmetry and fully connected SiO4 tetrahedra, all of which are investigated in the current work. For reference for the rest of this paper, we note that all zeolites are assigned a three-letter namezeolite_note , sometimes which relates to a historical name (e.g. ANA for analcime, FAU for faujisite).
The thermodynamic theory to link NTE with pressure-induced softening is derived in Section II. Section III gives the computational method and Section IV presents the main results. Conclusions are drawn in Section V.
II Thermodynamic Background
The Helmholtz free energy of an insulating crystal Ashcroft 1976 in the classical high-temperature approximation is written as
| (1) |
where the first term on the right-hand side is the lattice energy of the crystal at zero temperature. The second term involves the sum over all wave vectors k on all branches of the phonon dispersion curves , with as the frequency of each phonon mode denoted by . is the temperature in the unit of energy.
At equilibrium, the pressure is obtained as the derivative of the free energy with respect to the crystal volume :
| (2) |
The overall Grüneisen parameter is defined as the sum over all the mode Grüneisen parameters :
| (3) |
with as the total number of atoms in the system. The bulk modulus of the material can be calculated using
| (4) |
where we have used
| (5) |
Thus,
| (6) |
From Equation 6, we can obtain the first derivative of the bulk modulus with respect to pressure as
| (7) |
In Equation 7, we have used the approximation
| (8) |
which is generally valid for the zeolites we have studied here, as will be seen in Table 2 in Section V. According to this, from Equation 6, one has
| (9) |
Accordingly, we can rewrite Equation 7 in the more compact form
| (10) |
where the first term on the right-hand side, namely
| (11) |
is the value of at zero temperature obtained in a harmonic-lattice-dynamics calculation. In our case, we will calculate this term for all the cubic NTE zeolites in harmonic lattice dynamics using a force field with the Buckingham potential.
Thus, according to Equation 10, if is positive, given that all the rest terms are negative, may become negative when the temperature is high enough. In fact, since NTE materials have negative coefficient of thermal expansion, one should have
| (12) |
and we will see in Section V, that for all the cubic NTE zeolites,
| (13) |
Note that, if , and are in the same order of magnitude, the term containing will contribute dominantly to a negative due to its large coefficient involving the bulk modulus .
III Computational Methods
The molecular dynamics (MD) simulations were carried out using DLPOLY Todorov 2006 . The O–O, Si–O and Si–Si interactions are described by Coulomb interactions and Buckingham potentials of the form
| (14) |
where is the distance between two atoms of type and , and the parameters , and for each atom pair type are taken from the force field of TsuneyukiTsuneyuki 1988 . The point charges on theSi and O atoms are (in the units of electron charge) and respectively. The long-range Coulomb energy was calculated using the Ewald method with precision of 10-4. Typical simulations, lasting around 30 ps in the production stage with a 10 ps equilibration stage, were performed using time steps of ps and the velocity Verlet scheme William 1982 . Long-time stability of the structures at high temperature were tested up to 200 ps. Simulations were performed using the Nosé–Hoover constant-pressure constant-temperature ensemble Hoover 1985 , with relaxation times of ps for both thermostat and barostat. The first suite of simulations were performed at constant pressure to search for NTE, followed by a large number of simulations over a range of pressure at a fixed temperature for a large number of different temperature values. Typical sample sizes were unit cells.
The calculations of the density of states and the Grüneisen parameters for the studied zeolites were carried out in harmonic lattice dynamics using GULP Gale 1997 . The same potential model as in the MD was used in these calculations.
IV Results
IV.1 Search for negative thermal expansion in cubic zeolites
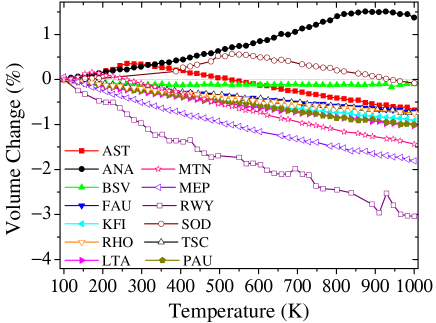
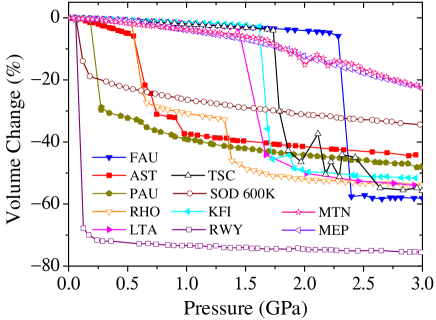
Figure 1 shows the simulated volume–temperature relationships at ambient pressure for all cubic zeolites. Only ANA has positive thermal expansion throughout the temperature range. BSV shows almost zero thermal expansion. The other 11 zeolites have NTE. Three of these undergo phase transitions, and it is their high-temperature phases that show NTE. Figure 2 shows the simulated volume–pressure relationships at a temperature of 300 K. Inevitably most examples show a pressure-induced phase transition. RWY, SOD and PAU undergo phase transitions at very low pressure ( GPa). Thus, from the original pool of 13 zeolites we have 8 useful candidate materials where the transition pressure is not too low and in which we can explore the link between pressure-induced softening and NTE. The key results from these preliminary temperature and pressure scans are summarised in Table 1.
We found that almost all the modes with negative Grüneisen parameters are rigid unit modes (RUMs) in these cubic zeolites. Calculations using the CRUSH code Giddy 1993 ; Hammonds 1994 reveal that these RUMs correspond to the rotations and the translations of the SiO4 tetrahedra, with the translational modes occupy the lowest energy band. The big difference between the positive-thermal-expansion ANA and other NTE cubic zeolites is that the low-frequency translational RUMs of ANA do not have large negative Grüneisen parameters, while the medium and high-frequency non-RUMs in ANA have relatively large positive Grüneisen parameters. The low-frequency translational RUMs contribute the most to the NTE of the material, which is similar to the finding in our work on Zn(CN)2 our_MD . Detailed discussions of the origins of NTE of these cubic zeolites will be given elsewhere prepare .
IV.2 Pressure-induced softening in NTE-zeolites
From sequences of pressure-sweep simulations over a range of fixed temperatures we have obtained values of , and by fitting isothermal data using the equation of states (EoS). We have explored several EoS formalisms EoSreview , including 3rd and 4th-order Birch-Murnaghan (BM) EoS, Vinet (Universal) EoS, and Keane EoS. It was found that the 3rd and 4th-order BM EoSs have the greater stability. The Vinet and Keans EoSs gave similar results to those of the BM EoS. The 3rd-order BM gave excellent results for most of the studied zeolites, but significant improvements were obtained using the 4th-order BM for AST and MTN SI . The fitted values of and at 300 K are given in Table 1.
| Zeolite | (MK-1) | (K) | (GPa) | ||
| AST | 250 | 0.5 | 16(2) | 666The fitted values of of AST and MTN using the 4th-order BM EoS are 108(7) and 37(4), respectively SI . | |
| FAU | 111Experimental value Attfield 1998 averaged over 25-573 K is MK-1. | – | 2.2 | 51.1(2)444Experimental value is (2) GPa Colligan 2004 . | |
| KFI | – | 1.6 | 65.7(5) | ||
| RHO | 222Averaged value Tschaufeser 1995 over 0-500 K calculated from lattice dynamics in quasi-harmonic approximation is MK-1. | – | 0.5 | 59(1) | |
| LTA | – | 1.5 | 61.8(6)555DFT calculated value is GPa Astala 2004 . | ||
| MTN | 333Experiment shows that MTN goes through a phase transition at about 370 K and only its high temperature phase shows NTE. The experimental value Park 1997 averaged over 463-1002 K is (0.7) MK-1. | 200 | 1.5 | 27(1) | 666The fitted values of of AST and MTN using the 4th-order BM EoS are 108(7) and 37(4), respectively SI . |
| MEP | – | 0.6 | 58(2) | ||
| TSC | – | 1.75 | |||
| RWY | – | – | – | ||
| SOD | 600 | – | – | ||
| PAU | – | – | – | ||
| BSV | – | – | 56.2(4) | ||
| ANA | 19.7 | 800 | 1.2 | 10.3(3) | 0.3(3) |
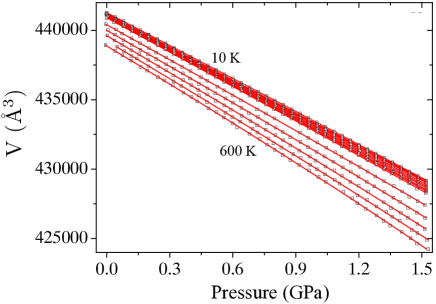
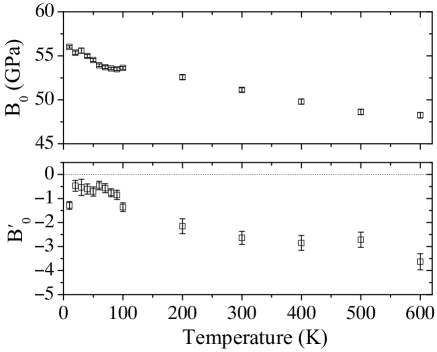
As an example, Figure 3 shows the fitting to isotherms of FAU at different temperatures using the 3rd-order BM EoS. Figure 4 shows the temperature-dependence of the fitted and values. In this case, the fitted value of is negative at all temperatures; in Figure 3 a convex-parabola trend seen in the isotherms shows that the volume contracts more rapidly at higher pressure, and this gives the negative value of . In this regard, a 3rd-order BM EoS was adequate to describe this trend in the isotherm. Plots of the fitted isotherms, equilibrium volume , and for all the systems are given in the supplemental material SI .
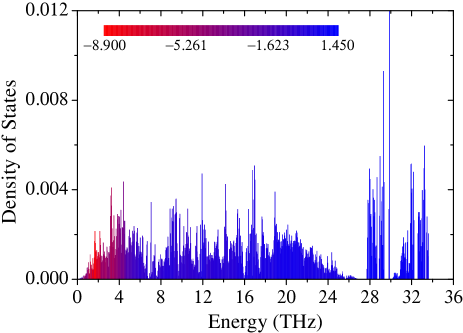
In principle, at low temperature the values of and measured experimentally may differ from those obtained from a classical MD simulation due to quantum effects. However, we note that much of the important flexibility in NTE materials comes from vibrational modes having low frequencies, and these modes contribute the most to NTE through their large negative Grüneisen parameters our_MD . Taking the example of FAU, we have obtained the set of mode Grüneisen parameters from the phonon frequencies calculated using expanded and contracted (0.1) unit-cell volumes, and have colored the vibrational density of states according to the value of Grüneisen parameter, as shown in figure 5 (plots of the other NTE zeolites are available in SI ). It is clear that modes with the most negative Grüneisen parameters — highlighted by red to light violet — are around 1 THz (48 K) and span to the lowest frequency. This suggests that even at low temperature K, these modes will not be ‘frozen’ out and can still be excited and contribute to NTE and pressure-induced softening of the material. In such a case, the classical MD results at low temperature would not have too much difference from the real quantum picture.
As shown in Table 1, all the cubic zeolites that have NTE and are stable under compression show pressure-induced softening (negative ). It is interesting to note that BSV having almost zero thermal expansion shows almost zero , and ANA with positive coefficient of thermal expansion shows positive .
To show the consistency between the theory in Section II and the MD results, we calculate using Equation 10 and give the values of various terms in Table 2. The values of were obtained from the phonon frequencies calculated using expanded and contracted unit-cell volumes at zero pressure. The term was calculated as for a small around zero pressure. Combined with the values of , one can see the validity of Equation 8. The volume variation for the calculation of at each pressure is much smaller relative to the volume reduction at that pressure. is calculated as for small pressures . As we mentioned in Section II, since this term has a coefficient of , it will contribute the most to the negative in Equation 10.
The values in the last two columns of Table 2 show a reasonable degree of consistency. The main differences between the two is mainly due to the anharmonic processes that are missing in the calculations of , and using harmonic lattice dynamics.
| Zeolite | (GPa) | (GPa-1) | (GPa-2) | 111Calculated using Equation 10. | 222MD results at 300 K. | ||
|---|---|---|---|---|---|---|---|
| FAU | |||||||
| KFI | |||||||
| RHO | |||||||
| LTA | |||||||
| MEP | |||||||
| TSC |
IV.3 Correlation between the pressure-induced softening and NTE
Negative values of , and can be satisfied by assuming a pressure-induced strain () dependence for the frequency of the NTE modes, namely
| (15) |
where and are positive constants. Clearly, the frequency of the mode will decrease with more negative strain , i.e. the mode will be softened on compression hence having negative Grüneisen parameter
| (16) |
From Equation 16, we have
| (17) |
and
| (18) |
Thus, a material with whose mode frequency is reasonably represent by Equation 15 will show NTE with negative as well as negative , and therefore is likely to have negative on heating according to Equation 10.
One way in which pressure, elasticity and thermal fluctuations are linked is in the pressure-dependence of the coefficient of thermal expansion, , as shown by
| (19) |
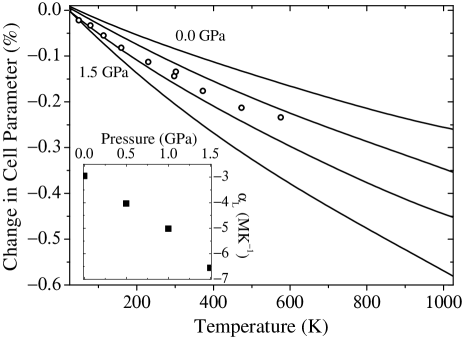
For all the NTE zeolites (whose ) listed in Table 2 , both terms on the right-hand side of the equation would be positive, resulting in negative , i.e. the coefficient of thermal expansion becomes more negative under pressure. This pressure-enhancement of NTE has been confirmed by our MD results. For example, Figure 6 shows both the simulation and the experimental data for FAU. Plots of this kind for the other zeolites are given in the supplemental material SI .
V Conclusions
The main conclusion from this study is that all the cubic zeolites that show NTE and are stable under pressure have negative . This is a result from simulations and will need experimental verification, but the results are so overwhelmingly positive from simulation that we are confident they reflect the underlying physical processes. This lends strong support to our proposal that many NTE materials are likely to have pressure-induced softening.
The origin of the pressure-induced softening is rooted in the dependence of the frequencies of the NTE phonon modes on strain. With a simple form of frequency having positive dependence on pressure-induced strain, the phonon modes would not only have negative Grüneisen parameters but also have negative first and second derivatives of the Grüneisen parameter with respect to pressure, resulting in NTE as well as pressure-induced softening of the material.
With an increasing number of NTE materials being discovered, we suggest that there should be an increased focus on experimental searches for pressure-induced softening in these materials.
Acknowledgements.
We gratefully acknowledge financial support from the CISS of Cambridge Overseas Trust (HF). MD simulations were performed using the CamGrid high-throughput environment of the University of Cambridge.References
- (1) O. B. Tsiok, V. V. Brazhkin, A. G. Lyapin, and L. G. Khvostantsev, Phys. Rev. Lett. 80, 999 (1998).
- (2) C. Pantea, A. Migliori, P. B. Littlewood, Y. Zhao, H. Ledbetter, J. C. Lashley, T. Kimura, J. Van Duijn, and G. R. Kowach, Phys. Rev. B 73, 214118 (2006).
- (3) K. W. Chapman and P. J. Chupas, J. Am. Chem. Soc. 129, 10090 (2007).
- (4) A. M. Walker, L. A. Sullivan, K. Trachenko, R. P. Bruin, T. O. H. White, M. T. Dove, R. P. Tyer, I. T. Todorov, S. A. Wells, J. Phys.: Condens. Matter 19, 275210 (2007).
- (5) C. Lind, Materials 5, 1125 (2012).
- (6) A. L. Goodwin and C. J. Kepert, Phys. Rev. B 71, R140301 (2005).
- (7) A. L. Goodwin, Phys. Rev. B 74, 134302 (2006).
- (8) H. Fang, M. T. Dove, L. H. N. Rimmer, and A. J. Misquitta arXiv:1304.4789[cond-mat.mtrl-sci] (2013).
- (9) H. Fang, A. E. Phillips, M. T. Dove, M. G. Tucker, and A. L. Goodwin arXiv:1306.1909[cond-mat.mtrl-sci] (2013).
- (10) Detail information of these zeolites including the name and structure can be found at the on-line database: http://www.iza-structure.org/databases/.
- (11) W. Miller, C. W. Smith, D. S. Mackenzie, K. E. Evans, J. Mater. Sci. 44, 5441 (2009).
- (12) P. Lightfoot, D. A. Woodcock, M. J. Maple, L. A. Villaescusa, and P. A. Wright, J. Mater. Chem. 11, 212 (2001).
- (13) Neil W. Ashcroft and N. David Mermin, Solid State Physics, Brooks/Cole, a part of Cengage Learning, 1976.
- (14) I. T. Todorov, W. Smith, K. Trachenko, and M. T. Dove, J. Mater. Chem. 16, 1611 (2006).
- (15) S. Tsuneyuki, M. Tsukada, H. Aoki, and Y. Matsui, Phys. Rev. Lett. 61, 869 (1988).
- (16) William C. Swope, Hans C. Andersen, Peter H. Berens, and Kent R. Wilson, J. Chem. Phys. 76, 637 (1982).
- (17) W. G. Hoover, Phys. Rev. A 31, 1695-1697 (1985).
- (18) J. D. Gale, J. Chem. Soc., Faraday Trans. 93, 629 (1997).
- (19) A. P. Giddy, M. T. Dove, G. S. Pawley, and V. Heine, Acta Crystallographica A 49, 697703 (1993).
- (20) K. D. Hammonds, M. T. Dove, A. P. Giddy, and V.Heine, American Mineralogist 79, 1207 (1994).
- (21) Paper in preparation.
- (22) M. P. Attfield and A. W. Sleight, Chem. Commun. 5, 601 (1998).
- (23) P. Tschaufeser and S. C. Parker, J. Phys. Chem. 99, 10609 (1995).
- (24) S. H. Park, R. W. G. Kuntsleve, H. Graetsch, and H. Gies, Stud. Surf. Science Catal. 105, 1989 (1997).
- (25) M. Colligan, P. M. Forster, A. K. Cheetham, Y. Lee, T. Vogt, and J. A. Hriljac, J. Am. Chem. Soc. 126, 12015 (2004).
- (26) R. Astala, S. M. Auerbach, and P. A. Monson, J. Phys. Chem. B 108, 9208 (2004).
- (27) Supplemental Material.
- (28) P. B. Roy and S. B. Roy, J. Phys.: Condens. Matter 17, 6193 (2005).