Confronting Models of Dwarf Galaxy Quenching
with Observations of the Local Group
Abstract
A number of mechanisms have been proposed to connect star-forming dwarf irregular galaxies with the formation of non-star-forming dwarf spheroidal galaxies, but distinguishing between these mechanisms has been difficult. We use the Via Lactea dark matter only cosmological simulations to test two well-motivated simple hypotheses—transformation of irregulars into dwarf spheroidal galaxies by tidal stirring and ram pressure stripping following a close passage to the host galaxy, and transformation via mergers between dwarfs—and predict the radial distribution and inferred formation times of the resulting dwarf spheroidal galaxies. We compare this to the observed distribution in the Local Group and show that 1) the observed dSph distribution far from the Galaxy or M31 can be matched by the VL halos that have passed near the host galaxy at least once, though significant halo-to-halo scatter exists, 2) models that require two or more pericenter passages for dSph-formation cannot account for the dSphs beyond 500 kpc such as Cetus and Tucana, and 3) mergers predict a flat radial distribution of dSphs and cannot account for the high dSph fraction near the Galaxy, but are not ruled out at large distances. The models also suggest that for dSphs found today beyond 500 kpc, mergers tend to occur significantly earlier than dwarf–host encounters, thus leading to a potentially observable difference in stellar populations. We argue that tidal interactions are sufficient to reproduce the observed distribution of dSphs if and only if a single pericenter passage is sufficient to form a dSph.
Subject headings:
galaxies: dwarf — Local Group — galaxies: evolution1. Introduction
The origin of the approximate dichotomy between the star-forming dwarf irregular galaxies (dIrrs) and the non-star-forming, pressure supported dwarf spheroidal galaxies (dSphs) has long been an open question (Hodge & Michie, 1969; Faber & Lin, 1983; Kormendy, 1985; Gallagher & Wyse, 1994). Several mechanisms have been proposed to create dSphs, such as tidal stirring and stripping (Mayer et al., 2001; Klimentowski et al., 2009; Kazantzidis et al., 2011a; Kravtsov et al., 2004), resonant stripping (D’Onghia et al., 2009), or ram pressure stripping (Mayer et al., 2006). This broad grouping of models all involve the influence of a large host galaxy, which is motivated by the observed trend in the Local Group for most dSphs to be found within 200-300 kpc of either the Milky Way or M31 (van den Bergh, 1994; Grebel et al., 2003). Other theories for dSph formation do not require the influence of a larger galaxy and transform dIrrs into dSphs via either heating of the dwarfs’ cold gas by the UV background (Gnedin, 2000), strong feedback (Dekel & Silk, 1986; Mac Low & Ferrara, 1999; Gnedin & Zhao, 2002; Sawala et al., 2010), or mergers between dwarfs at early times (Kazantzidis et al., 2011b).
Since many of these mechanisms can all be shown to plausibly produce dSphs given the right initial conditions, it can become difficult to distinguish between these theories as many leave only weak signatures on the individual galaxies. Because of this limitation, one might alternatively study the signatures these processes leave on the population of Local Group dwarfs as a whole. The orbital and assembly histories of the dwarfs in the Local Group vary significantly, and the link between these histories and the resulting morphologies of the dwarfs may be a telling indication of which processes are at work. This perspective aims for differentiating between mechanisms for dSph formation where they are most different—where and when they act—rather than where they are all generally similar in the injection of energy into the orbits of stars in the dwarf.
In this work we use cosmological simulations (Via Lactea I & II, Diemand et al., 2007, 2008, herein VL1 and VL2) to trace the histories of the dwarfs that survive to today, and use these histories to infer which dwarfs (in aggregate) may have been affected either by tidal stirring or by mergers between dwarfs. The large difference in when and where these mechanisms act on dwarfs creates significant differentiation in the resulting distribution of dSphs. These two cases are also particularly suitable for study with high resolution dark-matter-only simulations, since the behavior of the luminous components can be inferred from the behavior of the dark matter. That is, we can infer the effects of tidal forces or mergers experienced by a galaxy by tracking the dark matter halo and applying relatively simple criteria based only on the halo properties. These criteria are physically motivated based on controlled simulations of the individual processes (e.g., Kazantzidis et al., 2011b, 2013). Clearly these simulations will predict some detailed properties of the dwarfs that will not be captured by our binary dSph-or-not criteria, but our focus on the bulk properties of the dwarf population as a whole will minimize the impact of these differences on our conclusions. These simplifications enable us to understand the formation of dSph galaxies in a broader cosmological context rather than only in controlled experiments.
Much of this work focuses on the dwarfs currently outside the virial radius of the Galaxy (or M31). The distribution of distant satellites that were once found inside the virial radius of a host has been investigated before in simulations of cluster or group environments (Balogh et al., 2000; Moore et al., 2004; Gill et al., 2005; Wetzel et al., 2013) and Milky Way-like environments (Diemand et al., 2007; Teyssier et al., 2012). The existence of such galaxies is well established. Similarly, the rate and timing of mergers between dwarfs in a Milky Way-like environment has been studied with simulations (Klimentowski et al., 2010), but comparisons to observations have remained limited. Our work focuses on bringing both of these mechanisms for the formation of dSphs to a specific comparison with the observed distribution of Local Group dwarfs.
Towards that goal, we discuss the simulations and our criteria for both interactions and major mergers in Section 2, and present the results and a comparison to the observed dSph distribution in the Local Group in Section 3. The distribution of times at which galaxies either merge or experience close passages is described in Section 4, and we discuss the implications of these results in Section 5.
2. Analysis of Simulations
We use both the Via Lactea simulation (Diemand et al., 2007) and Via Lactea II111http://www.physik.uzh.ch/~diemand/vl/ (Diemand et al., 2008) for our analysis of tidal interactions, and only the VL2 simulation for our analysis of mergers. Both are cosmological, dark matter only simulations centered on a Milky Way-sized halo with a virial mass of in VL2 ( in VL1), corresponding to a virial radius () of kpc ( kpc in VL1). VL1 used particles of mass , while VL2 had particles each of mass . Both simulations are entirely sufficient to resolve all of the luminous observable satellites, and we will generally restrict our results to halos with a maximum circular velocity () greater than 5 km/s at . At this limit halos have an average of 350 particles in VL1 and 800 particles in VL2. Dark matter halos were identified in the simulation using a phase-space friends-of-friends (6DFOF) algorithm, as described in detail in Diemand et al. (2006). These halos were then linked across snapshots by identifying halos which share significant numbers of particles; in identifying the most massive progenitor at least 50% of the particles in the descendant are required to be present in the progenitor, and conversely 50% of the progenitor particles to be present in the descendent. This constraint is later relaxed when computing merger trees, but the process is similar. Note that 6DFOF only links the central, low energy particles together; that is, the fraction of common particles between the progenitor and the descendant is usually significantly larger among the 6DFOF particles than among all particles within the virial radius.
In addition to the Milky Way-analog halo (referred to as the “main” halo for convenience), in VL2 there is also a second large galaxy present in the simulations that happens to have properties similar to Andromeda. This was identified in Teyssier et al. (2012), who refer to it as “Halo 2” and showed that it has a total gravitationally-bound mass of , and lies kpc from the main halo. Both of these properties are conveniently similar to Andromeda, and as a result, when we discuss the interaction between dwarf galaxy-sized halos and a massive host, we consider either the main halo or Halo 2 to be sufficient for this purpose. Ignoring Halo 2 would significantly bias our results, since dwarf galaxy halos that become bound to it may experience substantial tidal interactions while their distance from the main halo is still large. Treating both large halos on an equal footing also reflects our treatment of the observed Local Group dwarfs, where we consider the dwarfs’ distance to either the Milky Way or Andromeda, whichever is less. VL1 has no such analogous component, so we do not apply the same conditions.
2.1. Tidal Interactions
With the evolutionary tracks of halos in place, we can identify halos that are strong candidates to have undergone some form of interaction with a larger galaxy. This process is similar to that of Teyssier et al. (2012) but not identical. Of the several thousand most massive halos identified at , we select only those with values between and km/s. This cut conservatively ensures that the halos we track are well resolved, and broadly spans the values of classical dwarf galaxies. The position of the halo’s most massive progenitor is then tracked back through each snapshot, and both it and the position of the two host halos are linearly interpolated between snapshots. The pericenter distance and the number of pericenter passages between the halo and either host is then recorded. While interpolation between timesteps is not ideal, it does provide some assurance that we are not substantially overestimating the minimum radius of each pericenter passage by only taking the distance at individual snapshots. We have verified that this interpolation produces accurate results for VL2 (where the larger timesteps make it more important) by using the more densely sampled Via Lactea 1 simulation, downsampling the timesteps to the VL2 resolution and testing the interpolation. The results show the interpolation works particularly well for the distant halos we focus on here as most of them are on strongly radial, fly-by trajectories.
The distance between the halo and either of the hosts is then compared to the virial radius (, defined to enclose a density 200 times the cosmic mean density) of the main galaxy as a function of redshift, and the minimum of this ratio is found. This establishes the depth to which the halo has reached in a large galaxy. We assume the virial radius of Halo 2 is the same as that of the main halo, and we later show that our results are not particularly sensitive to the exact radius criterion. We also track the number of pericentric passages the halos have undergone inside of of the host halo by finding minima in the halo-host distance. The resulting halo statistics are in good agreement with those obtained by Teyssier et al. (2012); out of all selected halos, a very large majority (96%) have at some point been inside of half the host virial radius, and approximately 11% of those that have been inside this radius are later found at outside of virial radius.
We note that our model relies on the assumption that the halos in the simulations are populated with observable dwarf galaxies in an unbiased way. This assumption is potentially called into question by the “missing satellites problem”, which may suggest that the number of subhalos in simulations is substantially larger than the number of dwarf galaxies in the Local Group (Moore et al., 1999; Klypin et al., 1999). For example, in VL1 and VL2 we include 9992 and 2224 halos, respectively, in our analysis, but only 101 observed dwarfs (from the catalog of McConnachie, 2012). This discrepancy can be plausibly resolved within the cold dark matter framework by a combination of observational incompleteness and supression of star formation in small halos, thus decreasing their luminosity below detectability in current surveys (Somerville, 2002; Koposov et al., 2009), or by (additionally) destroying or diminishing the mass of halos through tidal stripping (Kravtsov et al., 2004; Brooks et al., 2013). Our use of ratios of number counts of halos limits our sensitivity to models that alter the mapping between halos and dwarfs based only on their mass, since the motion of the halos through the group environment remains unchanged. The selective destruction of halos by tidal stripping has the potential to decrease the fraction of dSphs at large radii, but as we argue below the dominant uncertainty at large radii is variation between halo realizations, and thus we do not impose a more complex tidal destruction criteria. We discuss tidal destruction further in the conclusions.
2.2. Merger Trees
The fraction of galaxies that have experienced major mergers is calculated from the same sample and uses the same method of linking halos at each snapshot to their possible progenitors. However, in the merger trees the selection requirement for the number of dark matter particles shared between halos is relaxed, since we are interested in all progenitor halos and not only the most massive progenitor. Starting at , we traverse the merger tree following the most massive progenitor at each step, until locating a halo that has two progenitors in a dark matter mass ratio or greater. The timestep where the two halos are identified as a single 6DFOF halo is noted as the merger time.
Visual inspection of the merger trees suggests that this simple criteria is effective in identifying whether a halo has merged or not, even though the merger process may be more complex in detail. Halos can often undergo close passages, which can cause particles to be lost from the halos by tidal stripping and thus alter the mass ratio we measure at the final coalescence of the 6DFOF halos. Other halos undergo passages that temporarily appear as one 6DFOF group in a snapshot, even though they will later separate and re-coalesce in subsequent snapshots. Because we track the time of the most recent merger snapshot, in these cases our merger times will tend to reflect this final coalescence rather than initial passes. We are also limited by only tracing the dark matter; we cannot say when the baryonic components of these galaxies will merge. In general we expect that when the dark matter halos merge, the baryons must follow, but this should be delayed by the time required for dynamical friction to bring the baryonic components together. We present a simple calculation of the dynamical friction timescale in Section 5 and find that it is of order 200 Myr or less, which is much smaller than the offset in formation times between the merger model and the tidal processing model.
Our ability to resolve mergers at very high redshifts is also limited. Beyond (11.3 Gyr ago), halos are poorly linked in time and mergers may not be properly resolved while they undergo an initial phase of rapid assembly. We consequently do not track mergers before . Since there is significant merger activity near these redshifts, we note that total fraction of dwarfs that have undergone mergers could be sensitive to the exact cut-off we select, and consequently we focus primarily on the distribution of merged dwarfs rather than their absolute fraction. As we will show, the shape of the radial distribution is unaffected by varying this high redshift cut-off.
3. Comparison to Observations
We compare these simple models to the observed set of Local Group dwarf galaxies, using the catalog assembled by McConnachie (2012), which includes all of the known galaxies within 3 Mpc of the Sun. The catalog labels galaxies with as dwarfs by convention, and though this cutoff is somewhat arbitrary, we use the same criterion here. This excludes, for example, M32 and the Large Magellanic Cloud, but includes the Small Magellanic Cloud. The catalog provides both galactocentric and M31-centric distances, and also classifies galaxies as either dSphs, dIrrs, or an intermediate “dSph/dIrr” class. Most of these classifications are uncontroversial. The dSph/dIrr class contains most of the galaxies for which either observational uncertainty or peculiar combinations of properties makes it difficult to definitively call them either a dSph or a dIrr. Since it is beyond the scope of this work to reconsider the classification of each of these galaxies, we treat the classification of McConnachie (2012) as authoritative. We account for the uncertainity in the dSph/dIrr class by evaluating two scenarios: one where all of these galaxies are treated as dSphs, and one where they are all treated as dIrrs. The range of values produced by these two cases yields some estimate of the uncertainty from classification. We make only two updates to the classifications of McConnachie (2012) based on more recent works: the galaxy Andromeda XXVIII has been confirmed to be a dSph (Slater et al., in prep), as has the galaxy KKR 25 (Makarov et al., 2012). It is important to note that the set of known dwarfs is not complete, and there may be underlying observational biases in the catalog. In this work we do not attempt to correct for biases in the selection function. We make the assumption that dSphs and dIrrs are equally likely to be detected, and thus the relative fraction of these two types is independent of the selection function. Inside of roughly 800 kpc this condition in general is met, since both dSphs and dIrrs can be detected by their red giant branch stars in the available large surveys (e.g., Irwin et al., 2007; Slater et al., 2011). Outside of this range dIrrs may be preferentially detected, since their young stars can be brighter than the tip of the red giant branch in dSphs. We remain mindful of this potential bias when interpreting the observations, but do not believe it affects our results. Our conclusions are necessarily more cautious at very large radii.
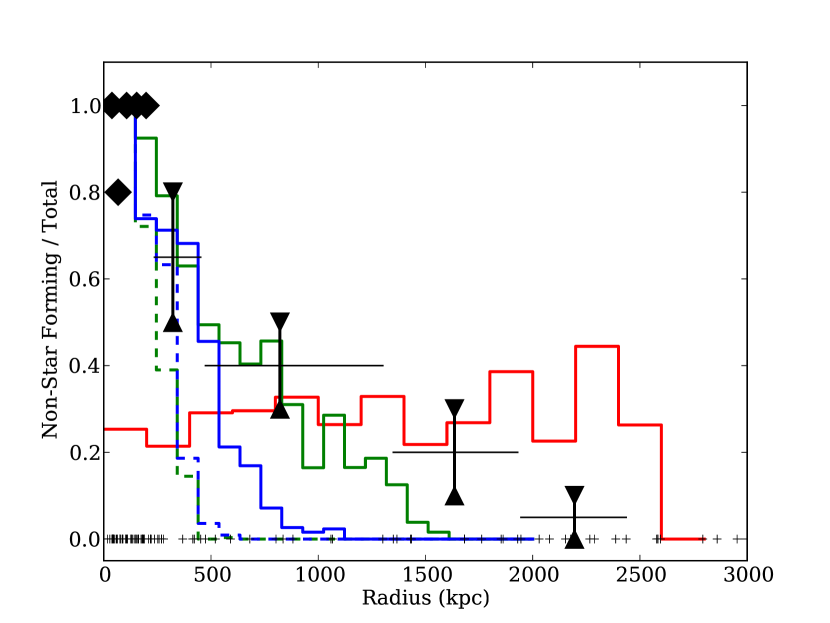
For each dwarf we compute the minimum of either its Galactocentric or its M31-centric distance, since we are not concerned with which galaxy the dwarfs may have interacted with. The dwarfs are then binned into groups of ten, and the fraction of dSphs in each bin is plotted as the black symbols in Figure 1 at the mean radius of its constituent dwarfs. This fixed-number rather than fixed-width binning scheme is used to compensate for the large dynamic range in the number of dwarf galaxies as a function of radius. For each bin, we evaluate the non-star forming fraction with the intermediate dSph/dIrr type galaxies included as dSphs (upper triangles) and as dIrrs (lower triangles), and the two points are connected by the vertical black lines. Bins with no transition galaxies appear as diamonds. The range of radius values spanned by each grouping of ten dwarfs is shown by the black horizontal lines on each point.
In Figure 1, the red line shows the radial distribution of Via Lactea II halos that have had a major merger since . This distribution is clearly flat, and does not exhibit the rise in non-star forming dwarfs inside of 1 Mpc as is seen in the Local Group. This radial dependence alone suggests that mergers cannot be the only channel for dSph formation.
Also in Figure 1, the fraction of satellite halos from the simulations that have passed inside of is shown by the solid blue line for VL1 and the green line for VL2. (For VL2 this also uses the minimum distance between a halo at and either the main host halo or Halo 2.) This is a simple proxy for the dwarfs that could have undergone transformation by a tidal interaction.
The radial profile in VL2 agrees quite well with the distribution of observed dSphs, with a gradual decline in non-star-forming fraction from 400 to 1500 kpc. This illustrates that tidal processes can plausibly reproduce the observed set of dSphs. However, the VL1 profile falls off much more rapidly, with very few tidally processed halos found beyond 800 kpc. The difference between the VL1 and VL2 results suggests that the predicted radial profile of dSphs in this model is clearly not a smooth, universal function. There is a large stochastic component that is evident even with only two realizations of a Local Group-like environment, which produces variations in the dSph profile beyond what would be expected from just Poisson noise. This variation comes from the accretion of subgroups of halos, which follow similar trajectories and introduce correlations in the fraction of processed halos. The accretion of discrete subgroups has been seen in other simulations, such as Li & Helmi (2008) and Klimentowski et al. (2010), and we include a more detailed illustration of this effect in Section 3.1. With only two realizations we are unable to quantify this effect beyond showing the two simulations as illustrating the possible magnitude of variations.
The confirmed dSph KKR 25 at 1.9 Mpc is the most significant outlier from the agreement between the observations and the simulations. Though this discrepancy could result from our two simulations failing to span the entire range of possible outcomes, it is also possible that our simple criteria for forming dSphs is imprecise and a more lenient criteria could account for KKR 25. With these caveats it is difficult to convincingly argue that tidal processing cannot account for KKR 25, but it is an interesting test case that could be suggestive of merger activity. As discussed above, the normalization on the fraction of merged dwarfs is somewhat sensitive to the details of the merger criteria, primarily the upper redshift cutoff and the mass ratio of merger required. While this sensitivity and the limitations of Poisson noise limit our ability to draw conclusions about whether the two furthest bins are compatible with any merger-based dSph formation, the figure does show the range of radii over which the two formation scenarios could be active.
The dashed blue and green lines in Figure 1 take the same tidal processing criteria as the solid lines, but adds an additional constraint that the halo must experienced more than one pericentric passage inside of . This is slightly less restrictive in distance than the single pass criterion, since multiple weaker tidal interactions could replace a single strong interaction. As shown in the figure, the fraction of halos in either simulation with two or more passages drops steeply outside of 300 kpc, and is essentially zero beyond 500 kpc. This agrees with the results of a simple orbital timescale calculation at these radii, which shows that the single orbits require a significant fraction of a Hubble time. Performing this test in a cosmological simulation accounts for more complicated factors such as the growth the main halo and the initial positions and velocities of the halos that are today found at these radii. The result of the simulation clearly shows that dwarfs such as Cetus, Tucana, and KKR 25 could not have made multiple close passages by a large galaxy; if they were transformed into dSphs by tidal forces, it must have been done by a single passage.
3.1. Accretion History
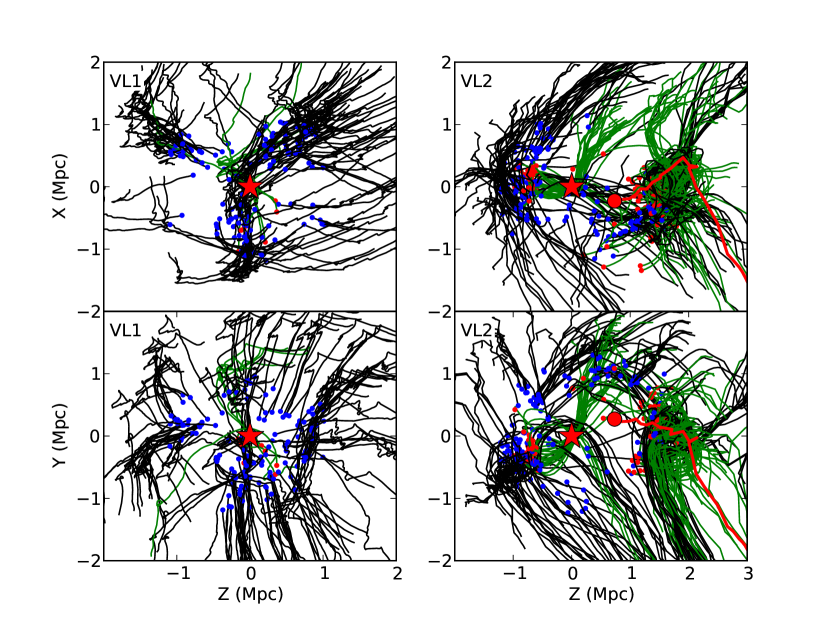
In discussing Figure 1 it was argued that the significant difference in the histories of halos in VL1 and VL2 was due to coherent subgroups of halos. In VL2 several of these subgroups had passed near the host galaxy, while in VL1 very few did. This difference is illustrated in Figure 2, which shows the trajectories in comoving coordinates of halos that have radii of 500-1500 kpc. The trajectories are all relative to the host galaxy, which is fixed at the origin (denoted by the red star). The trajectories of halos that have not passed inside are shown in black with blue dots at their position, while those that have are shown with green lines and red dots. In the VL2 panels, the trajectory of Halo 2 is shown in red with a large red dot.
In both simulations it is clear that many halos are organized into small groups with correlated trajectories. The left side of the VL1 plots show one of these groupings clearly. The same effect is shown in VL2, most clearly seen in the paths, but with the distinct difference that several of these groups have passed through the main halo (or Halo 2), and have thus potentially been tidally processed. This correlated nature of the infalling halos is what causes the significant variation in the radial profile of processed halos, above and beyond what would be expected from pure Poisson noise on the individual halos. Infall of small subgroups of dwarfs has been seen in many other simulations (Li & Helmi, 2008; Klimentowski et al., 2010; Lovell et al., 2011; Helmi et al., 2011) and has been argued to be the cause of the apparent position or velocity correlations amongst satellites around the Milky Way (Lynden-Bell, 1976; Libeskind et al., 2005; Fattahi et al., 2013), M31 (Ibata et al., 2013; Conn et al., 2013), and more distant neighbors of the Local Group (Tully et al., 2006).
3.2. Parameter Sensitivity
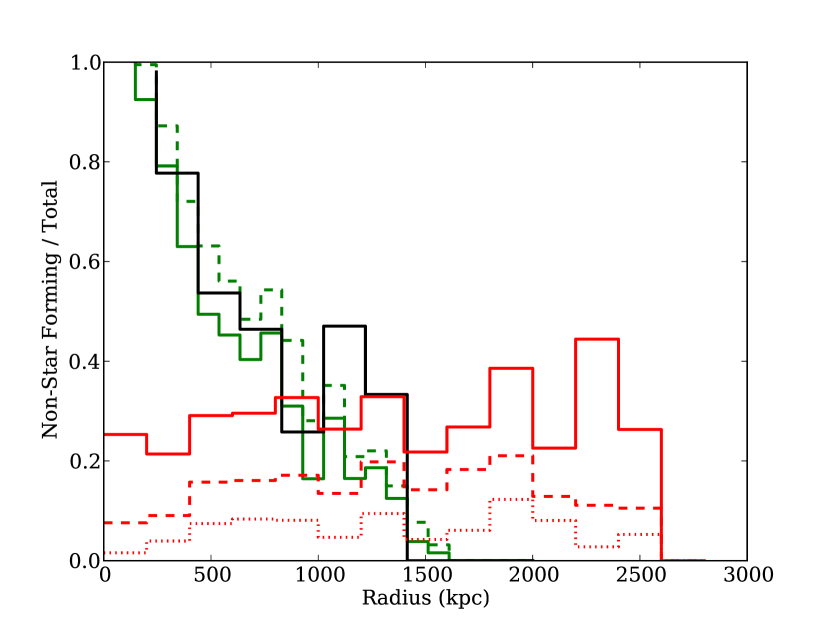
Though our analysis includes some fixed parameters that could potentially alter the results, the robustness of the general conclusions can be shown by recalculating the results under slightly different assumptions. Figure 3 shows the result of changing these assumptions. The solid green line is the same as used in Figure 1, while the dashed green line shows the same calculation but under the relaxed assumption that a galaxy could be tidally affected inside , rather than . This increases the non-star forming fraction at all radii (as it must), but shows a similarly-shaped radial dependence. The solid black line in Figure 3 also shows the same calculation as before, but tightening the constraint to only include halos with km/s rather than km/s. This includes many fewer halos, so the resulting plot is more noisy and we have had to double the bin size accordingly, but again the radial dependence is similar.
The most significant parameters in the merger calculation are the redshift cut-off and the required merger mass ratio. Both of these alter the absolute number of dwarfs that have undergone mergers without altering the radial distribution. This is shown by the red lines in Figure 3, where the solid line shows dwarfs with mergers more recent than 11 Gyr, the dashed shows those more recent than 10 Gyr, and the dotted corresponds to 8 Gyr ago. The number of dwarfs with mergers drops by over half in the most restrictive of these cases, but no other effects are seen. Our analysis remains cognizant of this effect and thus it should not compromise our conclusions.
4. Transformation Timescales
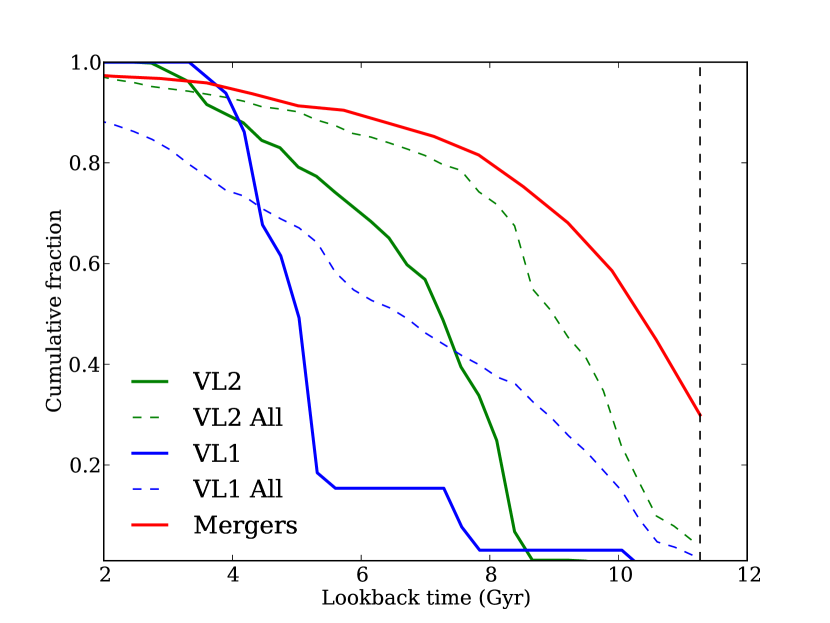
By tracing the merger and the tidal transformation scenarios with cosmological simulations, we are able to infer the timescales on which either of these processes would have been active. The time at which star formation stopped in the dwarf is imprinted in the stellar populations and could be used to differentiate between the two scenarios for dSph formation. Figure 4 shows the cumulative distribution of times at which the distant halos of our sample (located between 500 and 1500 kpc from either host galaxy) either underwent its most recent merger (red line) or first met the tidal criteria (passing inside , shown as the solid blue line for VL1 and sold green for VL2). The vertical dashed line indicates the first timestep at which we are able to resolve mergers or close passages. For comparison we also show the distribution of times at which surviving halos at any present day radius first crossed (dashed blue VL1, dashed green VL2).
The distribution of merger times is clearly weighted towards early times. From the plot, roughly 50% of the observed dwarf-sized dark matter halos that experienced mergers did so more than 11 Gyr ago. This is partly due to the epoch of assembly for small halos being biased towards early times, but there is also the factor of the small halos’ infall onto the larger host increasing the relative velocities of halos to each other and thus inhibiting dynamical friction and further merging.
Though we can directly measure the time at which dark matter halos merged in the simulation, we must also account for the fact that the baryonic components of these galaxies may require additional time for dynamical friction to bring the baryons to coalescence. This is not directly observable, but we can estimate the time lag between the merger of the dark matter and the baryons with the dynamical friction formula from Binney & Tremaine (2008),
| (1) |
where and are the velocity dispersions of the “host” and “satellite” halos, is a characteristic radius over which dynamical friction must act to bring the baryonic components together, and is the Coulomb logarithm. Our selection of only major mergers constrains to be roughly the square root of the mass ratio, and the Coulomb logarithm can be calculated as (Binney & Tremaine, 2008). The dynamical friction time thus reduces to a small factor of crossing time. An order of magnitude estimate with kpc and km/s yields Myr. Assuming a delay of 1 Gyr between the dark matter merger and the baryonic merger would be a relatively conservative estimate.
Given that we see significant merger and accretion activity occurring at such early times, it is logical to ask why the infall of distant dwarfs ( radii of 500-1500 kpc) onto the host galaxy is so delayed. For example, the rapid rise of the VL2 cumulative infall fraction in Figure 4 seems to start suddenly between 8–9 Gyr ago. Two points can help explain this. First, as discussed above, the accretion of halos onto the host galaxy is stochastic and several “clumps” of subhalos are sometimes accreted together. This effect contributes to the stochasticity of the infall rate, particularly in the VL1 simulation where there are fewer halos found at large radii at . The other effect that causes the delayed infall times is related to the distance cut we have applied. The solid green and blue lines in Figure 4 only shows halos that today are found between 500 and 1500 kpc; for comparison, the dashed lines shows the same infall calculation but with that present-day radius constraint removed. In the VL2 case, by the time the infall of the present-day distant dwarfs is starting more than 70% of all surviving halos have already been accreted onto the host galaxy. These halos accreted at early times join a galaxy which is much smaller at the time of accretion, and thus fall in close to the galaxy, while satellites that fall in at later times encounter a much larger galaxy which has grown around the close-in satellites. The VL1 case is more stochastic and the accretion is weighted towards even later times, but the delay is still present. Though this is merely a rough sketch to illustrate the process, the simulation is clear in predicting late infall times for distant dwarfs. When contrasted with the timescale for the merger scenario, the simulations clearly point to a difference in formation times for the two channels.
5. Discussion and Conclusions
We have shown that the radial distribution of galaxies of dwarf galaxies of different morphological types can be used to constrain their formation mechanisms, when combined with simple models based on cosmological simulations. The simulations show that these models produce substantially different sets of properties for the Local Group dwarfs. Mergers of dwarfs are clearly insufficient to explain all of the dSphs, and tidal processes that require multiple pericenter passages cannot account for the number of dwarfs found further than 500 kpc from their host galaxy. These two points are robust.
The fact that the simple close passage model is able to reproduce the observed radial profile of dSphs, even if it does not do so in all cosmological realizations, suggests that this model could be sufficient to create the observed dSphs. However, it hinges critically on the single-passage requirement. Many simulations have shown that multiple passages are necessary with some dwarf models (Mayer et al., 2001; Kazantzidis et al., 2011a), though the more recent simulations of Kazantzidis et al. (2013) suggest that a single-passage transformation is plausible if the progenitor dwarfs have shallow mass profiles in the center (cores). Such profiles contradict early predictions of Cold Dark Matter models (Dubinski & Carlberg, 1991; Navarro et al., 1996, 1997), but observational studies have shown that cores are prevalent in dwarf galaxies (Walker & Peñarrubia, 2011; Oh et al., 2011) and simulations (Read & Gilmore, 2005; Governato et al., 2010, 2012; Zolotov et al., 2012) have shown reasonable methods to create cores from baryonic processes. Cored profiles, however, carry the risk that the halos are more susceptible to tidal stripping and even complete destruction (Peñarrubia et al., 2010). The fine balance between tidal transformation/stirring and tidal destruction may further constrain distant dSphs to a narrow range of structural and orbital parameters.
The alternative formation pathway we have studied, that of mergers between dwarfs, has less evidence to support it but is difficult to rule out. We show that it is unable to be the dominant pathway by which dSphs form, simply because it does not recreate the large dSph fraction at small radii to a host galaxy. However, assuming our understanding of dark matter is correct, mergers must occur. Whether these mergers leave signatures that are observable today is a challenging question that requires further study. At very high redshifts dwarfs may be able to reform gas disks and continue forming stars, which would lead us to identify them as dIrrs. At what redshift, if any, mergers cause these galaxies to no longer sustain any star formation is a complex question best answered with hydrodynamical simulations.
We have shown that, for distant dwarfs, mergers must occur at very early times, while their infall onto a host potential occurs much later. The time at which star formation ended in the dwarf should therefore be a signature in the stellar populations that cannot be erased. Do the distant dSphs of the Local Group exhibit star formation histories that could differentiate between the early shut-off in the merger scenario and the later shut-off by tidal interactions?
Studies of the star formation histories of Tucana and Cetus show that both dwarfs reached the peak star formation rate more than Gyr ago and subsequently the star formation rates declined (Monelli et al., 2010a, b), but from this history it is difficult to ascribe a specific time at which some process shut off star formation. In either case it took nearly 3 Gyr for the star formation rate to decline from its peak value to negligible levels; such a slow and gradual process does not lend itself to an easy comparison to our binary off-or-on model. This is particularly true in the case of mergers, where additional star formation may be triggered by the merger itself. More sophisticated modeling of the detailed star formation history, including the hydrodynamical processes that eventually render a dSph devoid of gas, could be able to extract conclusions from the stellar populations seen in Cetus and Tucana.
A logical extension of our work would be to ask if there exist comparable trends outside the Local Group. The work of Geha et al. (2012) used a sample of somewhat more massive dwarfs to show that below a mass threshold of , non-star-forming galaxies do not exist in any substantial number beyond 1500 kpc of a massive galaxy. This matches well with the predictions of the tidal processing scenario, which also shows very few processed halos beyond 1500 kpc. The Geha et al. (2012) sample substantiates the hypothesis that at low masses tidal processing is sufficient to recreate the distribution of dSphs, without requiring mergers. At slightly higher masses of , a small fraction of quenched halos are observed at all radii (their Figure 4), much in agreement with the expectations for mergers. If mergers are responsible at large radii, this suggests that it is only above a certain mass threshold that mergers (which must happen at all masses) are capable of quenching galaxies in the field. Such a model has been shown by Hopkins et al. (2009) to reproduce the mass dependence of the fraction of bulge-dominated galaxies in the field, and could extend to their star formation properties as well. This picture of combining tidal processes with mergers above a threshold provides a natural link between the behavior of satellites and of central galaxies.
One difference between the Geha et al. (2012) results and the Local Group is in the fraction of quenched galaxies at small radii. In the Local Group substantially all galaxies inside 200 kpc are quenched, but the quenched fraction only reaches at most 30% in the Geha et al. (2012) sample. This could suggest a mass dependence to tidal processing, where perhaps the more massive dwarfs of the Geha et al. (2012) sample require longer timescales to shut off star formation, and thus many of their galaxies at radii are slowly on the way to quenching. Our instantaneous tidal processing model does not capture this behavior, but a more sophisticated mass-dependent model may better explain this effect.
References
- Binney & Tremaine (2008) Binney, J., & Tremaine, S. 2008, Galactic Dynamics: Second Edition, Princeton University Press, Princeton, NJ
- Balogh et al. (2000) Balogh, M. L., Navarro, J. F., & Morris, S. L. 2000, ApJ, 540, 113
- Brooks et al. (2013) Brooks, A. M., Kuhlen, M., Zolotov, A., & Hooper, D. 2013, ApJ, 765, 22
- Conn et al. (2013) Conn, A. R., Lewis, G. F., Ibata, R. A., et al. 2013, ApJ, 766, 120
- Dekel & Silk (1986) Dekel, A., & Silk, J. 1986, ApJ, 303, 39
- Diemand et al. (2006) Diemand, J., Kuhlen, M., & Madau, P. 2006, ApJ, 649, 1
- Diemand et al. (2007) Diemand, J., Kuhlen, M., & Madau, P. 2007, ApJ, 667, 859
- Diemand et al. (2008) Diemand, J., Kuhlen, M., Madau, P., et al. 2008, Nature, 454, 735
- D’Onghia et al. (2009) D’Onghia, E., Besla, G., Cox, T. J., & Hernquist, L. 2009, Nature, 460, 605
- Dubinski & Carlberg (1991) Dubinski, J., & Carlberg, R. G. 1991, ApJ, 378, 496
- Faber & Lin (1983) Faber, S. M., & Lin, D. N. C. 1983, ApJ, 266, L17
- Fattahi et al. (2013) Fattahi, A., Navarro, J. F., Starkenburg, E., Barber, C. R., & McConnachie, A. W. 2013, MNRAS, 431, L73
- Gallagher & Wyse (1994) Gallagher, J. S., III, & Wyse, R. F. G. 1994, PASP, 106, 1225
- Geha et al. (2012) Geha, M., Blanton, M. R., Yan, R., & Tinker, J. L. 2012, ApJ, 757, 85
- Gill et al. (2005) Gill, S. P. D., Knebe, A., & Gibson, B. K. 2005, MNRAS, 356, 1327
- Gnedin (2000) Gnedin, N. Y. 2000, ApJ, 542, 535
- Gnedin & Zhao (2002) Gnedin, O. Y., & Zhao, H. 2002, MNRAS, 333, 299
- Governato et al. (2010) Governato, F., Brook, C., Mayer, L., et al. 2010, Nature, 463, 203
- Governato et al. (2012) Governato, F., Zolotov, A., Pontzen, A., et al. 2012, MNRAS, 422, 1231
- Grebel et al. (2003) Grebel, E. K., Gallagher, J. S., III, & Harbeck, D. 2003, AJ, 125, 1926
- Helmi et al. (2011) Helmi, A., Cooper, A. P., White, S. D. M., et al. 2011, ApJ, 733, L7
- Hodge (1964) Hodge, P. W. 1964, AJ, 69, 438
- Hodge & Michie (1969) Hodge, P. W., & Michie, R. W. 1969, AJ, 74, 587
- Hopkins et al. (2009) Hopkins, P. F., Somerville, R. S., Cox, T. J., et al. 2009, MNRAS, 397, 802
- Ibata et al. (2013) Ibata, R. A., Lewis, G. F., Conn, A. R., et al. 2013, Nature, 493, 62
- Irwin et al. (2007) Irwin, M. J., Belokurov, V., Evans, N. W., et al. 2007, ApJ, 656, L13
- Kazantzidis et al. (2011a) Kazantzidis, S., Łokas, E. L., Callegari, S., Mayer, L., & Moustakas, L. A. 2011, ApJ, 726, 98
- Kazantzidis et al. (2011b) Kazantzidis, S., Łokas, E. L., Mayer, L., Knebe, A., & Klimentowski, J. 2011, ApJ, 740, L24
- Kazantzidis et al. (2013) Kazantzidis, S., Łokas, E. L., & Mayer, L. 2013, ApJ, 764, L29
- Klimentowski et al. (2009) Klimentowski, J., Łokas, E. L., Kazantzidis, S., Mayer, L., & Mamon, G. A. 2009, MNRAS, 397, 2015
- Klimentowski et al. (2010) Klimentowski, J., Łokas, E. L., Knebe, A., et al. 2010, MNRAS, 402, 1899
- Kormendy (1985) Kormendy, J. 1985, ApJ, 295, 73
- Klypin et al. (1999) Klypin, A., Kravtsov, A. V., Valenzuela, O., & Prada, F. 1999, ApJ, 522, 82
- Koposov et al. (2009) Koposov, S. E., Yoo, J., Rix, H.-W., et al. 2009, ApJ, 696, 2179
- Kravtsov et al. (2004) Kravtsov, A. V., Gnedin, O. Y., & Klypin, A. A. 2004, ApJ, 609, 482
- Li & Helmi (2008) Li, Y.-S., & Helmi, A. 2008, MNRAS, 385, 1365
- Libeskind et al. (2005) Libeskind, N. I., Frenk, C. S., Cole, S., et al. 2005, MNRAS, 363, 146
- Lovell et al. (2011) Lovell, M. R., Eke, V. R., Frenk, C. S., & Jenkins, A. 2011, MNRAS, 413, 3013
- Lynden-Bell (1976) Lynden-Bell, D. 1976, MNRAS, 174, 695
- Mac Low & Ferrara (1999) Mac Low, M.-M., & Ferrara, A. 1999, ApJ, 513, 142
- Makarov et al. (2012) Makarov, D., Makarova, L., Sharina, M., et al. 2012, MNRAS, 425, 709
- Mayer et al. (2001) Mayer, L., Governato, F., Colpi, M., et al. 2001, ApJ, 559, 754
- Mayer et al. (2006) Mayer, L., Mastropietro, C., Wadsley, J., Stadel, J., & Moore, B. 2006, MNRAS, 369, 1021
- McConnachie (2012) McConnachie, A. W. 2012, AJ, 144, 4
- Monelli et al. (2010a) Monelli, M., Hidalgo, S. L., Stetson, P. B., et al. 2010, ApJ, 720, 1225
- Monelli et al. (2010b) Monelli, M., Gallart, C., Hidalgo, S. L., et al. 2010, ApJ, 722, 1864
- Moore (1994) Moore, B. 1994, Nature, 370, 629
- Moore et al. (1999) Moore, B., Ghigna, S., Governato, F., et al. 1999, ApJ, 524, L19
- Moore et al. (2004) Moore, B., Diemand, J., & Stadel, J. 2004, IAU Colloq. 195: Outskirts of Galaxy Clusters: Intense Life in the Suburbs, 513
- Navarro et al. (1996) Navarro, J. F., Frenk, C. S., & White, S. D. M. 1996, ApJ, 462, 563
- Navarro et al. (1997) Navarro, J. F., Frenk, C. S., & White, S. D. M. 1997, ApJ, 490, 493
- Oh et al. (2011) Oh, S.-H., de Blok, W. J. G., Brinks, E., Walter, F., & Kennicutt, R. C., Jr. 2011, AJ, 141, 193
- Peñarrubia et al. (2010) Peñarrubia, J., Benson, A. J., Walker, M. G., et al. 2010, MNRAS, 406, 1290
- Read & Gilmore (2005) Read, J. I., & Gilmore, G. 2005, MNRAS, 356, 107
- Sawala et al. (2010) Sawala, T., Scannapieco, C., Maio, U., & White, S. 2010, MNRAS, 402, 1599
- Slater et al. (2011) Slater, C. T., Bell, E. F., & Martin, N. F. 2011, ApJ, 742, L14
- Somerville (2002) Somerville, R. S. 2002, ApJ, 572, L23
- Teyssier et al. (2012) Teyssier, M., Johnston, K. V., & Kuhlen, M. 2012, MNRAS, 426, 1808
- Tully et al. (2006) Tully, R. B., Rizzi, L., Dolphin, A. E., et al. 2006, AJ, 132, 729
- van den Bergh (1994) van den Bergh, S. 1994, ApJ, 428, 617
- Walker & Peñarrubia (2011) Walker, M. G., & Peñarrubia, J. 2011, ApJ, 742, 20
- Wetzel et al. (2013) Wetzel, A. R., Tinker, J. L., Conroy, C., & van den Bosch, F. C. 2013, arXiv:1303.7231
- Zolotov et al. (2012) Zolotov, A., Brooks, A. M., Willman, b., et al. 2012, ApJ, 761, 71