Molecular gas in type 2 quasars at 0.2-0.3††thanks: Based on observations carried out with the IRAM 30m radiotelescope and the Australia Telescope Compact Array.
Abstract
We present results of CO(1-0) spectroscopic observations of 10 SDSS type 2 quasars (QSO2) at z0.2-0.3 observed with the 30m IRAM radiotelescope and the Australia Telescope Compact Array. We report 5 new confirmed CO(1-0) detections and 1 tentative detection. They have several109 K km s-1 pc2, while upper limits for the non detections are 3 = several109 K km s-1 pc2.
This study increases the total number of QSO2 with CO measurements at 1 to 20, with a 50% detection rate. The vast majority are at 0.1-0.4. Assuming a conversion factor =0.8 (K km s-1 pc2)-1, the implied molecular gas masses are in the range 4108 to 5109 . We compare with samples of type 1 quasars (QSO1), luminous and ultraluminous infrared galaxies. We find no difference in the molecular gas content of QSO1 and QSO2 of a given infrared luminosity, although the QSO2 sample is affected by small number statistics. This result, if confirmed, is consistent with the unification model for quasars.
QSO2 fall on the vs. , vs. and vs. correlations defined by quasars at different . The location of the QSO2 in these diagrams is discussed in comparison with samples of QSO1, luminous and ultraluminous infrared galaxies, and high submm sources.
CO(1-0) has FWHM180-370 km s-1 when detected, with a variety of kinematic profiles (single or double horned). In general, the CO line is narrower than [OIII]5007, as observed in low QSO1, with /1-2). This probably reveals different spatial sizes and/or geometry of the ionized and molecular phases and a higher sensitivity of the [OIII] emission to non gravitational motions, such as outflows. Considering the 0.1-0.4 range, where CO measurements for both QSO1 and QSO2 exist, we find no difference in between them, although this result is tentative. In the unification scenario between QSO1 and QSO2, this suggests that the distribution of CO gas is not related to the obscuring torus.
keywords:
galaxies: quasars: general; galaxies: evolution; galaxies:interactions.1 Introduction
It has been only in the last decade that radio quiet type 2 (i.e. obscured) quasars, generally known as “type 2 quasars”, have been discovered in large quantities at different wavelengths: X-ray (e.g. Szokoly et al. 2004), infrared (e.g. Martínez-Sansigre et al. 2006, Stern et al. 2005) and optical (Reyes et al. 2008, Zakamska et al. 2003). These authors have identified nearly 1000 type 2 quasars (QSO2 hereafter, vs. QSO1 or type 1 quasars) at redshift 0.20.8 in the Sloan Digital Sky Survey (SDSS, York et al. 2000) based on their optical emission line properties: narrow H (full width half maximum, FWHM2000 km s-1), high ionization emission lines characteristic of type 2 active galactic nuclei (AGN) and narrow line luminosities typical of QSO1 (2108 L⊙).
Based on diverse studies it can be said that the host galaxies of QSO2 are often ellipticals with frequent signatures of mergers/interactions (Villar-Martín et al. 2012, Bessiere et al. 2012, Villar-Martín et al. 2011a, Greene et al. 2009). Very intense star formation activity is also frequently found (e.g. Zakamska. et al. 2008, Lacy et al. 2007, Hiner et al. 2009). Ionized gas outflows are an ubiquitous phenomenon (Villar-Martín et al. 2011b, Greene et al. 2011, Humphrey et al. 2010). The optical continuum is sometimes polarized, revealing the presence of an obscured non-thermal continuum source (Zakamska et al. 2005, Vernet et al. 2001).
A fundamental piece of information is still missing: the molecular gas content of this class of objects has been very scarcely studied and it is not known whether the host galaxies of QSO2 contain abundant reservoirs of molecular gas. This gaseous phase can provide large amounts of fuel to form stars and feed the nuclear black hole. This gas is highly sensitive to the different mechanisms at work during galactic evolution (e.g. interactions and mergers). As such, it retains relic information about the global history of the systems.
CO, the strongest tracer of molecular gas, has been found in active galaxies (AGNs) at different of similar AGN power as QSO2, i.e., QSO1 and powerful FRII (Fanaroff-Riley II) narrow line radio galaxies (see Solomon & Vanden Bout 2005, Omont 2007, Miley & de Breuck 2008, for a global review). The inferred H2 masses are in the range 108-several109 (where is the CO(1-0) line luminosity and assuming =0.8 (K km s-1 pc2)-1) (Downes & Solomon 1998)111Recent results imply = 0.6 0.2 (Papadopoulos et al. 2012) at low (0.1, e.g. Bertram et al. 2007, Evans et al. 2005, Ocaña Flaquer et al. 2010) and several109-1011 M⊙ at 2 (e.g. Emonts et al. 2011a, de Breuck et al. 2005, Ivison et al. 2011). The presence of CO has also been confirmed in several distant QSO2 at 3, implying masses several1010 M⊙ (Schumacher et al. 2012, Polletta et al. 2011, Martínez -Sansigre et al. 2009).
| (1) | (2) | (3) | (4) | (5) | (6) | (7) | (8) | (9) | (10) | |
| Object | Run | RA | Dec | Scale | texp | rms | ||||
| (Mpc) | (kpc/) | (hr) | (GHz) | |||||||
| SDSS J0831+07 | A | 08 31 30.3 | +07 05 59.5 | 0.232 | 1147 | 3.7 | 5.2 | 93.6 | 0.4 | |
| SDSS J1044+06 | A | 10 44 26.7 | +06 37 53.8 | 0.210 | 1025 | 3.4 | 6.2 | 95.3 | 0.3 | |
| SDSS J1106+03 | A | 11 06 22.0 | +03 57 47.1 | 0.242 | 1204 | 3.8 | 3.9 | 92.8 | 0.4 | |
| SDSS J1301-00 | A | 13 01 28.8 | -00 58 04.3 | 0.246 | 1227 | 3.8 | 6.0 | 92.5 | 0.4 | |
| SDSS J1344+05 | A | 13 44 18.7 | +05 36 25.6 | 0.276 | 1399 | 4.2 | 6.2 | 90.3 | 0.2 | |
| SDSS J0028-00 | B | 00 28 52.87 | -00 14 33.6 | 0.310 | 1601 | 4.5 | 9.2 | 87.1 | 0.2 | |
| SDSS J0103+00 | B | 01 03 48.58 | +00 39 35.0 | 0.314 | 1625 | 4.6 | 8.0 | 87.7 | 0.3 | |
| SDSS J0236+00 | B | 02 36 35.06 | +00 51 26.9 | 0.207 | 1009 | 3.4 | 6.5 | 95.5 | 0.2 | |
| SDSS 0025-10 | ATCA | 00 25 31.46 | -10 40 22.2 | 0.303 | 1559 | 4.5 | 17.0 | 88.4 | 1.0 | |
| SDSS 0217-00 | ATCA | 02 17 58.18 | -00 13 02.7 | 0.344 | 1808 | 4.9 | 7.5 | 85.8 | 2.2 |
| (1) | (2) | (3) | (4) | (5) | (6) | (7) | (8) | (9) |
| Object | log() | ) | ||||||
| (109) | (109 ) | (km s-1) | (km s-1) | (km s-1) | 1011 | 1011 | ||
| SDSS J0831+07 | 8.52 | 6.51.0 | 5.2 0.9 | 37060 | 68510 | 2030 | 4 | 2.6 |
| SDSS J1044+06 | 8.17 | 2.0 | 1.6 | - | 105020 | - | 2.3 | 1.6 |
| SDSS J1106+03 | 9.02 | 4.3 | 3.4 | - | 54510 | - | 8.70.6 | 5.70.5 |
| SDSS J1301-00 | 9.14 | 4.1 | 3.3 | - | 76010 | - | 9.5 | 6.5 |
| SDSS J1344+05 | 8.12 | 2.40.6 | 1.90.5 | 18030 | 50015 | -31050 | 5.5 | 5 |
| 3.80.6 | 3.00.4 | 22030 | -2030 | |||||
| SDSS J0028-00 | 8.43 | 61 | 51 | 300100 | 33010 | 6030 | - | - |
| SDSS J0103+00 | 8.31 | 61 | 4.80.9 | 28050 | 35510 | 830 | 18 | 12 |
| SDSS J0236+00? | 9.20 | 5.00.5 | 1.70.4 | 22040 | 80020 | -167030 | 4.21.5 | 2.80.1 |
| SDSS 0025-10 | 8.73 | 4.30.9 | 3.40.7 | 14025 | 44010 | -15525 | 11.03 | 7.82.2 |
| 3.10.9 | 2.50.7 | 8040 | -520 | |||||
| SDSS 0217-00 | 8.81 | 6.2 | 5.0 | - | 98515 | - | 12.00.8 | 8.70.6 |
| Object | ||||
|---|---|---|---|---|
| (109) | (1011) | (1011) | ||
| SWIRE2 J021638.21-042250.8 | 0.304 | 2.3 | 2.00.5a | 1.20.2a |
| SWIRE2 J021909.60-052512.9 | 0.099 | 0.7 | 0.80.1a | 0.550.05a |
| SWIRE2 J021939.08-051133.8 | 0.150 | 1.7 | 0.950.05a | 0.60.1a |
| SWIRE2 J022306.74-050529.1 | 0.330 | 3.3 | 62b | 4.01.3c |
| SWIRE2 J022508.33-053917.7 | 0.293 | 2.2 | 1.50.5a | 1.20.2a |
| SDSS J092014.11+453157.3 | 0.403 | 2.8 | 8.2d | 5.5c |
| SDSS J103951.49+643004.2? | 0.402 | 2.1 | 13.0d | 8.7c |
| SSTXFLS J171325.1+590531 | 0.126 | 0.5 | 0.230.03e | 0.150.02c |
| SSTXFLS J171335.1+584756 | 0.133 | 0.5 | 1.00.2a | 0.70.2a |
| SSTXFLS J172123.1+601214 | 0.325 | 1.8 | 4.51.5b | 31c |
Many of these studies have focussed at low (0.1) and high redshift (2), and frequently on luminous infrared sources. The intermediate range, which spans 60% of the age of the Universe, an epoch of declining cosmic star formation rate (Hopkins & Beacom 2006) has remained almost practically unexplored until very recently. On this regard, two relevant papers have been published recently: on one hand, Xia et al. (2012) report CO detections in 17 out of 19 ultraluminous infrared QSO1 hosts (1012 , where is the infrared luminosity in the 8-1000 m spectral range) at 0.1-0.2. They infer (0.2-2.1)1010 . On the other hand, Krips, Neri & Cox (2012, KNC12 hereafter) have investigated for the first time the molecular gas content of 10 QSO2 at 0.1-0.4. According to our revised values (see §4.3), all but one have several1011 L⊙. They confirm the detection of CO(1-0) in five sources and a tentative detection for a sixth. The derived gas masses are (0.4-2.6)109 for the detections and 2109 for the four non detections.222For coherence with the rest of this work, we have recalculated for KNC12 sample assuming a conversion factor =0.8 (K km s-1 pc2)-1 instead of the 4.8 value used by those authors. We have also recalculated their upper limits using the , instead of the (§3.3).
We present here results on 10 more optically selected QSO2 at 0.2-0.3 based on data obtained with the 30m IRAM radio telescope and the Australian Telescope Compact Array (ATCA). We measure the CO(1-0) luminosities and constrain the molecular gas masses and the infrared luminosities. These are compared with other samples of quasars, luminous infrared galaxies (LIRGs, with 1011 1012 ), ultraluminous infrared galaxies (ULIRGs 1012 ) and high submm sources.
We assume =0.7, =0.3, H0=71 km s-1 Mpc-1.
2 The sample.
The sample consists of 10 radio quiet (1031 erg s-1 Hz-1 sr-1, Miller, Peacock, & Mead 1990) SDSS QSO2 at 0.2-0.34 (Table 1) selected from the original sample of Reyes et al. (2008) and Zakamska et al. (2003) (see these papers for a detailed description of the selection criteria). These are objects with narrow (full width half maximum 1000 km s-1) forbidden and permitted emission lines without underlying broad components, with line ratios characteristic of a non-stellar ionizing radiation and [OIII]5007 luminosities typical of QSO1.
The IRAM sample consists of 8 SDSS QSO2. No bias was applied regarding the host galaxy properties or the infrared (IR) luminosities. The only criteria were that they were observable with the IRAM radiotelescope and with 0.3, so that the CO(1-0) transition falls within the EMIR E090 band. This transition is the least dependent on the excitation conditions of the gas, which is crucial for deriving reliable estimates of the total molecular gas content, including the wide-spread, low-density gas that may be sub-thermally excited (e.g. Papadopoulos et al. 2001, Carilli et al. 2010).
Two more QSO2 at similar were observed with ATCA (SDSS J0025-10 and SDSS J0217-00), which were specifically selected for being luminous IR sources (with IRAS counterparts) and for showing interesting features such as being strong mergers. These two systems were studied in detail by Villar Martín et al. (2011a, 2011b) based on deep optical imaging and spectroscopy obtained with the Faint Object FOcal Reducer and low dispersion Spectrograph (FORS2) on the Very Large Telescope (VLT). A detailed study of the CO(1-0) spatial distribution in SDSS J0025-10 based on the ATCA data can be found in Villar-Martín et al. (2013).
The luminosity of the [OIII]5007 line, , has been proposed as a proxy for the AGN power (Heckman et al. 2004) and a potential discriminant between Seyferts and quasars. This is specially useful for type 2 objects for which the optical colours result from a complex mixture of the host galaxy continuum and AGN related sources (e.g. Vernet et al. 2001). All but two objects in our sample have log(8.3 (Table 2, column 2) which is the lower limit applied by Reyes et al. (2008) to select quasars vs. Seyferts. The two remaining objects have values 8.1-8.2, i.e., a factor of 1.5 below this limit. However, taking into account that reddening has been ignored and the fact that [OIII] is partially obscured in type 2 AGNs (di Serego Alighieri et al. 1997), we consider these two objects as QSO2 as well. It must also be kept in mind that the relation between the [OIII]5007 and bolometric luminosity for quasars has a significant scatter, resulting in a somewhat arbitrary separation between quasars and Seyferts (e.g. Zakamska et al. 2003).
We will refer frequently throughout the paper to the QSO2 sample studied by KNC12 . All but two objects are from the original sample of 24 m selected galaxies observed with the Spitzer infrared spectrograph for the 5 Millijanksy Unbiased Spitzer Extragalactic Survey (5MUSES) (Wu et al. 2010, see also Lacy et al. 2007). The other two quasars are from the QSO2 SDSS sample of Zakamska et al. (2003).
3 Observations
3.1 IRAM observations
The observations were obtained during two different observing runs A and B in February and August 2012 respectively with the IRAM 30 m telescope at Pico Veleta, Spain. The EMIR receiver was tuned to the redshifted frequencies of the CO line, using the optical SDSS redshift for each object (see Table 1). The observations were performed in the wobbler switching mode with a throw of 120” (run A) or 50” (run B), in order to ensure flat baselines. We observed both polarizations (H and V) using as a backend the WILMA autocorrelator that produced an effective total bandwidth of 4 GHz with a (Hanning-smoothed) velocity resolution of 16 MHz or 50 km s-1.
For run A the observing conditions were good (pwv 4 mm). For run B the conditions were variable with pwv in the range 3-10 mm. The system temperatures were in the range T76-114 K for run A and 102-106 K for run B. The total integration time and the rms for all sources are specified in Table 1.
The temperature scale used is in main beam temperature Tmb. At 3mm the telescope half-power beam width is 29. The main-beam efficiency is = T/Tmb =0.81. A factor /T = 5.9 Jy/K was applied to obtain the flux in mJy/beam units.
The pointing model was checked against bright, nearby calibrators for every source, and every 1.6 hrs for long integrations, it was found to be accurate within 5. Calibration scans on the standard two load system were taken every 8 minutes. The focus was checked after sunrise, after sunset and every six hours.
The off-line data reduction was done with the CLASS program of the GILDAS software package (Guilloteau & Forveille 1989), and involved only the subtraction of (flat) baselines from individual integrations and the averaging of the total spectra.
3.2 ATCA observations
The observations of SDSS J0025-10 and SDSS J0217-00 were performed during 2-7 August 2012 with the Australia Telescope Compact Array (ATCA), a radio interferometer in Narrabri, Australia. Observations were done in the compact hybrid H75 array configuration (with baselines ranging from 31 to 89 meters). Two 2 GHz bands with 1 MHz channel resolution were centered on the redshifted frequency of the CO(1-0) line for each object (88.4 GHz for SDSS J0025-10 and 85.8 GHz SDSS J0217-00; Table 1), resulting in a velocity coverage of 7000 km s-1 and maximum resolution of 3.5 km s-1. At 88 GHz, the primary beam of the telescope is 32. Observations were done under good weather conditions, with typical system temperatures of 400 - 650 K and atmospheric seeing fluctuations m for SDSS J0025-10 and m for SDSS J0217-00 (see Middelberg, Sault & Kesteven 2006). The total on-source integration time was 17h for SDSS J0025-10 and 7.5h for SDSS J0217-00.
The phases and bandpass were calibrated every 7.5 minutes with a short (2 min) scan on the nearby bright calibrators PKS 0003-066 (SDSS J0025-10) and PKS J0217+0144 (SDSS J0217-00). Atmospheric amplitude variation were calibrated every 30 minutes using a paddle scan, and telescope pointing was updated every hour, or every time the telescope moved 20∘ on the sky. For absolute flux calibration, Uranus was observed close to our target source, resulting in an absolute flux calibration accuracy of 20%.
The off-line data reduction was done with the MIRIAD software. Bad data (including data with internal interference or shadowing of an antenna) were discarded. For the data reduction we followed Emonts et al. (2011a), noting that atmospheric opacity variations were corrected by weighting the data according to their ‘above atmosphere’ (i.e. paddle-corrected) system temperature. After Fourier transformation, we obtained data cubes with robust weighting +1 (Briggs, 1995).
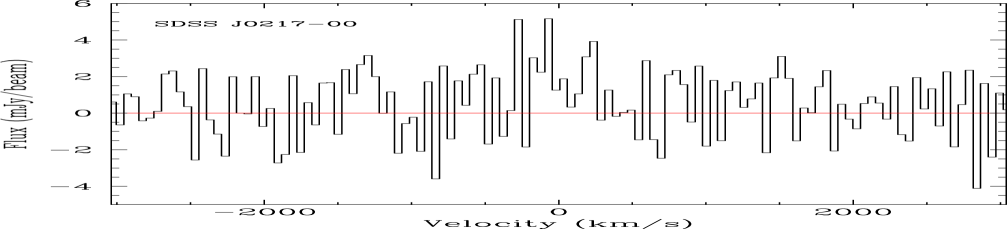
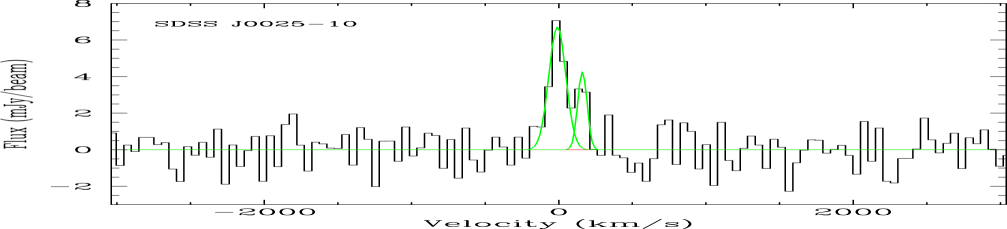
No 88/85 GHz radio continuum was detected in these data cubes down to a 5 limit of 0.5 mJy for SDSS J0025-10 and 0.9 mJy for SDSS J0217-00. The synthesized beam-size of the J0025-10 data is arcsec2 (PA -85.3∘) and that of SDSS J0217-00 data is arcsec2 (PA -70.7∘). The spectra presented in this paper were extracted at the location of the quasar host galaxies, binned by 5 channels and subsequently Hanning smoothed to a velocity resolution of 50 km s-1, yielding a noise level of 1.0 and 2.2 mJy beam-1 chan-1 for SDSS J0025-10 and SDSS J0217-00 respectively. We also imaged the spatial distribution of the CO(1-0) detected in SDSS J0025-10. This is presented in Villar-Martín et al. (2013).
4 Analysis
4.1 The comparison samples
In the following sections (in particular, Figs. 3) we will perform a comparative study between QSO2 and QSO1, LIRGs, ULIRGs and submillimeter sources at different .
We describe here briefly these samples and the symbol/colour code used in Fig. 3 for their representation. For coherence with our work, upper limits have been recalculated using full width at zero intensity , instead of whenever possible.
-
•
QSO1 (blue symbols)
- –
-
–
ULIRG QSO1 at 0.1-0.3 (blue solid circles, Xia et al. 2012).
- –
- –
-
•
QSO2 (green symbols)
-
–
10 QSO2 from this work (green solid circles)
-
–
10 QSO2 from KNC12 (green solid squares)
Unlike for QSO1, ULIRG-QSO2 are not included because as we shall see in §4.3, the three most luminous QSO2 have in the LIRG-ULIRG transition regime. All other QSO2 at intermediate have in the LIRG regime or below.
- –
-
–
-
•
ULIRGs (no quasars included) and submm sources with no obvious evidence for an AGN (red symbols)
-
–
0.040.2 ULIRGs (red solid diamonds, Graciá Carpio et al. 2008). This sample consists of star forming galaxies and AGN (Seyfert 1, Seyfert 2 and Liners).
- –
-
–
2 submm sources with no obvious evidence of an AGN (Bothwell et al. 2013, Ivison et al. 2011, Daddi et al. 2009, Gao et al. 2007, Weiss et al. 2005, Smail, Smith & Ivison 2005, Neri et al. 2003, Solomon, Downes & Radford 1992). The luminosities have been corrected for magnification in lensed sources.
-
–
- •
4.2 Calculation of and
A major part of the results presented in this paper is based on the CO(1-0) line luminosities and the far infrared luminosity measured between 40-500 m rest frame. To infer them, different methods and observables have been used for different samples and redshifts. We explain in detail in this and next section the methodology applied.
in K km s-1 pc2 is calculated as (Solomon & Vanden Bout 2005):
where is the integrated CO(1-0) line intensity in Jy km s-1, is the luminosity distance in Mpc (Table 1) and =115.27 GHz, is the rest frame frequency of the CO(1-0) transition.
For the non detections (i.e. ), we calculate the upper limit as (Sage 1990):
where =50 km s-1 is the channel width and is the channel to channel rms noise of the spectrum in Jy. We have assumed a typical = 870 km s-1, using the median value of our and KNC12 measurements.
Different CO transitions are observable at different . In order to extrapolate to the CO(1-0) transition for all objects, we have assumed a constant effective brightness temperature for the different transtions (thus, =1). This is usually assumed for low studies, where the gas is likely to be optically thick and thermally excited (e.g. Combes et al. 2012; but see also Papadopoulos et al. 2012). At high the uncertainties on the CO excitation are larger. Some works suggest that thermal excitation is a reasonable assumption both for quasars (Riechers et al. 2011) and submm sources (Weiss et al. 2005, Aravena et al. 2008), while others rather suggest sub-thermal excitation (Carilli et al. 2010). If this were the case, we would be underestimating the by a factor of 2-4 for the high sources. This and other uncertainties such as the accuracy of the magnification factor in confirmed lensed objects are likely to contribute to the data scatter at high . However, this will have a small impact on our conclusions since the scatter of the values at a given is also very large, spanning 2 orders of magnitude considering all object classes.
To estimate the molecular gas masses we use the standard conversion formula (Solomon & Vanden Bout 2005):
For the purpose of comparison with other works, we have assumed =0.8 (K km s-1 pc2)-1, which has been frequently adopted for ULIRGs and active galaxies.
4.3 Calculation of
We plan to investigate the location of our QSO2 in the vs. diagram, relatively to other samples. Thus, values are required for all objets. Alternatively can be used, but is more generally available for the different samples in the literature. Also, it maps cooler dust and in principle it is a more reliable tracer of the dust emission induced by starburst heating. Finally, is less dependent on orientation than , due to the higher sensitivity of the mid-infrared luminosity (= - ) to obscuration (Drouart et al. 2012).
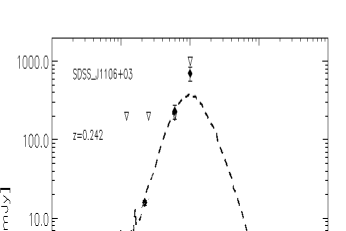
To constrain for our QSO2 we have fitted the spectral energy distribution (SED) for the 4 objects with WISE (3.3, 4.6, 11.6, 22.1 m) and IRAS (60 and/or 100 m) photometric measurements: SDSS J1106+03, SDSS J0236+00 and SDSS J0025-10, SDSS J0217-00 (see Figs. A1 and A2 in the Appendix). Optical and near infrared photometry have not been used, since these bands are known to be a complex mixture of stellar and AGN related components (e.g. scattered/transmitted AGN light, nebular continuum). To build the SEDs we used the SWIRE template library (Polletta et al. 2007) which contains 25 templates including ellipticals, spirals, starbursts, type 2 and type 1 AGNs and composite starburst + AGN. The results are shown in Table 2. The uncertainties are dominated by the range of templates able to reproduce the data. SDSS J0028-00 has been excluded in this analysis because an unrelated galaxy very close in projection confuses the IR photometry.
For the remaining 5 objects in our sample, IRAS upper limits are available and WISE photometry: SDSS J0831+07, SDSS J1044+06, SDSS J1301-01, SDSS J1344+05, SDSS J0103+00. Only upper limits on and can be obtained for these objects by fitting the SED (Table 2).
Applying the same method, we have recalculated and for the 5 objects in KNC12 with both mid and far IR photometric data to alleviate the large uncertainties affecting their values (Table 3). For 4 more objects is available from Wu et al. (2010) and Zakamska et al. (2008)). For the remaining quasar, was constrained from the 24 m luminosity using the equations proposed by Wu et al. (2010). To constrain for these quasars, we have estimated a conversion factor appropriate for QSO2. For this, we have used the 9 QSO2 with both and values available in both samples. They show very similar in the range 1.4-1.7, with a median value of 1.5, that we assume for . The final revised and values for KNC12 QSO2 are shown in Table 3. We have applied the same conversion factor to high QSO2 with only available (Polletta et al. 2011) .
To estimate a conversion factor appropriate for QSO1, we have collected the IRAS flux measurements at 12, 25, 60 and 100 m for nearby type 1 quasars with the 4 measurements published (17 objects in Sanders et al. 1989a). We find that is in the range 2.0-3.3, with a median value of 2.96, which we therefore assume to estimate for those few QSO1 with no available .
The low values we have measured for 0.4 QSO2 are consistent with the unification scenario of QSO1 and QSO2. They suggest that the MIR emission, which is expected to be emitted by the hottest dust in the inner faces of the obscuring torus (Drouart et al. 2012) is partially obscured. This is consistent with Hiner et al. (2009), who found that QSO1 have less far-IR emission on average when compared to QSO2 matched in mid-infrared luminosity. Similarly, the authors propose that this difference is due to orientation.
We have used a conversion factor =1.3 appropriate for high submm (Ivison et al. 2011) sources with no evidence for an AGN. This is the median value inferred for the sample of 0.2 ULIRGs of Graciá Carpio et al. (2008). It is consistent with works which show that most non active galaxies have 1.3 (Pott et al. 2006) over several orders of magnitude of .
5 Results and discussion
5.1 and
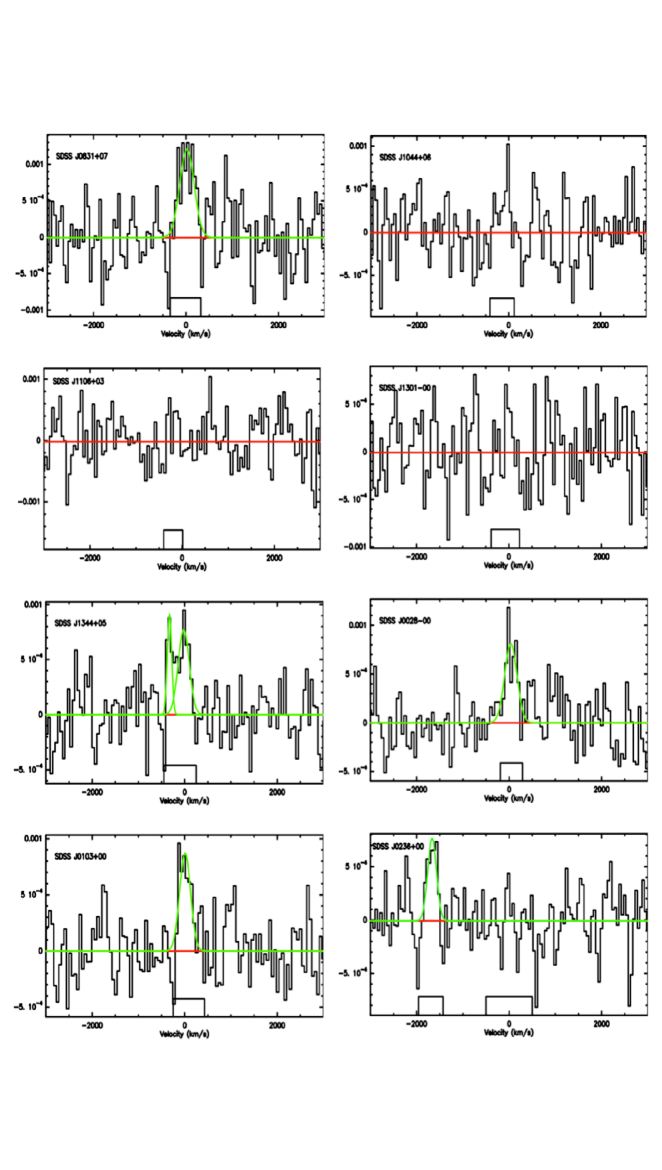
CO(1-0) detection (S/N3 over the integrated line profile) is confirmed in 5 out of the 10 quasars observed (Figs. 1, 2 and Table 2): SDSS J0831+07, SDSS J1344+05, SDSS J0028-00, SDSS J0103+00 and SDSS J0025-10. For a 6th object, SDSS J0236+00, we claim a tentative detection. The spectrum shows an emission line feature detected at 5 level with =22040 km s-1. The shift in velocity relative to [OIII]5007 is very large, with =-167030 km s-1 compared with 100 km s-1 measured for the other objects (see column (12) in Table 1). A similar case was discussed by KNC12, although these authors can confirm that the CO emission is close to the spatial position of the QSO2 radio emission.
The K-band image of SDSS J0236+00 shows a disturbed morphology (Stanford et al. 2000). There is an object located at 5 (17 kpc) NW of the quasar (thus, well within the 29″telescope beam) with a hint of a tidal tail connecting it to the quasar. However, the is unknown and it could be an unrelated source. In any case, even if this object is confirmed to be a companion, it seems unlikely that the CO line is associated with it, since the velocity shift is rather extreme for a galaxy pair (Patton et al. 2000). If the CO emission line feature is not associated with the quasar, we estimate an upper limit for 3 = 3109 K km s-1 pc2.
All 6 quasars with confirmed or tentative CO detection have several109 K km s-1pc2 (Table 2), while upper limits for the 4 non detections are 3 = several109 K km s-1 pc2. The broad band width (5000 km s-1 relative to the optical redshift) of the spectra ensures that the non detections are real, rather than due to a shift in velocity of the molecular gas emission out of the observed spectral band. For comparison, the objects with definite CO detections in KNC12 sample (0.1-0.4) have in the range (0.5-3.3)109 K km s-1 pc2, while the non detections have in all cases 3 3 109 K km s-1 pc2.
The implied molecular gas masses for our sample assuming =0.8 (K km s-1 pc2)-1 are (2-6)109 for the quasars with detections and several109 for the non detections. Masses 2109 are derived for all but one QSO2 in KNC12. Their objects have in general lower IR luminosities which can also explain the lower (see §4.2). For comparison, the Milky Way contains (2-3)109 of molecular gas (Combes 1991).
We conclude that the 20 QSO2 observed so far at 0.1-0.4 (KNC12 and our sample) have CO(1-0) luminosities in the range 5108 - 6.5109 and 4108 - 5109 . Most of these QSO2 have total IR luminosities 1012 . Larger molecular gas reservoirs 1010 will probably be found when several1012 QSO2 are investigated. We next compare with other QSO samples, as well as LIRGs and ULIRGs.
5.2 vs. , vs. and vs.
is known to correlate both with and for different types of galaxies, active and non active (e.g. Solomon & Vanden Bout 2005). These apparent correlations reflect partially a selection bias since at the highest we are sensitive only to the most luminous CO and IR emitters. However, this is unlikely the whole story and a combination of the steep decline at the highest luminosities of the and luminosity functions and the evolution of such functions with are also likely to play a role (Pérez González et al. 2005, Keres, Yun & Young 2003, Lagos et al. 2011). On the other hand, some works suggest that distant star forming galaxies were indeed much more molecular-gas rich (e.g. Tacconi et al. 2010, Daddi et al. 2010).
As in other galaxy types, the vs. correlation also reflects that more intense star formation is associated with larger contents of molecular gas. The interpretation is not so clear cut in quasars given the uncertain contribution of the AGN to the dust heating. Although is less affected than by this effect due to the dominant contribution of the AGN to (see §4.3), some contamination cannot be totally ruled out (e.g. Hiner et al. 2009).
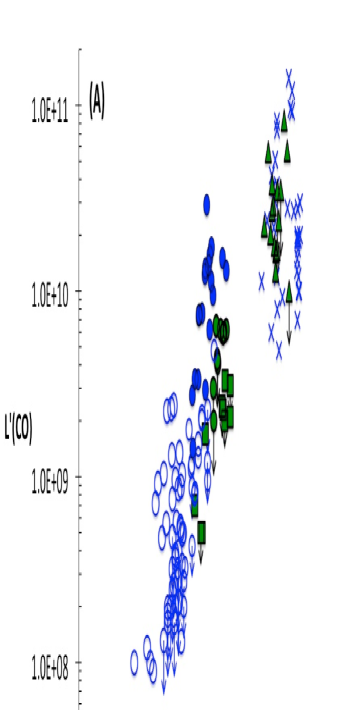
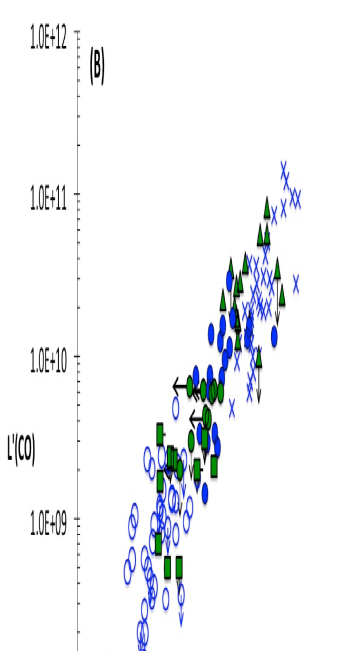
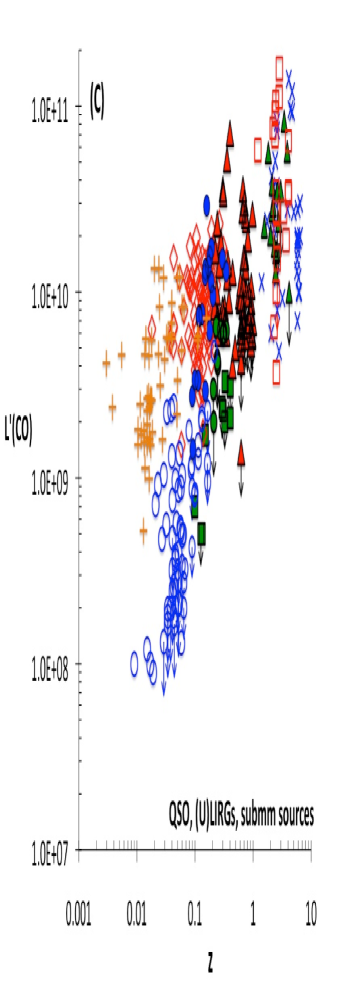
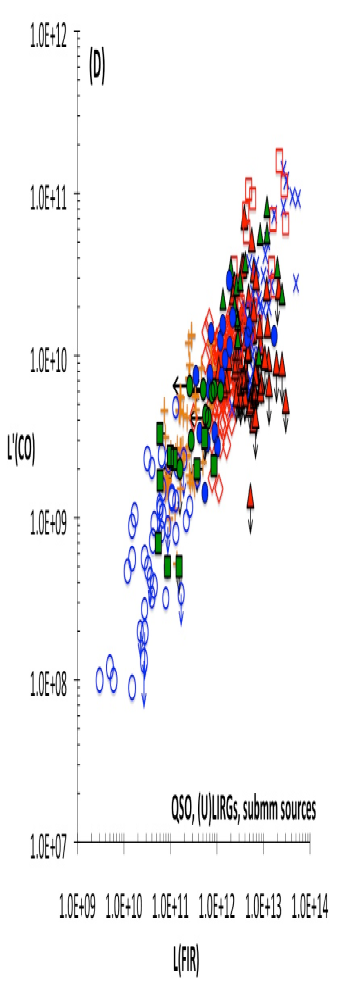
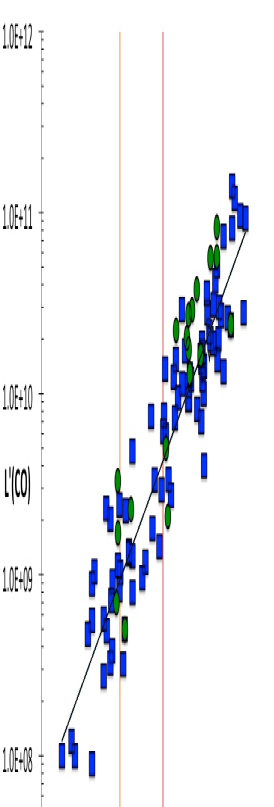
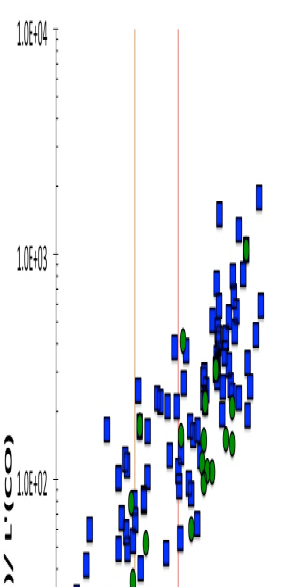
We show vs. and vs. in Fig. 3333Due to the uncertainty regarding the CO detection in SDSS J0236+00, we will use the upper limit in the discussion that follows.. Quasars only (blue and green symbols) are included on the left panels (A and B). LIRGs (orange symbols) and ULIRGs and high submm sources with no evidence for an AGN (both represented with red symbols) are added on the right panels (C and D). The well known vs. and vs. correlations for quasars is clearly appreciated in panels (A) and (B) respectively.
Quasar activity is clearly triggered in systems spanning a range of more than 4 orders of magnitude both in infrared and CO luminosities (or molecular gas content, assuming the same ). Fig. 3-C and D show that at low , all quasars with CO measurements are QSO1. In general they have lower and (for objects with available) also lower than LIRGs at similar and ULIRGs in general. The scarcity of low QSO1 with high luminosities in the LIRG regime or higher suggest that they are are intrinsically different from more distant quasars (0.1) in the diagrams. It is not clear what the difference is. Maybe the increasing incidence of major vs. minor mergers as and/or increases.
Let us focus on the 0.1-0.4 range covered by the QSO2 sample. We have enlarged the total sample of quasars studied at this intermediate by KNC12 with 19 ULIRG QSO1 from Xia et al. (2012) (blue solid circles in Fig.2) and our 10 QSO2 (green solid circles).
We find that the 20 QSO2 observed so far at intermediate fall on the vs. and vs. correlations. KNC12 found a trend for QSO2 to have lower values than QSO1 at similar 0.1-0.4 (Fig.3-A). Adding our sample and the ULIRG QSO1 at similar demonstrates that this difference is a consequence of their lower infrared luminosities. The median values for our and KNC12 samples are 6.0109 and 2.3109 K km s-1 pc2 respectively, taking into account the upper limits. On the other hand, 1011 for KNC12. med is rather uncertain for our sample given the numerous upper limits. However, considering different realistic scenarios about the possible range of values (Wu et al. 2010), 1011 is always found. Thus, our sample contains more luminous infrared sources, which explains the higher med. This is on the other hand somewhat surprising, since most objects in KNC12 are 24 m selected sources, while our sources were selected in the optical from the SDSS QSO2 database. Some unknown bias (e.g. maybe warmer or less obscured sources in KNC12) is possibly at work.
The influence of is also clear in Table 4 where we compare med and med for different samples of QSO1, QSO2, LIRGs and ULIRGs at 0.4. It can be seen that samples with similar med have also similar .
Thus, for a fixed , QSO1 and QSO2 at 0.1-0.4 are indistinguishable regarding their molecular gas content, assuming the same conversion factor applies. Comparison with (U)LIRGs reinforces that differences in are a consequence of variations in . Although the QSO2 sample is affected by small number statistics, this result, if confirmed, is consistent with the unification model of QSO1 and QSO2.
To perform a more complete and adequate comparison between QSO1 and QSO2 it is essential to expand this study in and , for both QSO1 and very specially QSO2. The low (0.1) range of QSO2 is completely unexplored, as well as the ULIRG regime at intermediate . Similarly, it will be useful to enlarge the sample of non-ULIRG QSO1 at 0.2 to ensure an overlap on both and with the QSO2 samples.
| Object | Nr. | range | med | med | ||
|---|---|---|---|---|---|---|
| class | 1011 | 109 | ||||
| QSO2 | 20 | 0.1-0.4 | 0.28 | 2.0 | 2.0 | |
| non-ULIRG QSO1 | 8 | 0.1-0.2 | 0.15 | 1.8 | 1.2 | |
| ULIRGs QSO1 | 19 | 0.1-0.3 | 0.15 | 11.9 | 9.5 | |
| LIRGs | 50 | 0.003-0.05 | 0.017 | 2.1 | 3.0 | |
| ULIRGs | 103 | 0.1-0.4 | 0.17 | 19.4 | 8.9 |
We show in Fig. 4 (top) vs. only for quasars (blue squares for QSO1 and green circles for QSO2), excluding upper limits for coherence with other works. A non-linear relation 0.68±0.10 (black solid line) is found for the QSO1 and QSO2 combined sample (black solid line). The correlation coefficient is 0.89. The fit is consistent with the best fit power law slope found by other authors (Xia et al. 2012, KNC12 ). When differentiating QSO2 and QSO1, the slopes are 0.66 and 0.70 respectively, well within the scatter, so it cannot be said whether a real difference is present. At the highest 1012 QSO2 seem to lie above QSO1. This difference is also apparent when including the upper limits for both object classes (Fig. 3-B). However, most of these objects are at high , and the measured values are affected by large uncertainties in general and poor statistics for QSO2. Thus, it is not clear that the difference is real. This further reinforces the interest of exploring the highest regime for QSO2 at different .
As already found by Xia et al. (2012), no dependence is found for the vs. slope with . Gao & Solomon (2004) found that the slope for samples of low luminosity star forming galaxies, LIRGs and ULIRGs becomes steeper as the infrared luminosity increases (the scatter in our samples of ULIRGs and LIRGs is very large and the change of slope might be masked). This change of slope has been widely discussed in the literature. Different works propose that this is due to a variation of the relative ratio between the densest molecular gas, responsible for forming stars (traced at least in low systems by HCN) and the less dense CO emitting gas (García Burillo et al. 2012, Gao & Solomon 2004).
We have computed . It is used as a tracer of the star formation efficiency () in objects where the IR luminosity is dominated by starbursts. If there is a significant contribution of the AGN to in quasars, then gives an upper limit on the . On the other hand, different works show that using the HCN luminosity instead of results in more reliable values at least for non-ULIRG systems (García Burillo et al. 2012, Graciá Carpio et al. 2006, Gao & Solomon 2004). Therefore, the interpretation of when comparing different samples is not trivial. However, provided these caveats are taken into account, the exercise can provide useful information, at least to constrain the exact role of such caveats.
vs. is shown for quasars in Fig. 4 (middle). In this case, the vertical axis does not depend on the distance. LIRGs (orange crosses) and also ULIRGs and high submm sources (all represented with red diamonds) are added in Fig. 4 (bottom). Objects with upper limits for and have been eliminated as above. Clearly correlates with (as widely discussed in the literature; e.g. Gao & Solomon 2004, Xia et al. 2012). Although the number of QSO2 is small, they also follow this trend (middle panel). At high 1012, QSO2 apparently tend to lie below QSO1, but see warning above.
The trend defined by QSO overlaps with that defined by LIRGs and ULIRGs. At a given , there is no clear shift of the QSO towards higher values relative to other samples of similar . Such a shift could be expected if the is contaminated by dust emission heated by the AGN. However, the scatter is so large that the increase in might be masked. Alternatively, such contamination might be negligible and thus, QSO would have similar star formation efficiencies than LIRGs or ULIRG of similar infrared luminosities.
5.3 CO kinematics
CO(1-0) has 180-370 km s-1 when detected (Table 2) in our QSO2 sample, using the inferred from 1-Gaussian fits to the CO(1-0) line for all objects444For the double horned profiles of SDSS J1344+05 and SDSS J0025-10, 1-Gaussain fits produce FWHM=30040 and 26520 km s-1 respectively.. These values are consistent with KNC12 who measured in the range 170-300 km s-1. SDSS J1344+05 and SDSS J0025-10 (Villar-Martín et al. 2013) show evidence of double horned line profiles, which indicates a diversity of kinematic profiles. Double peaked CO lines have been found frequently in different types of galaxies, including QSO1, radio galaxies, (U)LIRGs and high z submm galaxies (e.g. Evans et al. 2005, Bertram et al. 2007, Ocaña Flaquer et al. 2010, Narayanan et al. 2006, Daddi et al. 2010). Rotation is most frequently claimed to explain them, although an alternative explanation is mergers. This is the case of SDSS J0025-10 (Villar-Martín et al. 2013). In this double nuclei merging system, one of the two CO kinematic component is associated with the QSO nucleus and/or the intermediate region between the companion nuclei. The other CO component is associated with the northern tidal tail, including a tidal dwarf galaxy on its tip.
In general, we find that the CO line is narrower than [OIII]5007, with 1-2 (see Table 2). This effect is also observed in low QSO1 (e.g. Shields et al. 2006). The difference in probably reveals different spatial sizes and geometry of the ionized and molecular phases and a higher sensitivity of the [OIII] emission to non gravitational motions, such as outflows. Indeed Greene & Ho (2005) find that is in general broader than that of the stars in a large sample of type 2 AGNs within a broad [OIII] luminosity range ( 3 orders of magnitud, including objects with log(L8.3 typical of quasars, see §2).
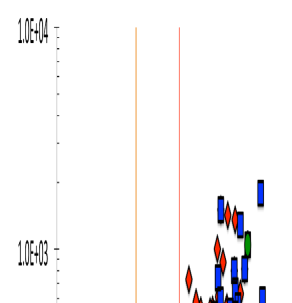
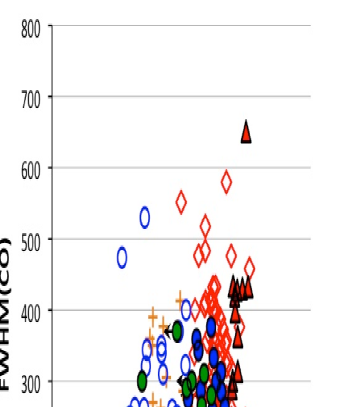
We show in Table 5 (median values) for all the samples with available data at 0.5555In those cases where only the is provided (Bertram et al. 2007, Scoville et al. 2003), the ratio =1.9 has been assumed. For comparison, the QSO1 in Xia et al. (2012) sample have ratios in the range 1.4-2.5 with a median value 1.9. , together with the median values of and (notice that these can vary relative to Table 4, since here we consider sub-samples with FWHM data and 0.5). All samples show relatively similar , in spite of the difference in . On the other hand, a trend is hinted for larger at the highest and smaller at the lowest .
is plotted vs. in Fig. 5 for the individual sources. The same symbols as in Fig. 3 are used, except that now all QSO2 (KNC12 and our sample) are represented with green solid circles. There is no correlation between and , but similar trends as in Table 5 are hinted. The broadest lines (400 km s-1) are in general only in ULIRGs, i.e. in the high regime. On the other hand, those objects with the lowest (several1010) trend to be associated with narrower CO lines. QSO2 show a range of line widths in the same range as LIRGs (they also have similar ). The difference might point to the larger incidence of galaxy mergers/interactions at the highest , as suggested by the fact that all ULIRGs show signatures of strong interactions and mergers (Sanders & Mirabel 1996)
If we focus on the 0.1-0.4 range spanned by the QSO2 sample. The range and median value of of all 10 QSO2 with available data is similar to that of QSO1 at similar . In the unification scheme of QSO1 and QSO2, this result suggests that the CO emitting gas is not coplanar with the obscuring torus. If this was the case, the would depend on the inclination and thus the type 1 vs. type 2 orientation (see also KNC12). On the other hand, it is not clear what role selection effects are playing, since CO signals with narrower FWHM are generally easier to detect for a given and velocity resolution.
has been often used as a tracer of dynamical masses in different systems, including quasars (e.g. Bothewell et al. 2013). However, the finding of large reservoirs of molecular gas shifted spatially from the quasar nucleus and associated with companion objects or tidal features shows that this is not always valid (e.g. Villar-Martín et al. 2013, Aravena et al. 2008, Papadopoulos et al. 2008; see also Bothwell et al. 2013 for a discussion). It is first essential to characterize accurately both the kinematics and spatial distribution (size, geometry) of the molecular gas.
| Object | Nr. | med | ||
| class | km s-1 | 10 | ||
| QSO2 | 0.30 | 10 | 280 | 2 |
| non ULIRG QSO1 | 0.06 | 34 | 223 | 0.6 |
| ULIRG QSO1 Xia12 | 0.15 | 17 | 275 | 11.9 |
| LIRGs | 0.02 | 18 | 253 | 1.4 |
| ULIRG | 0.14 | 91 | 304 | 16.0 |
6 Summary and conclusions
We present results of CO(1-0) spectroscopic observations of 10 SDSS type 2 quasars at 0.2-0.3 observed with the 30m IRAM radiotelescope and the Australia Telescope Compact Array. With our work, the total number QSO2 with CO observations at 1.5 increases to 20, all of which are at 0.1 0.4.
We report 5 new confirmed CO(1-0) detections and 1 tentative detection for our QSO2 sample. They have several109 K km s-1 pc2, while upper limits for the non detections are 3 = several109 K km s-1 pc2. Assuming a conversion factor =0.8, and including the sample studied by KNC12, the implied molecular gas masses for the 20 QSO2 with CO observations at 0.1-0.4 are in the range 4108 to 5109 .
We have constrained the and of our sample by fitting the mid to far infrared spectral energy distributions. The and values of Krips, Neri & Cox (2012, KNC12) sample have also been constrained more accurately. Most QSO2 (17/20) are in the LIRG regime or below with 1012 . The remaining three have 1012 , in the transition between the LIRG and ULIRG regimes. A more complete characterization of the molecular gas content of QSO2 at similar requires to expand this study to the highest several1012 . Larger molecular gas reservoirs 1010 will most probably be found.
We have been able to constrain the / ratios for 9 QSO2. In all cases, this value is in the range 1.4-1.7 with a median value of 1.5, which is lower than ratios typical of QSO1. This is consistent with a higher obscuration of the mid-infrared luminosity in QSO2 compared to QSO1 as expected.
At intermediate no difference is found on (or the molecular gas content) between QSO2 and QSO1 once the infrared luminosities are accounted for. This is consistent with the unification model of QSO1 and QSO2.
QSO2 fall on the vs. , vs. and vs. correlations defined by quasars at different . The location of the QSO2 in these diagrams is discussed in comparison with samples of QSO1, LIRGs, ULIRGs and high submm sources.
CO(1-0) has 180-370 km s-1 when detected, with a variety of kinematic profiles (single or double horned). In our sample, the CO line is in general narrower than the [OIII]5007, as observed in low QSO1. This probably reveals different spatial sizes and geometry of the ionized and molecular phases and a higher sensitivity of the [OIII] emission to non gravitational motions, such as outflows. The range and median value of of all 10 QSO2 with available data is similar to that of QSO1 at similar , although this result is tentative. In the unification scenario of QSO1 and QSO2 this result, if confirmed, suggests that that the spatial distribution of the CO(1-0) emitting gas is not related to the obscuring torus and is therefore independent of its orientation relative to the observer.
To perform a more complete and adequate comparison between QSO1 and QSO2 it is essential to expand this study in and , for both QSO1 and very specially QSO2. The low redshift (0.1) range is completely unexplored for low QSO2, as well as the ULIRG regime at intermediate z. Similarly, it will be useful to enlarge the sample of non-ULIRG QSO1 at 0.2 to ensure an overlap on both and with the QSO2 samples.
Acknowledgments
This work has been funded with support from the Spanish former Ministerio de Ciencia e Innovación through the grant AYA2010-15081. MR acknowledges support by the Spanish MINECO through grant AYA 2012-38491-C02-02, cofunded with FEDER funds. Thanks to the staff at IRAM Pico Veleta for their support during the observations. IRAM is supported by INSU/CNRS (France), MPG (Germany) and IGN (Spain). The Australia Telescope is funded by the Commonwealth of Australia for operation as a National Facility managed by CSIRO. This research has made use of the VizieR catalogue access tool (CDS, Strasbourg, France) and the NASA/IPAC Extragalactic Database (NED).
The SDSS spectra and images of the sample have been used for different issues essential to the paper. Funding for the SDSS and SDSS-II has been provided by the Alfred P. Sloan Foundation, the Participating Institutions, the National Science Foundation, the U.S. Department of Energy, the National Aeronautics and Space Administration, the Japanese Monbukagakusho, the Max Planck Society, and the Higher Education Funding Council for England. The SDSS Web Site is http://www.sdss.org/. The SDSS is managed by the Astrophysical Research Consortium for the Participating Institutions.
References
- Antonucci (1993) Antonucci R., 1993, ARA&A, 31, 473
- Antonucci & Miller (1985) Antonucci R., Miller J., 1985, ApJ, 297, 621
- Aravena et al. (2008) Aravena M., Bertoldi F., Schinnerer E., et al. 2008, A&A, 4191, 173
- Bothwell et al. (2013) Bothwell M., Smail I., Chapman S. et al. 2013, MNRAS, 429, 3047
- Bertram et al. (2007) Bertram T., Eckart A., Fischer S., Zuther J., Straubmeier C., Wisotzki L., Krips M., 2007, A&A, 470, 571
- Bessiere et al. (2012) Bessiere P., Tadhunter C., Ramos Almeida C., Villar Martín M., 2012, MNRAS, 426, 276
- Briggs (1995) Briggs D. S., 1995, PhD thesis, New Mexico Tech
- Carilli et al. (2002) Carilli C., Kohno K., Kawabe R., et al. 2002, AJ, 123, 1838
- Carilli & Wang (2006) Carilli C., Wang R., 2006, ApJ, 131, 2763
- Carilli et al. (2010) Carilli C., Daddi E., Riechers D. et al., 2010, ApJ, 714, 1407
- Coppin et al. (2008) Coppin K., Swinbank A. M., Neri R., et al. 2008, MNRAS, 389, 45
- Combes et al. (1991) Combes F., 1991, ARA&A, 29, 195
- Combes et al. (2011) Combes F., García Burillo S., Braine J., Schinnerer E., Walter F., Colina L., 2011, A&A, 528, 124
- Combes et al. (2012) Combes F., García Burillo S., Braine J., Schinnerer E., Walter F., Colina L., 2012, A&A, 550, 41
- Cox et al. (2002) Cox P., Omont A., Djorgovski S. G., et al. 2002, A&A, 387, 406
- Daddi et al. (2009) Daddi E., Dannerbauer H., Stern D., et al. 2009, ApJ, 694, 1517
- Daddi et al. (2010) Daddi E., Bournaud F., Walter F. et al. 2010, ApJ, 713, 686
- Dale & Helou (2002) Dale D., Helou G., 2002, ApJ, 576, 159
- Dasyra et al. (2006) Dasyra K.M., Taconi L.J., Davies R. et al. 2006, ApJ, 651, 835
- Dasyra et al. (2007) Dasyra K. M., Tacconi L. J., Davies R., et al. 2007, ApJ, 657, 102
- de Breuck et al. (2005) De Breuck C., Downes D., Neri R., van Breugel W., Reuland M., Omont A., Ivison R., 2005, A&A, 130, 1
- di Serego Alighieri et al. (1997) di Serego Alighieri S., Cimatti A., Fosbury R., Hes R., 1997, A&A, 328, 510
- Downes & Solomon (1998) Downes D., Solomon P., 1998, ApJ, 507, 615
- Drouart et al. (2012) Drouart G., de Breuck C., Vernet J. et al. 2012, A&A, 548, 45
- Emonts et al. (2011a) Emonts B., Norris R., Feain I. et al. 2011a, ApJ,734, L25
- Emonts et al. (2011b) Emonts B., Norris R., Feain I. et al. 2011b, MNRAS, 415, 655
- Evans et al. (2001) Evans A. S., Frayer D. T., Surace J. A., Sanders D. B., 2001, AJ, 121, 1893
- Evans et al. (2005) Evans A., Mazzarella J., Surace J., Frayer D., Iwasawa K., Sanders D., 2005, ApJS, 159, 197
- Evans et al. (2006) Evans A. S., Solomon P. M., Tacconi L., Vavilkin T., Downes D., 2006, AJ, 132, 2398
- Gao & Solomon (2004) Gao, Solomon, 2004, ApJ, 606, 271
- Gao et al. (2007) Gao Y., Carilli C., Solomon P., Vanden Bout P., 2007, ApJ, 660, 93
- García Burillo et al. (2005) García-Burillo S., Combes F., Schinnerer E., Boone F., Hunt L., 2005, A&A, 441, 1011
- García Burillo et al. (2009) García-Burillo S., Fernández García S., Combes F., Hunt L., Haan S., Schinnerer E., Boone F., Krips M., Márquez I., 2009, A&A, 496, 85
- García Burillo et al. (2012) García-Burillo S., Usero A., Alonso-Herrero A., Graciá-Carpio J., Pereira-Santaella M., Colina L., Planesas P., Arribas S., 2012, A&A, 539, 8
- Graciá Carpio et al. (2006) Graciá Carpio J., García-Burillo S., Planesas P., Colina L., 2006, ApJ, 640, L135
- Graciá Carpio et al. (2008) Graciá Carpio J., García-Burillo S., Planesas P., Fuente A., Usero A., 2008, A&A, 479, 703
- Greene & Ho (2005) Greene J., Ho L., 2005, ApJ, 627, 721
- Greene et al. (2009) Greene J., Zakamska N., Liu X., Barth A., Ho L., 2009, ApJ, 702, 441
- Greene et al. (2011) Greene J., Zakamska N., Ho L., Barth A., 2011, ApJ, 732, 9
- Greve et al. (2005) Greve T., Bertoldi F., Smail I. et al. 2005, MNRAS, 359, 1165
- Guilloteau & Forveille. (1989) Guilloteau S., Forveille T., 1989, Grenoble Image and Line Data Analysis System (GILDAS) (Saint Martin d’H res: IRAM), http://www.iram.fr/IRAMFR/GILDAS
- Heckman et al. (2004) Heckman T., Kauffmann G., Brinchmann J., Charlot S, Tremonti C., White S., 2004, ApJ, 613, 109
- Hiner et al. (2009) Hiner K., Canalizo G., Lacy M., Sajina A., Armus L., Ridgway S., Storrie Lombardi L., 2009, ApJ, 706, 508
- Hopkins et al. (2005) Hopkins P. F., Hernquist L., Martini P., Cox T. J., Robertson B., Di Matteo T., Springel V., 2005, ApJ, 625, L71
- Hopkins & Beacom (2006) Hopkins A., Beacom J., 2006, ApJ, 651, 142
- Hopkins, Richards & Hernquist (2007) Hopkins P., Richards G., Hernquist L., 2007, ApJ, 654, 753
- Humphrey et al. (2010) Humphrey A., Villar-Martín M., S nchez S. F., Mart nez-Sansigre A., González Delgado R., Pérez E., Tadhunter C., Pérez-Torres M. A., 2010, MNRAS, 408, L1
- Inskip et al. (2011) Inskip K., Jahnke K., Rix H., van de Ven G., 2011, ApJ, 739, 90
- Ivison et al. (2011) Ivison R., Papadopoulos P., Smail I., Greve T., Thomson A., Xilouris E., Chapman S., 2011, MNRAS, 412, 1913
- Keres, Yun & Young (2003) Keres D., Min S., Young J:, 2003, ApJ, 582, 659
- Krips et al. (2005) Krips M., Eckart A., Neri R. et al. 2005, A&A, 439, 75
- Krips et al. (2007) Krips M., Eckart A., Neri R., Bertram T., Straubmeier C, Fischer S., Staguhn J.G., Vogel S.N., 2007, A&A, 464, 187
- (53) Krips M., Neri R., Cox P., 2102, ApJ, 753, 135 (KNC12)
- Lacy et al. (2007) Lacy M., Sajina A., Petric A., Seymour N., Canalizo G., Ridgway E., Armus L., Sotrrie-Lombardi L., 2007, ApJ, 669, L61
- Lacy et al. (2011) Lacy M., Petric A., Mart nez-Sansigre A., Ridgway S., Sajina A., Urrutia T., Farrah D., 2011, AJ, 142, 196
- Lagos et al. (2011) Lagos C., Baugh C., Lacey C., Benson A., Kin H-S, Power C., 2011, MNRAS, 418, 1649
- Law et al. (2009) Law R., Steidel C., Erb D., Larkin J., Pettini M., Shapley A, Wright S., 2009, ApJ, 697, 2057
- Leroy et al. (2009) Leroy A., Walter F., Bigiel F., et al. 2009, AJ, 137, 4670
- Liu et al. (2009) Liu X., Zakamska N., Greene J., Strauss M., Krolik J., Heckman T., 2009, ApJ, 702, 1098
- Kennicutt (1998) Kennicutt R., 1998, ARA&A, 36, 189
- Maiolino et al. (2007) Maiolino R., Neri R., Beelen A., et al. 2007, A&A, 472, L33
- Martínez-Sansigre et al. (2006) Martínez-Sansigre A., Rawlings S., Lacy M., Fadda D., Jarvis M., Marleau F., Simpson C., Willott C., 2006, MNRAS, 370, 1479
- Marínez Sansigre et al. (2009) Martínez-Sansigre A., Karim A., Schinnerer E. et al., 2009, ApJ, 706, 184
- Middelberg, Sault & Kesteven (2006) Middelberg E., Sault R., Kesteven M., 2006, PASA, 23, 147
- Miley & de Breuck (2008) Miley G., de Breuck C., 2008, A&ARv, 15, 67
- Miller, Peacock & Mead (1990) Miller L., Peacock J., Mead A., 1990, MNRAS, 244, 207
- Narayanan et al. (2006) Narayanan W., Groppi C., Kulesa C., Walker C., 2006, ApJ, 642, 616
- Nardini et al. (2010) Nardini E., Risaliti G., Watabe Y., Salvati M., & Sani E. 2010, MNRAS, 405, 2505
- Neri et al. (2003) Neri R., Genzel R., Ivison R. et al. 203, ApJL, 597, 113
- Ocaña Flaquer et al. (2010) Ocaña Flaquer B., Leon S., Combes F., Lim J., 2010, A&A, 518, 9
- Omont (2007) Omont A., 2007, RPPh, 70, 1099
- Papadopoulos et al. (2000) Papadopoulos P., Röttgering H., van der Werf P., Guilloteau S., Omont A., van Breugel W., Tilanus R., 2000, ApJ, 528, 626
- Papadopoulos et al. (2001) Papadopoulos P., Ivison R., Carilli C., Lewis G., 2001, Nature, 409, 58
- Papadopoulos et al. (2008) Papadopoulos P., Feain I., Wagg J., Wilner D., 2008, ApJ, 648
- Papadopoulos et al. (2012) Papadopoulos P., van der Werf P., Xilouris E., Isaak K., Gao Y., 2012, ApJ, 751, 10
- Patton et al. (2000) Patton D., Carlberg R., Marzke R., Pritchet C., da Costa L., Pellegrini P., 2000, ApJ, 536, 153
- Pérez González et al. (2005) Pérez González E., Rieche G., Egami E. et al., 2005, ApJ, 630, 82
- Polletta et al. (2007) Polletta M., Tajer M., Maraschi L, Trinchieri G. et al., 2007, ApJ, 663, 81
- Polletta et al. (2008) Polletta M., Weedman D., Hönig S., Lonsdale C., Smith H., Houck J., 2008, ApJ, 675, 960
- Polleta et al. (2011) Polletta M., Nesvadba N., Neri R., Omont A., Berta S., Bergeron J., 2011, A&A, 533, 20
- Pott et al. (2006) Pott J.U., Eckart A., Krips M.,Tacconi-Garman L.E. ,Lindt E., 2006, A&A, 456, 505
- Reyes et al. (2008) Reyes R., Zakamska N., Strauss M. et al. 2008, AJ, 136, 2373
- Richards et al. (2006) Richards G., Strauss M., Fan M., et al. 2006, AJ, 131, 2766
- Riechers, Walter & Carilli (2006) Riechers D., Walter F., Carilli C. et al. 2006, ApJ, 650, 604
- Riechers, Walter & Frank (2009a) Riechers D., Walter F., Frank B., 2009a, ApJ, 703, 1338
- Riechers et al. (2009b) Riechers D., Walter F., Carilli C., Lewis G., 2009b, ApJ, 690, 485
- Riechers (2011) Riechers D., 2011, ApJ, 730, 108
- Sage (1990) Sage L.S., 1990, A&A, 239, 125
- Sanders, Scoville, Soifer (1988a) Sanders D. B., Scoville N. Z., Soifer B. T., 1988a, ApJ, 335, L1
- Sanders et al. (1988b) Sanders D., Soifer Elias E., Neugebauer G., Matthews M., 1988b, ApJ, 328, L35
- Sanders et al. (1989a) Sanders D.B., Phinney E., Neugebauer G., Soifer B., Matthews K., ApJ, 1989a, 347, 29
- Sanders et al. (1989b) Sanders D. B., Scoville N. Z., Zensus A., Soifer B.T., Wilson T., Zylka R., Steppe H., 1989b, A&A, 213, L5
- Sanders & Mirabel (1996) Sanders D.B., Mirabel F., 1996, ARA&A, 34, 749
- Schumacher et al. (2012) Schumacher H., Martínez Sansigre A., Lacy M., Rawlings S., Schinnerer E., 2012, MNRAS, 423, 2132
- Shields et al. (2006) Shields G., Menezes K., Massart C., Vanden Bout P., 2006, ApJ, 641, 683
- Scoville et al. (2003) Scoville N., Frayer D., Schinnerer E., Christopher M., 2003, ApJ, 585, L105
- Smail, Smith & Ivison (2005) Smail I., Smith G., Ivison R., 2005, ApJ, 631, 121
- Solomon, Downes & Radford (1992) Solomon P., Downes D., Radford S., 1992, ApJ, 389, L29
- Solomon & Vanden Bout (2005) Solomon P., Vanden Bout P., 2005, ARA&A, 43, 677
- Stanford et al. (2000) Stanford S., Stern D., van Breugel W., De Breuck C., 2000, ApJS, 131, 185
- Staguhn et al. (2004) Staguhn J., Schinnerer E., Eckart A., Scharwächter J., 2004, ApJ, 609, 85
- Stern et al. (2005) Stern D., Eisehhardt P., Gorjian V. et al. 2005, ApJ, 631, 163
- Szokoly et al. (2004) Szokoly G, Bergeron J., Hasinger G. et al. 2004, ApJS, 144, 271
- Tremaine et al. (2010) Tacconi L., Genzel R., Neri R. et al. 2010, Nature, 463, 781
- Tremaine et al. (2002) Tremaine S., Gebhardt K., Bender R. et al., 2002, ApJ, 754, 740
- Vernet et al. (2001) Vernet J., Fosbury R., Villar-Mart n M., Cohen M., Cimatti A., di Serego Alighieri S., Goodrich R., 2001, A&A, 366, 7
- Villar-Martín et al. (2011a) Villar-Martín M., Tadhunter C., Humphrey A., Fraga Encina R., González Delgado R., Pérez Torres M., Martínez-Sansigre A., 2011a, MNRAS, 416, 262 (VM11a)
- Villar-Martín et al. (2011b) Villar-Martín M., Humphrey, A., González Delgado R., Colina L., Arribas S., 2011b, MNRAS, 418, 2032
- Villar-Martín et al. (2012) Villar-Martín M., Cabrera Lavers A., Bessiere P., Tadhunter C., Rose M., de Breuck C., 2012, MNRAS, 423, 80
- Villar-Martín et al. (2013) Villar-Martín M., Emonts B., Rodríguez M., Pérez Torres M., Drouart G., 2013, MNRAS, in press (arXiv:1304.0396)
- Walter et al. (2004) Walter F., Carilli C., Bertoldi F. et al. 2004, ApJ, 615, L17
- Wang et al. (2010) Wang R., Carilli C., Neri R., et al. 2010, ApJ, 714, 699
- Wang et al. (2011) Wang R., Wagg J., Carilli C. L. et al. 2011a, AJ, 142, 101
- Weiss et al. (2005) Weiss A., Downes D., Walter F., Henkel C., 2005, A&A, 440, L45
- Wu et al. (2010) Wu Y., Helou G., Armus L. et al., 2010, ApJ, 723, 895
- Xia et al. (2012) Xia X. Y., Gao, Y., Hao C.-N., Tan Q., Mao S., Omont A., Flaquer B., Leon S., Cox P., 2012, ApJ, 750, 92
- Yan et al. (2010) Yan L., Tacconi L., Fiolet N., Sajina A., Omont A., Lutz D., Zamojski M., Neri R., Cox P., Dasyra K., 2010, ApJ, 714, 100
- York et al. (2000) York D. G., Adelman J., Anderson S. et al., 2000, AJ, 120, 1579
- Zakamska et al. (2003) Zakamska N., Strauss M., Krolik J. et al. 2003, AJ, 126, 2125
- Zakamska et al. (2005) Zakamska N., Schmidt G., Smith P. et al. 2005, AJ, 129, 1212
- Zakamska et al. (2008) Zakasmka N., Gómez L., Strauss M., Krolik J., 2008, ApJ, 136, 1607
Appendix A Fits of the Spectral Energy Distributions
The figures with the mid (WISE; 3.3, 4.6, 11.6, 22.1 m) to far infrared (IRAS; 60 and/or 100m) photometric data and the SED fits for our sample are shown here. The solid diamonds correspond to the detected fluxes, while open triangles indicate upper limits. When two values appear at 22-25m, these correspond to the WISE 22.1m and IRAS 25m bands. See §4.3 for more detailed information.