Phase-Resolved Infrared Spectroscopy and Photometry of V1500 Cygni, and a Search for Similar Old Classical Novae
Abstract
We present phase-resolved near-infrared photometry and spectroscopy of the classical nova V1500 Cyg to explore whether cyclotron emission is present in this system. While the spectroscopy do not indicate the presence of discrete cyclotron harmonic emission, the light curves suggest that a sizable fraction of its near-infrared fluxes are due to this component. The light curves of V1500 Cyg appear to remain dominated by emission from the heated face of the secondary star in this system. We have used infrared spectroscopy and photometry to search for other potential magnetic systems amongst old classical novae. We have found that the infrared light curves of V1974 Cyg superficially resemble those of V1500 Cyg, suggesting a highly irradiated companion. The old novae V446 Her and QV Vul have light curves with large amplitude variations like those seen in polars, suggesting they might have magnetic primaries. We extract photometry for seventy nine old novae from the 2MASS Point Source Catalog and use those data to derive the mean, un-reddened infrared colors of quiescent novae. We also extract data for these objects and find that forty five of them were detected. Surprisingly, a number of these systems were detected in the 22 m band. While two of those objects produced significant dust shells (V705 Cas and V445 Pup), the others did not. It appears that line emission from their ionized ejected shells is the most likely explanation for those detections.
Key words: novae, cataclysmic variables – infrared: stars — stars: individual (OS And, V1494 Aql, V705 Cas, V723 Cas, V1500 Cyg, V1974 Cyg, V2467 Cyg, HR Del, V446 Her, CP Lac, DP Leo, HR Lyr, V2487 Oph, V Per, GK Per, V445 Pup, V373 Sct, EU UMa, QV Vul)
1 Introduction
Classical novae (CNe) eruptions are thermonuclear runaways (TNR) on the surface of a white dwarf that has been accreting material from a low mass companion for millennia. Townsley & Bildsten (2004) show that for systems with mass accretion rates of = 10-8 to 10-10 M☉ yr-1, ignition of the TNR can occur once the accumulated envelope on the white dwarf exceeds 10-5 M☉. The resulting eruption can surpass the Eddington limit, and eject 10-4 M☉ of nuclear processed material at high velocity. The eruptions of CNe provide tests of our understanding of TNRs, the nucleosynthesis that occurs within the burning layers (e.g., Starrfield et al. 2009), and the factors that drive the outburst luminosity and shell ejection process (e.g., Shaviv 2001).
All CNe are cataclysmic variables (CVs). CVs can be separated into two broad classes: magnetic, and non-magnetic. Magnetic CVs harbor white dwarfs that have field strengths of B 1 MG, while the field strengths for the white dwarfs in non-magnetic CVs are believed to be considerably smaller (though see Warner 2004). In addition, magnetic CVs are further subdivided into two subclasses: polars, and “Intermediate Polars” (IPs). IPs are believed to have lower magnetic field strengths (B 7 MG), than polars. IPs are identified by having coherent periodicities that are shorter than their orbital periods, believed to originate from processes occurring near the magnetic poles of the rapidly rotating white dwarfs in these systems. In polars, the stronger field captures the accretion stream close to the secondary star and funnels it onto the magnetic poles of the white dwarf. Both the primary and secondary stars in polars are phase-locked to rotate at the orbital period.
That there are magnetic CVs among the old novae is already well known with such famous CNe such as DQ Her, V603 Aql, and GK Per being classified as IPs. Whether there are true polars among the CNe has not yet been fully answered. The best case for the latter is V1500 Cyg. Stockman et al. (1988) showed that V1500 Cyg exhibits strong, orbitally modulated circular polarization that they suggested comes from high-harmonic cyclotron emission. V1500 Cyg is slightly asynchronous, so it is not currently a true polar, but Schmidt & Stockman (1991) suggest it will return to synchronism within 150 yrs. Another likely highly magnetic CN is V2214 Oph. Baptista et al. (1993) compare its visual light curve to the proto-type polar AM Her (Crampton & Cowley 1977, Campbell et al. 2008a). The similarity is striking, and it is difficult to envision how such a light curve could be produced by a source other than cyclotron emission.
V1500 Cyg was a remarkable CN, having one of the largest outburst amplitudes (m 19.2 mag, Warner 1985), and one of the most rapid declines from visual maximum ever observed ( = 3.7 d; Downes & Duerbeck 2000, Strope et al. 2010). Expansion parallax measures give a distance of 1.5 kpc (Slavin et al. 1995) to V1500 Cyg, and thus an absolute magnitude at maximum of M = 10.7. The only other CN that rivals this luminosity is CP Pup, an object that Warner (1985) shows has acted in a similar fashion to V1500 Cyg. Both of these objects appear to have had outbursts that were much more luminous than that of GK Per (M = 9.4), the most luminous CN for which a high precision parallax has been derived (Harrison et al. 2013a).
V1500 Cyg is also unusual in that it is only one of two CNe that have been observed to have a dramatic pre-outburst rise, brightening by eight magnitudes in the eight months leading up to its eruption (Collazzi et al. 2009). Collazzi et al. also show that V1500 Cyg is one of five CNe (of 22) that have remained much more luminous ( 10) after outburst, compared to their pre-eruption quiescent levels. This suggests that the accretion rate in V1500 Cyg remains much higher than observed for typical CNe, and thus, as discussed by Wheeler (2012), such objects are excellent progenitor candidates for Type I supernovae.
The question is whether the presence of a strong magnetic field played any role in the unusual outburst (and current) properties of V1500 Cyg. Theoretically, it is unclear if strong magnetic fields play any role in shaping the outburst of CNe (Livio et al. 1988, Nikitin et al. 2000), so the only way to know for sure is to identify and characterize more highly magnetic CNe. We have obtained both infrared spectra and photometry of V1500 Cyg, and a small set of other old CNe to search for behavior that we can associate with the presence of a magnetic white dwarf primary. In the next section we describe our observations, in Section 3 we present the infrared spectroscopy and photometry for the program objects, in Section 4 we discuss our results, and draw our conclusions in Section 5.
2 Observations
In the following we present data from three separate observing runs using the Near Infrared Camera (“NIRC”) on Keck 1, the Simultaneous Quad Infrared Imaging Device (“SQIID”) on the KPNO 2.1 m, and the Infrared Imager (“IRIM”) on the KPNO 2.1 m. In addition, we perform a new extraction of the photometry for CNe from the 2MASS (Skrutskie et al. 2006) and catalogs to allow us to put our observations in context, as well as explore the infrared colors of quiescent CNe.
2.1 NIRC Spectra
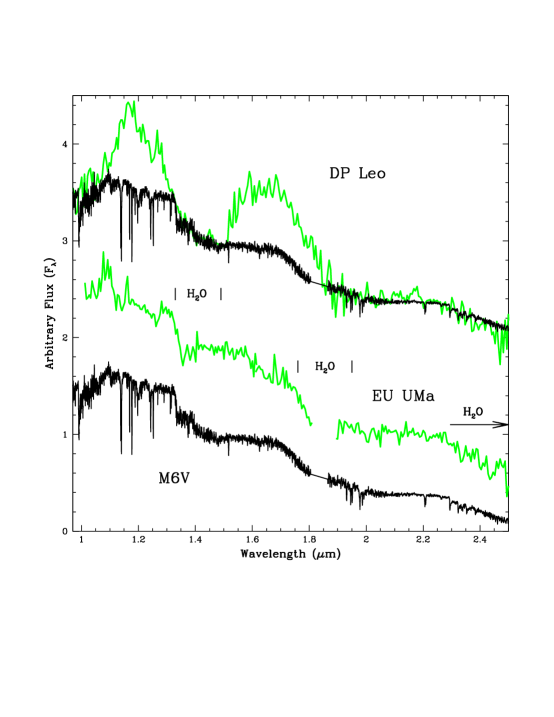
We used NIRC (Matthews & Soifer 1994) on Keck 1 on the nights of 2006 July 7 and 8 UT. NIRC (now retired) used a 256 square InSb array, with a pixel scale of 0.15 ”/pix. Besides imaging in the standard near-infrared filters, NIRC had three different grisms providing resolutions of R 60 to 120. These grisms allowed for the simultaneous observation of two adjoining infrared photometric bandpasses. We observed with the GR150 grism and the “JH” filter to obtain spectra covering the - and -bands, and with the GR120 grism and the “HK” filter to cover the - and -bands. Note that simultaneous spectra covering were not possible, so separate filter/grism moves were necessary with a subsequent set of integrations, to obtain such spectra. The individual integration times on the old novae in our project were three minutes, except for HR Lyr where two minute exposures were used. Separate integrations were obtained at two different positions along the slit to allow for background subtraction. The spectra were extracted using the standard routines inside IRAF. For wavelength calibration, the spectrum of the planetary nebula K 3-60 was used. Observations of A0V stars were obtained to provide telluric correction. The stronger H I lines intrinsic to the spectra of the A0V stars were patched-over using a simple linear fit, before division into our program object data. An observing log is presented in Table 1. The NIRC spectra of four of the old novae are shown in Fig. 1.
2.2 SQIID Data
Infrared photometry for fifteen objects was obtained using SQIID333See http//www.noao.edu/kpno/sqiid/sqiidmanual.html on the KPNO 2.1 m. SQIID obtains images simultaneously. The observation log can be found in Table 1 for the objects for which light curves were generated. To obtain sky-subtracted images, all of the program objects were observed using an ABBA pattern, where an image is obtained at an initial position (“A”), the telescope is then nodded ( 20”) to a second position (“B”), before returning to the first position. Data were flatfielded using the normal procedure, and differential aperture photometry was performed on the targets and four nearby field stars. The photometry, listed in Table 2, has been calibrated using the 2MASS data for the field stars. The other targets with data appearing in Table 2 (and that were too faint to generate useful light curves) were observed at various times during the 2006 July 10 to 15 observing run.
2.3 IRIM
IRIM444See http://www.noao.edu/kpno/manuals/irim/irim.html, now retired, used a 256 square HgCdTe NICMOS3 array. We obtained data in the filters. Unlike SQIID, images in each filter had to be obtained separately. Data were flatfielded using the normal procedure, and differential aperture photometry was performed on the targets and several nearby bright stars. The photometry has been calibrated using the 2MASS data for these stars, and is listed in Table 2. These targets (T Aur, V705 Cas, V723 Cas, DM Gem, BT Mon, and V400 Per) were observed on 1997 February 12 and 13.
2.4 2MASS Photometry
To examine the IR colors of old CNe, we extracted the photometry of these objects from the 2MASS Point Source Catalog (PSC) to allow us to make a comparison with our new observations. Hoard et al. (2002) have previously completed a search of this catalog for CVs, and presented data for three dozen CNe. We felt, however, that a re-extraction of the photometry for CNe from the 2MASS data base was warranted to determine if additional CNe might have been missed in the Hoard et al. survey. We searched the PSC for all old CNe that had secure identifications in the on-line version of the Downes et al. (2001) catalog. We then used the 2MASS survey images to verify that the source listed by the PSC was consistent with the optical counterpart of the CN (there were a significant number of CNe where this was not the case). The 2MASS ID for the correct PSC counterpart is listed, along with the photometry, in Table 3. In addition to the objects found in a search of the PSC, we extracted photometry for nine CNe for which the PSC does not list a source, but where there is clearly an object visible on the 2MASS survey images consistent with the optical counterpart. While most of these objects are faint, not all of them are (e.g., V825 Sco). The final tabulation of the 2MASS photometry for 79 CNe is listed in Table 3. All of the objects listed here erupted prior to the year 2001, except V2467 Cyg (Nova Cygni 2007). This CN was included because its mid-IR spectrum had been published (Helton et al. 2012), and those data provided context for the results discussed in Section 4.2
Table 3 also tabulates published values for the visual extinction for the detected CNe. These values came from a wide variety of sources, using a wide variety of techniques. The determination of extinction for CNe can be quite difficult, with values often ranging by a factor of two or more for the same nova. References to the sources for all of these extinction values are explicitly noted. Values of AV where multiple sources are cited are averages of the published values. An italicized value in the visual extinction column indicates an estimate made assuming that all CNe have similar colors in quiescence. This latter topic will be fully addressed in Section 4.1.
2.5 Data
Harrison et al. (2013b) found that light curve data extracted from the “All Sky Single Exposure Table” were invaluable in showing that the infrared excesses of polars were due to strong, low-harmonic cyclotron emission. To their surprise, several polars they examined had large amplitude (m 0.6 mag) variations in the bandpasses. Thus, such data might provide additional insight into the objects under study here, and thus data for the program CNe were extracted and examined when possible.
The mission (Wright et al. 2010) surveyed the entire sky in four wavelength bands: 3.4, 4.6, 12, and 22 m. The two short bandpasses (hereafter, “W1” and “W2”) are quite similar to the two short IRAC bandpasses (Jarrett et al. 2011). The 12 m channel (“W3”, = 11.56 m), is similar to that of the 12 m bandpass, while the 22 m (“W4”; = 22.09 m) bandpass closely resembles the MIPS 24 m channel (Jarrett et al. 2011). Given that mid-IR observations of old CNe might be feasible from the ground, or with , we decided to extract the data for all of the CNe listed in Table 3. Like for the 2MASS extractions above, we insured that each detection listed in the All Sky Survey Catalog555See http://wise2.ipac.caltech.edu/docs/release/allsky/expsup/index.html was consistent with both the optical candidate, as well as the 2MASS source for each object, by examining the actual images. The photometry for these objects is listed in Table 4. A significant fraction of the CNe listed in Table 4 do not appear in the All Sky Survey Catalog. To extract their fluxes, we downloaded the images, and used IRAF aperture photometry to extract their fluxes using nearby, isolated bright stars to calibrate their magnitudes (these objects have been identified in Table 4). Due to the large pixel sizes inherent to the images, several objects suffer from blending issues with a nearby field star. The listed fluxes for those sources should be used with caution.
3 Individual Objects
There are a number of methods to conclusively show the presence of a magnetic white dwarf in a CV system. Among these are orbitally modulated polarization (e.g., Stockman et al. 1988), the presence of Zeeman-split absorption lines in the photosphere of the white dwarf primary (e.g., Beuermann et al. 2007), or the direct detection of emission from cyclotron harmonics using spectroscopy. Examples of the latter have been presented by Campbell et al. (2008a,b,c).
Secondarily, one can mount a circumstantial case (as for V2214 Oph) using light curves that show “polar-like” variations. Given the spacing of the cyclotron harmonics, there can be bandpasses where there is little cyclotron emission, while an adjacent bandpass is strongly affected. One example is AM Her, where the -band is dominated by ellipsoidal variations from the secondary star, while the and -bands are dominated by cyclotron emission (see Campbell et al. 2008a). This is an excellent method that can be applied when the CV is too faint for phase-resolved spectroscopy.
The majority of classical novae are generally too faint to obtain phase-resolved near-infrared spectroscopy to ascertain whether orbitally modulated cyclotron emission is present. However, the low resolution grism mode of NIRC put many old novae within reach. To show what the spectra of two known polars look like with this instrument, we present the data for DP Leo and EU UMa in Fig. 2. Both of these objects are short period polars, having Porb 90 min (Ramsay et al. 2001, Ramsay et al. 2004). As of yet, there is no estimate of the magnetic field strength in EU UMa, but DP Leo has been reported to be a two-pole polar with B1 = 76 MG and B2 = 31 MG (Cropper & Wickramasinghe 1993).
At first glance, the NIR spectrum of DP Leo is unusual, showing peculiar, and strongly peaked - and -band continua. Such a spectrum superficially resembles those of L-dwarfs, except the water vapor features and the -band continuum seen in DP Leo do not match such (red) objects. We feel that the best match for these features is an M6V. As Fig. 2 demonstrates, the comparison of the spectrum of DP Leo to an M6V shows that it has strong excess emission in the - and -bands. A 31 MG field would have the = 2 and = 3 harmonics at 1.7 and 1.15 m, respectively. This is where the greatest deviations from the M6V spectrum occur. Thus, it is obvious that we have detected cyclotron emission from this object, and this shows the ability of NIRC to detect this type of emission in our program objects.
In contrast to DP Leo, the NIRC spectrum of EU UMa does not have obvious cyclotron emission features and, like DP Leo, the secondary star of EU UMa appears to have a spectral type near M6V (Fig. 2). There are two broad emission features located at 1.09 and 1.30 m that are consistent with the locations of He I (+ H I Pa) and H I (Pa), respectively. Given the low resolution of NIRC, these features are somewhat broader than expected if they were simply due to emission lines from He I and H I. The -band light curve of EU UMa shows large variations ( 1.5 mag), which is quite typical of polars (Fig. 3). The observed minimum in the -band light curve occurred at 03:51 UT on 2006 July 12. Extrapolating the ephemeris of EU UMa back to the time of the NIRC spectra (2006 July 8), shows that the -band minimum would have occurred at 06:46 UT on that date. Given that the JH spectra were obtained between 06:22 and 06:39 UT, indicates that these data were obtained close to the predicted time of a -band minimum. Thus, the weak emission features seen in the -band could be due to an unfavorable viewing angle to the cyclotron source and, if so, are consistent with the = 6 and 7 harmonics for a field with B = 14 MG. With this field strength, the = 3, 4, and 5 harmonics would lie at 1.52, 1.91, and 2.54 m, respectively. Unfortunately, our spectrum of EU UMa is too poor to surmise whether these weak features exist. However, there is no evidence for similar minima in the - and -band light curves, and thus the evidence for near-IR cyclotron emission from EU UMa is more ambiguous than that seen in DP Leo. Higher quality spectra and light curves will be needed to investigate this source further.
3.1 V1500 Cygni
V1500 Cyg erupted in 1975, had a large outburst amplitude, and was a very fast nova. A summary of the photometric observations of the outburst can be found in Ennis et al. (1977), while Ferland et al. (1986) present the spectroscopic evolution. Using photometric observations, Kaluzny & Semeniuk (1987) assigned an orbital period of Porb = 3.35 hr. Polarimetric observations by Stockman et al. (1988) found that the circular polarization of V1500 Cyg varied over a period that was 1.8% shorter than the photometric period. They attributed this shorter period to the underlying rotation of a magnetic white dwarf. Schmidt & Stockman (1991) showed that this rotational period is slowly lengthening, and they suggested that V1500 Cyg was an asynchronous polar that would return to synchronism in 150 yr. As they noted, (the approximately) sinusoidal polarization curves that they observed for V1500 Cyg are rarely seen in polars. They suggested that the best explanation for this behavior is that there is cyclotron emission from two separate poles on opposites sides of the white dwarf. The standard model for the behavior of circular polarization in polars suggest that it is maximized when the viewer is looking along the accretion column, and minimized when the accretion column is at right angles to the line-of-sight (when linear polarization would dominate, see Bailey et al. 1982). Thus, at the time of zero circular polarization, both accretion columns are approximately located near the limb of the white dwarf. Schmidt et al. (1995) provide an updated ephemeris for the rotation of the white dwarf, where “magnetic phase 0” in this ephemeris continues to be defined as the time of the positive zero crossing of the circular polarization.
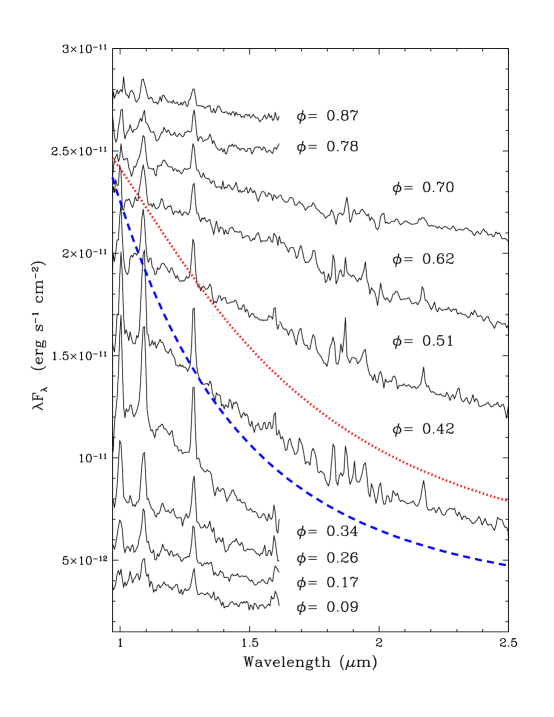
We present the phase-resolved spectra of V1500 Cyg obtained with NIRC in Fig. 4. Due to the necessity of observing in either the “JH” or “HK” bands, simultaneous data are not possible. Thus, on the first night, a nearly complete (80% of an orbit) phase-resolved JH data set was obtained, with sparser coverage with the HK grism on the second night. The spectra show dramatic evolution over an orbit, with weak emission lines near photometric phase zero, and very strong emission lines at phase 0.5. The orbital phases in this plot were determined using the (minimum light) ephemeris of Semeniuk et al. (1995a). The NIRC spectra suggest that near phase 0, the emission line region is almost completely out of view. At the epoch of the NIRC spectra, the photometric and magnetic phases were essentially identical.
As dramatic as the line evolution is over an orbit, the changing slope of the continuum is also quite apparent. Schmidt et al. (1995) modeled phase resolved UV/optical spectroscopy of this source with an irradiated M star with Teff = 3,000 K, but that has a hot face with a temperature of 8,800 K. In Fig. 4, we have plotted two blackbodies, one with a temperature of 8,800 K (blue line), and a cooler one with Teff = 3,000 K. It is clear that neither of these matches the observed continuum very well at any orbital phase. In fact, the evolution of the spectra of V1500 Cyg over an orbit are superficially similar to the phase resolved spectra of the polar VV Pup in its high state (Campbell et al. 2008b).
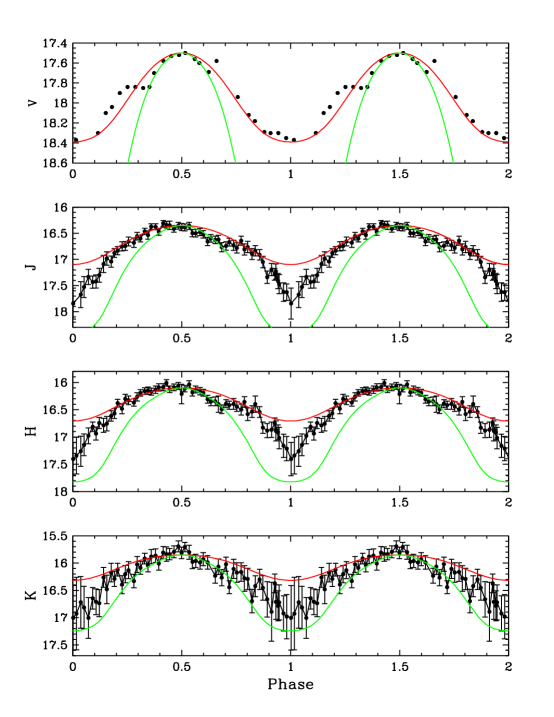
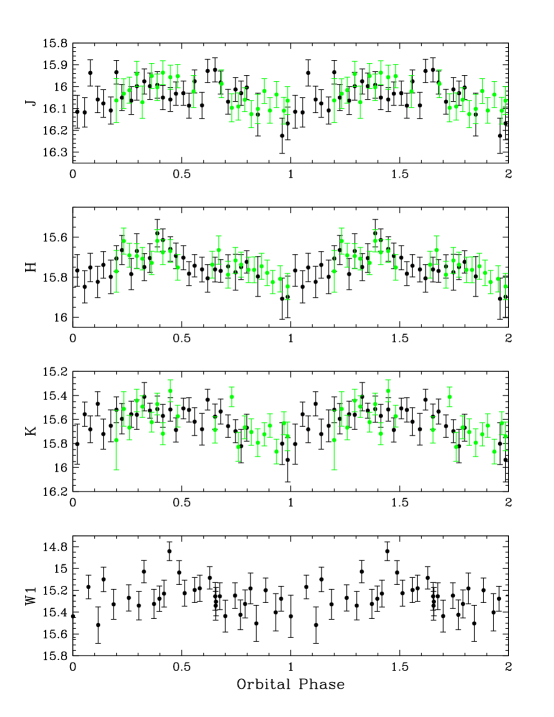
The light curves of V1500 Cyg are quite amazing (Fig. 5a), with m 1.5 mag variations in the near-IR bands. The Schmidt et al. (1995) model assumed that a very hot (Teff = 90,000 K) white dwarf irradiates the cool secondary star heating it to the point where it looks like an F star. Schmidt et al. also estimate that the orbital inclination angle is 50∘ 70∘, and list values for the masses and radii of the two stellar components. We have used the most recent release of the Wilson-Divinney (Wilson & Divinney 1971) code WD2010666ftp://ftp.astro.ufl.edu/pub/wilson/lcdc2010/ to calculate model light curves using those parameters. In addition to our data, we include the -band light curve of Semeniuk et al. (1995a) in our modeling. For this modeling we have set the minima seen in the light curves to phase 0 (corresponding to inferior conjunction of the secondary star), using just the photometric orbital period from Semeniuk et al. (1995a). We address phasing to both the true photometric and magnetic ephemerides, below. As shown in Fig. 5a, the model suggested by Schmidt et al. (green line) does not come close to reproducing the observed light curves. This is not wholly unexpected, as there is some evidence that the white dwarf primary in V1500 Cyg is slowly cooling (Somers & Naylor 1999). Thus, we explored models with cooler white dwarfs, and a wider range of inclinations. The best fitting models, holding the secondary star temperature to 3,000 K, corresponds to an orbital inclination of 30∘, and a white dwarf with a temperature of 58,500 K (red curve in Fig. 5a).
It is clear that the irradiated secondary star models cannot reproduce the very sharp minima in the light curves seen at phase 0. Since there are no reports for an eclipse of the primary by the secondary star in V1500 Cyg, this cannot be the explanation for the sharp minima we see here. It is also quite obvious that the light curves are not the perfect sinusoids that are predicted by the light curve modeling. Starting near phase 0.7, and lasting until phase 0.9, there is a subtle flattening, or excess, above the light curve model.
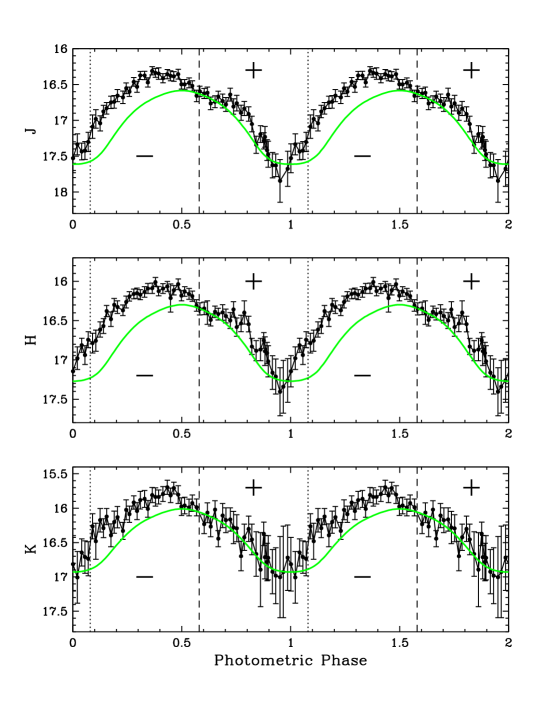
In Fig. 5b, we phase the light curves to the photometric maximum ephemeris from Semeniuk et al. (1995a). With this phasing, neither photometric maxima nor minima fall at their expected places. It is interesting to plot the location of the times of the magnetic phase zero. The timing of this event is indicated by the dashed lines in Fig. 5b. Just before the calculated time of magnetic phase zero, there is a decline/dip seen in all three near-IR light curves. Given the failure of the light curve models to explain the morphology of these light curves, and the presence of a dip near magnetic phase zero, suggests that this feature is tied to the visibility of the magnetic accretion regions.
If we assume that the two accreting magnetic poles are separated by exactly 180∘ in longitude, there should be a second self-eclipse one half phase later ( = 0.5) than that which occurs at magnetic phase 0. We indicate the location of this time in Fig. 5b with a dotted vertical line. There appears to be a small discontinuity in the light curves at the time of this event. Thus, it appears that some of the near-IR luminosity is driven by cyclotron emission from the magnetic accretion regions. It is impossible to fully quantify this emission, but if we return to the original Schmidt et al. (1995) irradiated secondary star model, and simply normalize its light curve to pass through the data at magnetic phase 0, while attempting to match the light curve minima, we can make an estimate. When this is done, we find that during the time when the circularly polarized light curve (see Schmidt et al. 1991) is dominated by negatively polarized flux, we see a strong excess in all three bandpasses. This excess disappears at = 0. The - and -band light curves show a small excess above the model light curve during the maxima of the positively circularized flux, but there is no such excess in the -band during this time.
Given this scenario, the cyclotron emission supplies about 30% of the near-IR luminosity of the system at the time of the maximum in the negative circularly polarized flux. Schmidt et al. (1995) note that, besides the circular polarization, there is little evidence in the optical for significant, modulated emission from the magnetic accretion regions. While these two results seem contradictory, it appears to be a rather common property of normal polars: both ST LMi (Cropper 1987) and AM Her (Michalsky et al. 1977) have similar levels of orbitally modulated circular polarization in the optical as V1500 Cyg, while having near-IR spectra that display large, discrete, orbitally modulated cyclotron harmonic emission features (see Campbell et al. 2008a). By inference, this suggests that the magnetic field strength in V1500 Cyg is similar to that of ST LMi and AM Her, of order B 13 MG.
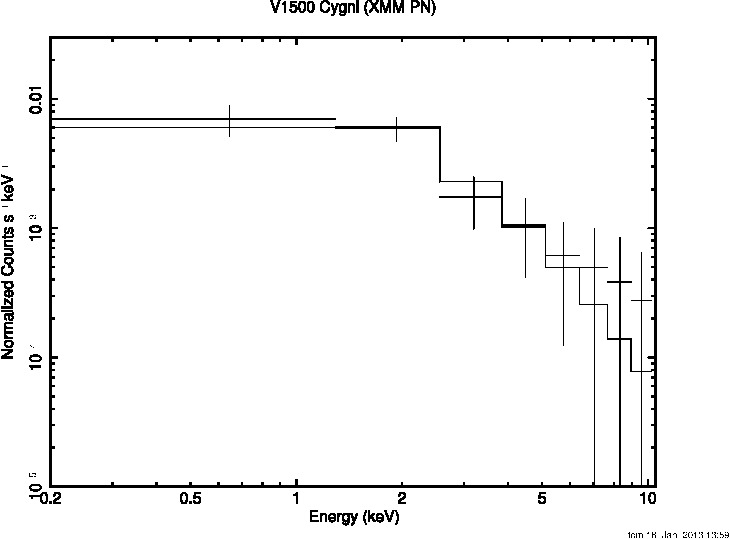
V1500 Cyg appears in the XMM Serendipitous Source Catalog (Watson et al. 2009) with a total flux in the 0.2 to 12 keV bandpass of 1.13 0.16 10-13 erg cm-2 s-1 (observation date 2002 November 2). We have downloaded the XMM data and reduced it using procedures outlined in the “XMM-Newton ABC Guide”777http://legacy.gsfc.nasa.gov/xmm/doc/xmm_abc_guide.pdf. We modeled the resulting spectrum using XSPEC888http://heasarc.gsfc.nasa.gov/docs/software/lheasoft/xanadu/xspec/manual/manual.html. The visual extinction to V1500 Cyg is AV = 1.54 mag (Ferland 1977), and this corresponds to a hydrogen column of NH = 2.8 1021 cm-2. We “froze” this parameter for all of our models. The X-ray spectra of polars have been modeled with two components: a soft blackbody, and a harder bremsstrahlung component. For example, Beuermann et al. (2008) model the data of AM Her with TBB = 27 ev, and a much harder bremsstrahlung component: Tbrems = 20 keV. Assuming this scenario for V1500 Cyg, the best fitting two component model ( = 6.8) had TBB = 92 ev, and Tbrems = 3.3 keV. However, we find that we get an identical quality of fit ( = 6.7) if we use a thermal bremsstrahlung component with Tbrems = 4.2 keV (see Fig. 6). It is obvious that if there is a soft blackbody component in V1500 Cyg, it is not as prominent as is often seen in the low states of polars (c.f., Beuermann et al. 2008). Obviously, it would be useful to have a much longer exposure X-ray observation of V1500 Cyg to better unravel the nature of its spectrum.
The distance to V1500 Cyg obtained from nebular expansion parallax methods is 1.5 kpc (Slavin et al. 1995). The unabsorbed X-ray flux in the 0.4 to 10 keV bandpass from our single component model is 1.15 10-13 erg s-1 cm-2. Thus, the X-ray luminosity in this bandpass is Lbrem = 3.1 1031 erg s-1. To put this in context, the high state hard X-ray luminosity of AM Her was observed to be Lhard = 1.6 1032 erg s-1 (Ishida et al. 1997). It is interesting to investigate the timing of the XMM observations relative to the magnetic phase of the white dwarf: 0.21 0.60. We plot the XMM EPIC PN light curve for V1500 Cyg in Fig. 7. The polarization light curve has a minimum at = 0.5, and maxima at = 0.25 and 0.75. The X-ray light curve of V1500 Cyg shows a sudden rise at the end of the observation window which is consistent with the onset of the rapid increase in the optical polarization at this phase. The maximum in the polarized flux at = 0.75 is about twice that of the maximum at = 0.25 (see Fig. 2 in Schmidt & Stockman 1991). As shown in Ramsay et al. (2000), the amount of hard X-ray flux is directly correlated with the phasing of the optical polarization. Thus, the XMM observations almost certainly did not cover the interval of maximum X-ray flux, and the true, mean hard X-ray luminosity is almost assuredly several times higher than was observed by XMM. Such a luminosity would be consistent with a polar in its high state.
3.2 V2487 Ophiuchi
V2487 Oph was the first nova to be detected in X-rays prior to its outburst (Hernanz & Sala 2002). It has now been shown that this object is a recurrent nova (RN), with a previously unrecorded outburst in 1900 (Pagnotta et al. 2009). This classification is consistent with the rapid decline, t3 = 8.2 d (Liller & Jones 1999). Interestingly, V2487 Oph was detected in hard X-rays by some four years after outburst with a flux of F(17 60 keV) = 1.65 10-11 erg s-1 cm2 (Revnitsev et al. 2008). No other RNe appear in this list of sources. All of the distance estimates to V2487 Oph are very large: 8 to 27 kpc (Hernanz & Sala 2002) and 27 to 48 kpc (Burlak 2008). The distance estimates from Hernanz & Sala were derived by assuming emission from a soft (Teff = 30 eV) blackbody with an effective area of a white dwarf. The larger distances are from the maximum magnitude, rate of decay (MMRD, “t2” or “t3”) relations. It is not clear that an MMRD derived for CNe is appropriate for RNe (as shown in Harrison et al. 2013a, the various MMRD relations do not work especially well for CNe). For example, the RN U Sco had t3 5 d in its 1999 outburst which peaked at mv 7.5 (Munari et al. 1999). Using the MMRD in Downes & Duerbeck (2000), one would estimate MV(max) = 10.2 for U Sco, and incorporating its line-of-sight extinction (AV 1.2 mags), derive a distance of 20 kpc. Hachisu et al. (2000) argue for distances of 4 to 6 kpc for U Sco. Schaefer (2010) has performed an indepth study of the Galactic RNe, and argues for a distance of 12 kpc to U Sco based on the properties of its secondary star. He then argues that V2487 Oph is probably at roughly the same distance as U Sco.
As Fig. 1 shows, the spectrum of V2487 Oph is blue, and has prominent H I and He I emission lines. There is no hint of a secondary star in these data. We can estimate the extinction to V2487 Oph by assuming that part of the infrared color excess is due to interstellar extinction. Table 2 lists the mean infrared photometry for V2487 Oph, and assuming that the IR colors of this RN are similar to those of old CNe (derived below), we calculate a value of AV = 2.2 mag. Schaefer (2010) estimates AV = 1.5 0.6. If, like U Sco, the fluxes of V2487 Oph are partially contaminated by its secondary star, the extinction value we derive will be too high. The IRSA and NED extinction calculators estimate the total line-of-sight extinction in this direction to be 2.4 and 3.3 mags, respectively. This indicates that the larger distances for V2487 Oph (which put it on the outskirts of the galactic bulge) are probably incorrect. Given its peak outburst magnitude of mv = 9, and its slower decay, distances of d 8 kpc seem more appropriate. At such distances, it would be the most luminous CV in the database.
The orbital period of V2487 Oph remains unknown. The infrared light curve presented in Fig. 8 spans 2.9 hr, and there is only a slight brightening over this interval. There are no large scale variations that would indicate an irradiated secondary star, or cyclotron emission regions. These results, along with its large X-ray luminosity, make V2487 Oph an excellent IP candidate. While several IPs are old CNe, V2487 Oph could be the first IP that is an RN. [Though it has been suggested that the multi-periodic variations in the visual light curve of the RN T Pyx indicate the presence of a magnetic white dwarf primary (Patterson et al. 1998), the existing X-ray data do not appear to support this conclusion (Selvelli et al. 2008).]
3.3 HR Lyrae, OS Andromedae and V373 Scuti
We obtained NIRC spectra for three other old novae that were accessible during our observing run: HR Lyr, OS And, and V373 Sct. HR Lyr was a moderate speed nova (t3 = 97 d; Shears & Poyner 2007) that erupted in 1919, OS And was a fast nova (t3 = 25 d; Kato & Hachisu 2007) that erupted in 1986, and V373 Sct was a moderate speed nova (t3 = 79 d; Strope et al. 2010) that erupted in 1975. HR Lyr remains surprisingly bright in the near-IR ( = 14.8), while neither OS And or V373 Sct are visible on the 2MASS images (though Szkody 1994 reports = 17.8 for OS And in 1988). HR Lyr has the bluest continuum of any of the CNe while OS And and V373 Sct have much flatter spectra. The H I and He I emission lines in all three of these objects are less prominent than those of V1500 Cyg. In addition, none of these sources have reported X-ray detections (including a 5.2 ksec pointed observation of OS And), and thus do not appear to be good cases for magnetic CVs.
3.4 The Light Curves of V1974 Cygni, V446 Herculis, QV Vulpeculae, V Persei and CP Lacertae
We obtained light curves for five old novae: V1974 Cyg (Fig. 9), V446 Her (Fig. 10), QV Vul (Fig. 11), V Per (Fig. 12), and CP Lac (Fig. 13). As noted earlier, the light curves of polars can show large variations in one or more bandpasses, while not showing variations in an adjoining bandpass. Of these five novae, the light curves of both V1974 Cyg and V446 Her show significant variations over their orbits. The -band light curve of V1974 Cyg is reminiscent of that for V1500 Cyg, and both the - and -band light curves show what appears to be a minimum near the same time as that seen in the -band. This same level of variability is also present in the W1 light curve. It is also important to note that Collazzi et al. (2009) demonstrate that, like V1500 Cyg, V1974 Cyg has remained much more luminous after outburst than it was prior to its eruption. V1974 Cyg was observed to be a supersoft X-ray source that was first detected with some 265 days after outburst (Balman et al. 1998). There do not appear to have been any recent X-ray observations of V1974 Cyg.
The light curve for V446 Her shows a brightening in all three bands, followed by a sudden drop. The morphology and amplitude of these variations are very similar to those seen in the optical light curves of OU Vir (Mason et al. 2002). Mason et al. explain those light curves by invoking a high inclination system (60∘ 70∘) with a large, optically thick accretion disk hot spot. In V446 Her, however, the observed modulation is larger, and better-defined in the - and -bandpasses than it is in -band. One would expect that a hot spot would have blue colors, and be more prominent at shorter wavelengths. Perhaps other sources in the system dilute the contribution of the hot spot in the -band. The W1 and W2 light curves for V446 Her show m = 0.4 mag variations over an orbital period, but those data are too sparse to compare with the light curves. There is a weak (0.0196 counts s-1) source located within 35” of the position of V446 Her. This position is within the typical error bars for weak sources in the “WGA” catalog (White et al. 1995).
As shown by Honeycutt et al. (2011), V446 Her exhibits what appear to be rather normal, and quite frequent, dwarf nova eruptions. The pre-outburst light curve presented by Collazzi et al. (2009) suggests that these events were probably occurring in the decades prior to the CNe eruption. Because they lack accretion disks, such outbursts do not occur in polars. Thus, the white dwarf in V446 Her is not highly magnetic. GK Per is the only other CNe that is known to show dwarf nova outbursts (c.f. Bianchini et al. 1982). V446 Her is certainly a source that deserves follow-up X-ray observations to determine whether it, like GK Per, is an IP.
The SQIID observations of QV Vul were interrupted by clouds, and thus there is a gap of nearly 2 hours in its light curve. The orbital period of QV Vul remains unknown, but our data suggests that the period is almost certainly in excess of two hours. The - and -band light curves show little variation, but the -band light curve reveals large amplitude variations, consistent with those seen in polars. There is a pointed (2.6 ksec) observation for QV Vul (obtained in 1995, eight years after outburst) that shows a very weak source (S/N 3) at the correct position. The combination of large amplitude variations and X-ray emission are suggestive of a magnetic CV. Higher quality data, with better temporal coverage are needed.
In contrast, the light curves for V Per and CP Lac show no significant variations, though both objects are faint, and the photometric data has much larger errors. There is a pointed observation for CP Lac that shows a very weak source, 0.0032 counts sec-1, at the correct position for this old nova. No such detection exists for V Per.
4 Discussion
While there have been numerous claims for old novae having magnetic white dwarfs, the majority of these usually suggest that the system is an IP. The two best cases for polars remain V1500 Cyg and V2214 Oph. Our phase-resolved spectroscopy did not show any evidence for discrete cyclotron features from V1500 Cyg. Examination of the light curves, however, indicate the presence of excess, phase-dependent emission that contributes up to 30% of the broadband flux when the circular polarization is at its maximum. The light curves of V1974 Cyg strongly resemble those of V1500 Cyg. This nova erupted more recently (1992), and is the most recent of the CNe for which we obtained light curves. Thus, irradiation by a hot white dwarf is certainly a viable interpretation of those data. That both V1500 Cyg and V1974 Cyg have remained much more luminous after their outbursts than seen prior to their eruptions, strengthens the case for V1974 Cyg harboring a highly magnetic white dwarf. Two other objects in our sample, V446 Her and QV Vul, had light curves that showed large amplitude variations that are similar to the light curves of polars, though V446 Her shows dwarf novae outbursts which rules out such a classification. Both of these objects do appear to be X-ray sources, and thus new X-ray observations of all these CNe would be useful to explore whether they harbor magnetic white dwarfs.
4.1 The Colors of Quiescent CNe
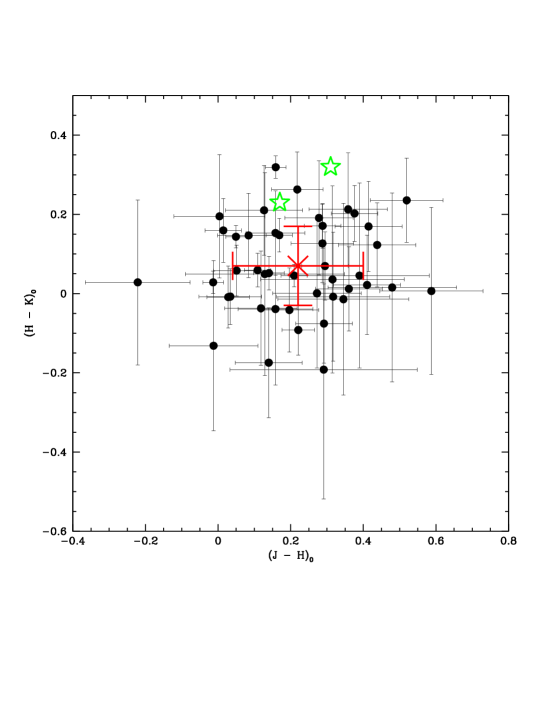
To examine whether the current infrared colors of V1500 Cyg are unusual, allowing us a quicker way to identify similar systems amongst old CNe, we extracted the photometry of CNe in the 2MASS catalog. With these data in hand, we can examine the de-reddened colors of old CNe. We present an infrared color-color plot in Fig. 14. The mean de-reddened colors of old CNe are ( )o = 0.22 0.18 and ( )o = 0.07 0.10 (note: all recent novae and RNe have been excluded from this calculation, as have objects with S/N 3 in their photometry, along with GK Per and RR Tel, two objects that have IR colors dominated by their secondary stars). In Fig. 14 we also plot the position of V1500 Cyg at maximum and minimum light (as stars). V1500 Cyg is redder at minimum than maximum, but these colors are not especially unusual when compared to those of other old CNe. Without the light curves, there would be nothing to indicate that V1500 Cyg had unusual photometric properties.
With a mean infrared color relation defined for old novae, we can attempt to use it to estimate the visual extinction for CNe that lack such estimates, as well as compare how well this technique reproduces published values of AV for these objects. These estimates are the (first) italicized values in the final column of Table 3. Szkody (1994) obtained optical and IR photometry for a large sample of old novae, and defined the mean de-reddened colors of novae in both ( ) and ( ). Using -band photometry of the CNe (from Szkody 1994, or Duerbeck & Seitter 1987), and the 2MASS -band photometry, we have estimated extinctions using the relation ( )o = 0.27 (Szkody 1994), where possible. If there is a second italicized value in the final column of Table 3, it results from this estimation technique.
It is always dangerous to assume a global correlation for a diverse group of objects, and thus it is worthwhile to qualitatively assess the reddenings derived from the near-IR photometry. The orbital periods of the objects in this table range from 48 hr for GK Per down to 1.5 hr for CP Pup (though see Diaz & Steiner 1991, who suggest CP Pup is an IP, and that this is the white dwarf spin period). Thus, to fill their Roche lobes and transfer matter to their white dwarf primaries, the secondary stars in these systems must range in size from subgiants, down to M dwarfs. As shown in infrared spectroscopic surveys (e.g., Harrison et al. 2004), most CVs with Porb 3 hr show absorption line features attributable to their secondary stars. For shorter period systems (Porb 2 hr), the secondary stars are much more difficult to detect (e.g., Hamilton et al. 2011). Thus, assuming that hot sources completely dominate the colors of old CNe should be assumed with caution for longer period CNe.
A cursory inspection of the estimated extinction values presented in Table 3, however, shows that assuming mean, quiescent infrared colors for old CNe is a useful technique for estimating extinction values. For objects with high quality photometry, the estimated extinction values are quite similar to the previous published values, especially if several values were averaged to produce the AV measurement. In general, all disk-dominated CVs are blue, with their spectra being dominated by emission from the white dwarf and accretion disk hotspot. In the near-IR, we observe these sources on the Rayleigh-Jeans tail of those blackbodies. And thus, if there is no significant contamination from the secondary star, such a technique is fairly robust. It is important to note that a great variety of techniques were used to derive the “known” extinction values and these themselves are prone to significant uncertainties (c.f., Lance et al. 1988 for a discussion of the reddening estimates for V1500 Cyg), or were derived assuming some sort of photometric relationship not unlike that used here (e.g., Weight et al. 1994, Miroshnichenko 1988).
The main weaknesses of this technique are twofold: 1) infrared colors are not very sensitive to low values of extinction, and 2) the secondary star could contaminate the quiescent colors of longer period CNe. Examples of the first weakness are demonstrated by the estimated AV values for RR Pic, V533 Her, and HR Del, objects with well-determined, but low values of extinction. If there are near-IR excesses for these three objects, they are lost in the noise of the relationship. In contrast, two objects that appear to have values of their estimated extinctions that are too large when compared to the previously published values, QZ Aur (Porb = 8.6 hr) and BT Mon (Porb = 8.0 hr), are longer period CNe binaries that been shown to have secondary stars which are detectable in visual data (Campbell & Shafter 1995, Smith et al. 1998). Clearly, the secondary stars in these two systems must contaminate the photometry at a level sufficient to produce the unrealistically large values of their estimated extinctions. Alternatively, excessively large values of the estimated reddening for some CNe might indicate cases of source confusion, especially if the previously published extinction value was determined near outburst.
4.2 and Data for CNe
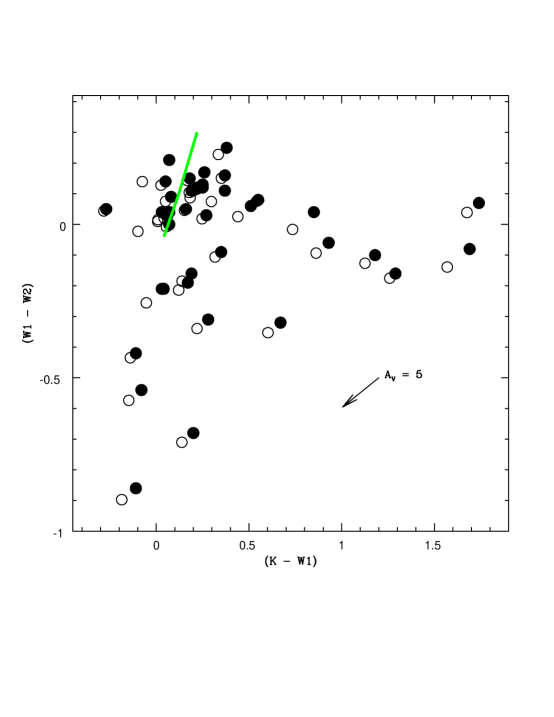
As shown above, we have extracted light curve data from the “All Sky Single Exposure Table” to compare to our light curves for a couple of sources. Given the value of such data for easily detecting the presence of strong, low-harmonic cyclotron emission (see Harrison et al. 2013b), we decided to extract photometry for all of the CNe with 2MASS detections. Those data are listed in Table 4. From that photometry we constructed a color-color plot using the 2MASS -band magnitudes and the W1 and W2-band photometry shown in Fig. 15. In this figure we have plotted the locus of main sequence star colors in green. A large group of old CNe appear to have colors consistent with main sequence stars. While it is possible that this might be due to these objects having returned to a deep quiescence, having their IR colors dominated by their donor stars, it is probably just as likely that a number of these detections are the result of source confusion. The bright, isolated CNe (e.g., DQ Her, V603 Aql, HR Del) have very blue (W1 W2) colors, suggesting that candidates with (W1 W2) 0.0 are true CNe remnants.
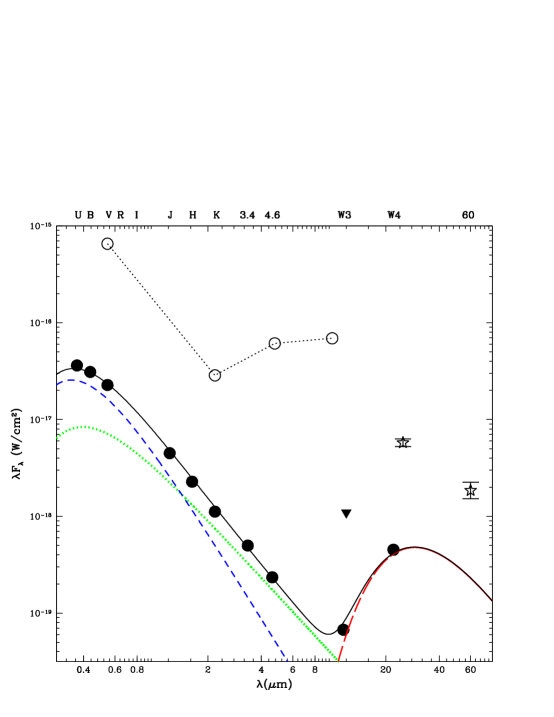
Surprisingly, there were eight detections of CNe in the 22 m bandpass: V705 Cas (Nova Cas 1993), V1974 Cyg (Nova Cygni 1992), V2467 Cyg (Nova Cygni 2007), V1494 Aql (Nova Aql 1999), V445 Pup (Nova Pup 2000), GK Per (Nova Per 1901), RR Tel (Nova Tel 1944) and HR Del (Nova Del 1967). We plot the SEDs of the first six of these in Fig. 16, and HR Del in Fig. 17. For V445 Pup and V2467 Cyg, the 2MASS data was obtained prior to their outbursts. Of the recent CNe in this set, both V705 Cas (Evans et al. 2005, and references therein) and V445 Pup (Lynch et al. 2001) produced significant dust shells that can explain the observed SEDs with their strong W3 and W4-band excesses. It is interesting, however, that V2467 Cyg, V1494 Aql, and V1974 Cyg did not appear to produce dust shells (see Helton et al. 2012, and references therein). Helton et al. used observations to show that the mid-IR spectra of all three CNe were dominated by emission lines. Presumably, this line emission continues to dominate the mid-IR SEDs of these three CNe, unless there have been recent, unexpected episodes of dust formation. That V1974 Cyg shows near-IR photometric variations similar to those of V1500 Cyg, suggests that the central source in this object remains sufficiently luminous to irradiate its secondary star, and thus could provide the ionizing radiation necessary to produce strong line emission from its ejected shell. Such a conclusion is bolstered by the fact that there is a source (objid = 6371619514870663991, observation date = 2011 September 11) with an NUV magnitude of 18.69 0.08, at the position of V1974 Cyg.
As noted above, the secondary star of GK Per dominates its SED from the optical into the mid-IR (see Harrison et al. 2007). The long wavelength excess of GK Per above that of its secondary star (see Fig. 16), culminating in the detection in the W4 bandpass, can be explained as either due to bremsstrahlung emission (see Harrison et al. 2013b), or perhaps due to synchrotron emission as seen in its IP cousins AE Aqr and V1223 Sgr (Harrison et al. 2007, 2010). Since the time of the mission, RR Tel has been re-categorized as a symbiotic star with an accretion disk (Lee & Park 1999), containing a bright red giant secondary star, and this component dominates its infrared SED (Harrison 1992). An spectrum of RR Tel (Harrison & Gehrz 1988) showed a strong silicate emission feature. We have not plotted its SED due to its non-CNe nature.
Of all of the CNe detected in the W4 band it is HR Del that is the most surprising. Geisel et al. (1970, “GKL”) presented sparse photometry of this object near outburst, and about three years later (t = +1150 d). They estimated a dust temperature of 300 K for the latter date. Harrison & Gehrz (1988), Callus et al. (1987) and Dinerstein (1986) reported detections of HR Del. Re-extraction of the data (see below) finds 25 and 60 m detections of this source with flux densities of 480 43 and 370 72 mJy, respectively. We have plotted the data from GKL, , 2MASS, and in Fig. 17. In addition, we include photometry from Bruch & Engel (1994). Since the time of the GKL observations to present day, HR Del has declined by 3.65 mag in the -band. photometry from 1979 (Drechsel & Rahe 1980) showed that HR Del had = 12.23, while more recent photometry (circa 2008) finds an orbitally averaged value of = 12.45, with maxima reaching = 12.25 (Friedjung et al. 2010). The AAVSO visual light curve of HR Del shows no changes between 1979 and 1983, the year of the mission. Recent AAVSO -band photometry finds no obvious changes since 2008. HR Del might have been slightly brighter in 1983 as it is currently, but not significantly so. In contrast to V1974 Cyg, Collazzi et al. (2009) found that the pre- and post-eruption brightnesses of HR Del were very similar.
Comparison of the GKL data set to the and data suggest a dust shell that has dimmed and cooled in the intervening time. Strangely, however, there does not seem to have been an appreciable change in temperature of this putative dust shell between the epochs of the and missions. Both data sets can be fitted with blackbodies having temperatures Tbb 125 K. Perhaps like the dust-free CNe observed by , it is line emission that is producing the mid-IR excess in HR Del. Such a scenario remains viable as, according to Friedjung et al. (2010), the ultraviolet luminosity of HR Del has changed little over the last thirty years. They suggest that continued thermonuclear burning is the best explanation for this prolonged period of activity. It would be useful to get spectra to ascertain the nature of the mid-IR excess of HR Del.
Harrison & Gehrz (1988, 1991, 1992, 1994) published a series of papers on observations of CNe and concluded that the detection rate was of order 40% away from the Galactic Center. In the intervening decades, the “1D” scan co-addition software SCANPI999http://scanpiops.ipac.caltech.edu:9000/applications/Scanpi/ used in those surveys has been markedly improved. Input of the list of objects listed in Table 3 into SCANPI, and using the selection criteria of Harrison & Gehrz (1988), results in nine detections in the 12 and/or 25 m bandpasses (excluding GQ Mus and V341 Nor which were in outburst during the mission). Of these, only the 25 m detection of HR Del is consistent with the detection of the CNe remnant. The other eight detections were all the result of source confusion due to a nearby object that is identifiable in the images. Thus, of the approximately 160 CNe surveyed with , only HR Del and DQ Her (see Harrison et al. 2013a) are confirmed as detections of the quiescent novae. Old CNe are not luminous mid/far-infrared sources.
5 Conclusions
We have obtained phase resolved near-infrared photometry and spectroscopy of V1500 Cyg to search for cyclotron emission in this object to confirm that it is a highly magnetic polar. While evidence for significant cyclotron emission exists, it is impossible to make secure estimates of its contribution to the overall flux as it depends on the model used for the underlying binary. What is needed is a fuller set of phase-resolved spectra to separate-out the flux of the component that is modulated at the spin period of the white dwarf. The data sets for several of the other CNe are intriguing, and suggest that follow-up X-ray observations might be useful in confirming whether additional magnetic systems exist among old CNe. That both V1500 Cyg and V1974 Cyg remain much more luminous now compared to their pre-outburst levels, and that they have similar light curves, suggests that V1974 Cyg might also harbor a highly magnetic white dwarf. If this can be proven, perhaps one way to identify magnetic systems is specifically targeting those CNe that show a large difference between their pre-, and post-outburst luminosities.
The W4 band data for several systems indicates that strong mid-IR line emission continues to be emitted by some CNe decades after their outbursts. Such emission requires a luminous, ionizing source, and suggests that some CNe may continue to have stable nuclear burning occurring on the surfaces of their white dwarf primaries. The majority of quiescent old CNe do not have significant mid/far-infrared emission.
References
Austin, S. J., Wagner, R. M., Starrfield, S., Shore, S. N., Sonneborn, G.,
& Bertram, R. 1996, AJ, 111, 869
Bailey, J., Hough, J. H., Axon, D. J., Gatley, I., Lee, T. J., Szkody, P., Stokes, G., & Berriman, G. 1982, MNRAS, 199, 801
Balman, S., Krautter, J., & Ogelman, H. 1998, ApJ, 499, 395
Baptista, R., Jablonski, F. J., Cieslinski, D., Steiner, J. E. 1993, ApJ, 406, 67
Beuermann, K., El Kholy, E., & Reinsch, K. 2008, A&A, 481, 771
Beuermann, K., Euchner, F., Reinsch, K., Jordan, S., & Gänsicke, B. T. 2007, A&A, 463, 647
Bianchini, A., Hamazaoglu, E., & Sabbadin, F. 1981, A&A, 99, 392
Bruch, A. & Engel, A. 1994, A&A Supp., 104, 79
Burlak, M. A. 2008, Astronomy Letters, 34, 249
Callus, C. M., Evans, A., Albinson, J. S., Mitchell, R. M., Bode, M. F., Jameson, R. F., King, A. R., & Sherrington, M. 1987, MNRAS, 229, 539
Campbell, R. D. & Shafter, A. W. 1995, ApJ, 440, 336
Campbell, R. K., et al. 2008a, ApJ, 683, 409
Campbell, R. K., et al. 2008b, ApJ, 678, 1304
Campbell, R. K., et al. 2008c, ApJ, 672, 531
Collazzi, A. C., Schaefer, B. E., Xiao, L., Pagnotta, A., Kroll, P., & Löchel, K. 2009, ApJ, 138, 1846
Crampton, D. & Cowley, A. P. 1977, PASP, 89, 374
Cropper, M., & Wickramasinghe, D. T. 1993, MNRAS, 260, 696
Cropper, M. 1987, ApSS, 131, 651
Diaz, M. P., & Steiner, J. E. 1991, PASP, 103, 964
Dinerstien, H. L. 1986, AJ, 92, 1381
Downes, R. A., & Duerbeck, H. W., 2000, AJ, 120, 2007
Downes, R. E., Webbink, & Shara, M. M., Ritter, H., Kolb, U., & Duerbeck, H. W. 2001, PASP, 113, 764
Duerbeck, H. W. 1981, PASP, 93, 165
Drechsel, H. & Rahe, J. 1980, IBVS 1811
Duerbeck, H. W., & Seitter, W. C. 1987, Ap&SS, 131, 467
Ennis, D., Beckwith, S., Gatley, I., Matthews, K., Becklin, E. E., Elias, J., Neugebauer, G., & Willner, S. P. 1977, ApJ, 214, 478
Evans, A., Tyne, V. H., Smith, O., Geballe, T. R., Rawlings, J. M. C., & Eyres, S. P. S. 2005, MNRAS, 360, 1483
Ferland, G. J., Lambert, D. L., & Woodman, J. H. 1986, ApJS, 60, 375
Ferland, G. J. 1977, ApJ, 215, 873
Friedjung, M., Dennefeld, M., & Voloshina, I. 2010, A&A, 521, 84
Geisel, S. L., Kleinmann, D. E., & Low, F. J. 1970 (“GKL”), ApJ, 161, L101
Gilmozzi, R., Selvelli, P. L., & Cassatella, A. 1994, Mem. Soc. Astron. Italiana, 65. 199
Hachisu, I., Kato, M., Kato, T., Matsumoto, K., & Nomoto, K. 2000, ApJ, 534, L189
Hamilton, R. T., Harrison, T. E., Tappert, C., & Howell, S. B. 2001, ApJ, 728, 16
Harrison, T. E., Bornak, J., McArthur, B. E., & Benedict, G. G. 2013a, ApJ, 767, 7
Harrison, T. E., Hamilton, E. T., Tappert, C., Hoffman, D. I., & Campbell, R. K. 2013b, AJ, 145, 19
Harrison, T. E., Bornak, J. E., Rupen, M. P., & Howell, S. B. 2010, ApJ, 710 325
Harrison, T. E., Campbell, R. K., Howell, S. B., Cordova, F. A., & Schwope, Harrison, T. E., Osborne, H. L., & Howell, S. B. 2004, AJ, 127, 3493
A. D. 2007, ApJ, 656, 455
Harrison, T. E., & Gehrz, R. D. 1994, AJ, 108, 1899
Harrison, T. E. 1992, MNRAS, 259, 17
Harrison, T., & Gehrz, R. D. 1992, AJ, 103, 243
Harrison, T. E., & Gehrz, R. D. 1991, AJ, 101, 587
Harrison, T. E., & Gehrz, R. D. 1988, AJ, 96, 1001
Harrison, T. E. 1989, PhD Thesis, University of Minnesota, Minneapolis
Helton, L. A., Gehrz, R. D., Woodward, C. E., Wagner, R. M., Vacca, W. D., Evans, A., Krautter, J., Schwarz, G. J., Shenoy, D. P., & Starrfield, S. 2012, ApJ, 755, 37
Henize, K. G., & Liller, W. 1975, ApJ, 200, 694
Hernanz, M. & Sala, G. 2002, Sci., 298, 393
Hoard, D. W., Brinkworth, C. S., & Wachter, S. 2002, ApJ, 565, 511
Honneycutt, R. K., Robertson, J. W., & Kafka, S. 2011, AJ, 141, 121
Hric, L., Petrik, K., Urban, Z., & Hanzl, D. 1998, A&AS, 133, 211
Iijima, T., & Nakanishi, H. 2008, A&A, 482, 865
Iijima, T., & Esenoglu, H. H. 2003, A&A, 404, 997
Ishida, M., Matsuzaki, K., Fujimoto, R., Mukai, K., & Osborne, J. P. 1997, MNRAS, 287, 651
Jarrett, T. H., Cohen, M., Masci, F., et al. 2011, ApJ, 735, 112
Kaluzny, J. & Semeniuk, I. 1987, Acta. Astron., 37, 349
Kato, M., & Hachisu, I. 2007, ApJ, 657, 1004
Kiss, L. L., Gögh, N., Vinko, J., Füresz, Csak, B., DeBond, H., Tomson, J. R., & Derekas, A. 2002, A&A, 384, 982
Lance, C. M., McCall, M. L., & Uomoto, A. K. 1988, ApJS, 66, 151
Lee, H. & Park, M. 1999, ApJ, 515, 199
Liller, W. & Jones, A. F. 1999, IBVS 4774
Livio, M., Shankar, A., & Truran, J. W. 1988, ApJ, 330, 264
Lyke, J. E. 2003, AJ, 126, 993
Lynch, D. K., Russell, R. W., & Sitko, M. L. 2001, AJ, 122, 3313
Mason, E., Howell, S. B., Szkody, P., Harrison, T. E., Holtzman, J. A., & Hoard, D. W. 2002, A&A, 396, 633
Matthews & Soifer, B. T. 1994, in “Infrared Astronomy with Arrays, the Next Generation”, ed. I. McLean, ASSL, 190, 239
Michalsky, J. J., Stokes, G. M., & Sotkes, R. A., ApJ, 216, L35
Miroshnichenko, A. S. 1988, Soviet Astron., 32, 298
Moraes, M., & Diaz, M. 2009, AJ, 138, 1541
Munari, U., Zwitter, T., Tomov, T., Bonifacio, P., Molaro, P., Selvelli, P., Tomasella, L., Niedzielski, A., & Pearce, A. 1999, A&A, 347, L39
Nikitin, S. A., Vshivkov, V. A., & Snytnikov, V. N., 2000, AstL, 26, 362
Orio, M., Covington, J., & Ögelman, H. 2001, A&A, 373, 542
Pagnotta, A., Schaefer, B. E., Xiao, L., Collazzi, A. C., & Kroll, P. 2009, ApJ, 138, 1230
Patterson, J., et al. 1998, PASP, 110, 380
Ramsay, G., Cropper, M., Mason, K. O., Cordova, F. A., & Priedhorsky, W. 2004, MNRAS, 347, 95
Ramsay, G., Cropper, M., Cordova, F., Mason, K., Mch, R., Pandel, D., & Shirey, R. 2001, MNRAS, 326, L27
Ramasay, G., Potter, S., Cropper, M., Buckley, D. A. H., & Harrop-Allin, M. K. 2000, MNRAS, 316, 225
Revnivtsev, M., Sazonov, S., Krivonos, R., Ritter, H., & Sunyaev, R. 2008, A&A 489, 1121
Ringwald, F. A., Naylor, T., & Mukai, K. 1996, MNRAS, 281, 192
Schaefer, B. E. 2010, ApJ Supp., 187, 275
Schmidt, G. D., & Stockman, H. S. 1991, ApJ, 371, 749
Schmidt, G. D., Liebert, J., & Stockman, H. S. 1995, ApJ, 441, 414
Schwarz, G. J., et al. 2011, ApJS, 197, 31
Sekiguchi, K., Feast, M. W., Fairall, A. P., & Winkler, H. 1989, MNRAS, 241, 311
Selvelli, P., Cassatella, A., Gilmozzi, R., & Gonzalez-Riestra, R. 2008, A&A, 492, 787
Semeniuk, I., Olech, A., Nalezyty, M. 1995a, Acta Ast., 45, 747
Semeniuk, I., De Young, J. A., Pych, W., Olech, A., Ruszkowski, M., & Schmidt, R. E. 1995b, Acta Ast., 45, 365
Shafter, A. W., & Abbot, T. M. C. 1989, 339, L75
Shaviv, N. J. 2001, MNRAS, 326, 126
Shears, J., & Poyner, G. 2007, JBAAA, 117, 136
Skrutskie, M .F., et al. 2006, AJ, 131, 1163
Slavin, A. J., O’Brien, T. J., & Dunlop, J. S. 1995, MNRAS, 276, 353
Smith, D. A., Dhillon, V. S., & Marsh, T. R. 1998, MNRAS, 296, 465
Somers, M. W. & Naylor, T. 1999, A&A, 352, 563
Starrfield, S., Iliadis, C., Hix, W. R., Timmes, F. X., & Sparks, W. M., 2009, ApJ, 692, 1532
Stockman, H. S., Schmidt, G. D., & Lamb, D. Q. 1988, ApJ, 332, 282
Strope. R. J., Schaefer, B. E., & Henden, A. A. 2010, AJ, 140, 34
Szkody, P. 1994, AJ, 108, 639
Thorstensen, J. R., & Taylor, C. J. 2000, MNRAS, 312, 629
Townsley, D. M., & Bildsten, L. 2004, ApJ, 600, 390
Warner, B. 1995, Cataclysmic Variable Stars (Cambridge: Cambridge Univ. Press), 261
Warner, B. 2004, PASP, 116, 115
Warner, B. 1985, MNRAS, 217, 1p
Watson, M. G., Schröder, A. C., Fyfe, D., et al. 2009, A&A, 493, 339
Weight, A., Evans, A., Naylor, T., Wood, J. H., & Bode, M. F. 1994, MNRAS, 266, 761
Wheeler, J. C. 2012, ApJ, 758, 123
White, N. E., Giommi, P., & Angelini, L. 1994, BAAS, 185, 4111
Wilson, R. E., & Divinney, E. J. 1971, ApJ, 166, 605
Woudt, P. A., & Warner, B. 2003, MNRAS, 340, 1011
Wright, E. L., Eisenhardt, P. R. M., Mainzer, A. K., et al. 2010, AJ, 140, 1868
Yan Tse, J., Hearnshaw, J. B., Rosenzweig, P., Guzman, E., Escalona, O., Gilmore, A. C., Kilmarten, P. M., & Watson, L. C. 2001, MNRAS, 324, 553
Yuan, H. B., Liu, X. W., & Xiang, M. S. 2013, astro-ph1301.1427
Zwitter, T., & Munari, U. 1996, A&AS, 117, 449
| Name | UT Date | Start Time | Stop Time | Instrument |
|---|---|---|---|---|
| DP Leo | 2006 07 08 | 05:48 | 06:18 | NIRC |
| DP Leo | 2006 07 11 | 03:30 | 03:46 | SQIID |
| EU UMa | 2006 07 08 | 06:22 | 06:56 | NIRC |
| EU UMa | 2006 07 12 | 03:22 | 04:57 | SQIID |
| V1500 Cyg | 2006 07 07 | 11:27 | 14:06 | NIRC (JH) |
| V1500 Cyg | 2006 07 08 | 12:10 | 13:03 | NIRC (HK) |
| V1500 Cyg | 2006 07 12 | 08:04 | 11:29 | SQIID |
| V2487 Oph | 2006 07 08 | 07:21 | 07:54 | NIRC |
| V2487 Oph | 2006 07 12 | 04:56 | 07:51 | SQIID |
| HR Lyr | 2006 07 08 | 11:46 | 12:02 | NIRC |
| OS And | 2006 07 08 | 13:53 | 14:27 | NIRC |
| V373 Sct | 2006 07 08 | 09:42 | 10:33 | NIRC |
| V1974 Cyg | 2006 07 13 | 05:52 | 07:36 | SQIID |
| V1974 Cyg | 2006 07 13 | 09:49 | 11:45 | SQIID |
| V446 Her | 2006 07 11 | 04:36 | 08:47 | SQIID |
| V Per | 2006 07 16 | 08:59 | 11:51 | SQIID |
| QV Vul | 2006 07 16 | 04:11 | 08:52 | SQIID |
| CP Lac | 2006 07 11 | 09:02 | 11:55 | SQIID |
| Name | |||
|---|---|---|---|
| T Aur | 14.06 0.02 | 13.72 0.02 | 13.56 0.04 |
| V705 Cas | 14.17 0.04 | 13.79 0.03 | 13.55 0.03 |
| V723 Cas | 9.06 0.02 | 9.14 0.02 | 8.46 0.02 |
| V1330 Cyg | 15.55 0.06 | 15.25 0.06 | 15.20 0.06 |
| V1500 Cyg | 16.84 0.10 | 16.51 0.10 | 16.29 0.10 |
| V1668 Cyg | 18.5 | 17.4 | 17.2 |
| V1974 Cyg | 16.04 0.06 | 15.75 0.06 | 15.61 0.06 |
| DM Gem | 16.49 0.04 | 16.41 0.10 | 16.26 0.12 |
| V446 Her | 16.89 0.10 | 16.27 0.10 | 15.76 0.10 |
| CP Lac | 15.42 0.05 | 14.94 0.05 | 14.87 0.06 |
| DP Leo | 17.81 0.10 | 17.36 0.10 | 16.92 0.14 |
| BT Mon | 14.72 0.04 | 14.51 0.06 | 14.42 0.06 |
| V2487 Oph | 15.48 0.05 | 14.95 0.05 | 14.79 0.05 |
| V Per11The errors in the photometry for this object were calculated using the standard deviation of the data for the entire light curve (all other error bars are those typical for a single measurement). | 17.19 0.22 | 17.10 0.15 | 16.84 0.30 |
| V400 Per | 18.24 0.30 | 18.1 | 18.1 |
| EU UMa | 17.43 0.09 | 16.72 0.07 | 16.51 0.08 |
| RW UMi | 18.59 0.12 | 18.69 0.18 | 18.32 0.24 |
| LV Vul | 14.45 0.12 | 14.01 0.19 | 14.20 0.22 |
| NQ Vul | 16.17 0.19 | 15.41 0.20 | 15.11 0.28 |
| QU Vul | 18.5 | 17.5 | 17.3 |
| QV Vul11The errors in the photometry for this object were calculated using the standard deviation of the data for the entire light curve (all other error bars are those typical for a single measurement). | 16.24 0.15 | 16.13 0.16 | 16.14 0.21 |
| Name | 2MASS ID | AV11Italicized values for the visual extinction indicates an estimated extinction using the 2MASS observed colors. If a second value is present, this extinction has been estimated using the mean ( ) color relationship for old novae derived in Szkody (1994). | |||
|---|---|---|---|---|---|
| V723 Cas | 01050535+5400402 | 11.88 0.02 | 11.69 0.02 | 10.93 0.02 | 1.5a, |
| GK Per | 03311201+4354154 | 10.86 0.02 | 10.27 0.02 | 10.06 0.02 | 0.9b, |
| QZ Aur | 05283408+3318218 | 15.83 0.06 | 15.29 0.09 | 14.97 0.11 | 1.7c,3.5 |
| T Aur | 05315911+3026449 | 14.02 0.02 | 13.74 0.03 | 13.58 0.03 | 1.6c,d,e,1.0 |
| RR Pic | 06353606-6238242 | 12.46 0.02 | 12.40 0.02 | 12.25 0.02 | 0.1b,0.0 |
| BT Mon | 06434723-0201139 | 14.40 0.04 | 13.96 0.05 | 13.72 0.05 | 0.6d,2.4 |
| DN Gem | 06545435+3208280 | 15.43 0.05 | 15.24 0.09 | 15.26 0.17 | 0.3c,e,i,0.0 |
| GI Mon | 07264710-0640297 | 15.33 0.05 | 15.02 0.08 | 14.81 0.12 | 0.3k,1.5 |
| V445 Pup | 07375688-2556589 | 12.27 0.02 | 11.94 0.02 | 11.52 0.02 | 1.6l,3.3 |
| HS Pup | 07532487-3138503 | 16.35 0.10 | 15.85 0.16 | 15.36 0.17 | 4.6/2.0 |
| HZ Pup | 08032287-2828287 | 15.91 0.08 | 15.64 0.12 | 15.66 0.27 | 0.0 |
| CP Pup | 08114606-3521049 | 14.34 0.03 | 14.24 0.04 | 14.03 0.07 | 0.8d,i,0.6 |
| V365 Car | 11031677-5827249 | 15.64 0.07 | 15.31 0.10 | 15.24 0.19 | 3.2m,0.5 |
| LZ Mus | 11560927-6534201 | 14.46 0.03 | 13.78 0.04 | 13.51 0.05 | 3.7 |
| CP Cru | 12103135-6014471 | 15.95 0.08 | 15.54 0.12 | 15.14 0.17 | 5.9n,3.5 |
| AP Cru | 12312045-6426251 | 15.46 0.05 | 14.76 0.07 | 14.49 0.10 | 3.8 |
| V888 Cen | 13023180-6011362 | 14.48 0.04 | 14.12 0.02 | 14.13 0.06 | 1.3f,0.2 |
| V842 Cen | 14355255-5737352 | 14.83 0.06 | 14.53 0.08 | 14.46 0.12 | 1.7g,0.4 |
| CT Ser | 15453907+1422317 | 16.06 0.14 | 15.67 0.14 | 15.59 0.19 | 0.7c,0.8 |
| X Ser | 16191767-0229295 | 15.50 0.06 | 15.00 0.07 | 14.78 0.09 | 0.8h,2.5 |
| OY Ara | 16405045-5225479 | 15.57 0.08 | 14.82 0.10 | 14.62 0.09 | 1.7,3.5 |
| V841 Oph | 16593037-1253271 | 12.32 0.03 | 11.95 0.02 | 11.81 0.02 | 1.5c,i,1.3 |
| V2487 Oph | 17315980-1913561 | 15.36 0.08 | 14.88 0.10 | 14.41 0.09 | 1.4a,j,2.222Estimated extinction calculated using the data from Table 2. |
| V972 Oph | 17344444-2810353 | 13.62 0.06 | 12.94 0.08 | 12.61 0.07 | 1.5o,4.2 |
| V794 Oph33Woudt & Warner (2003) note that this object shows no variability. The optical/IR colors of this source indicate a reddened K-giant. The 2MASS images show a faint source blended on the NW side of the object identified as V794 Oph, but that faint source has similar colors to the candidate. | 17384924-2250489 | 14.15 0.06 | 13.37 0.05 | 13.24 0.06 | 3.1/4.2 |
| V721 Sco | 17422909-3440414 | 13.69 0.04 | 13.31 0.06 | 13.20 0.06 | 1.1 |
| V3888 Sgr | 17484147-1845347 | 15.19 0.11 | 14.52 0.11 | 14.32 0.12 | 3.3c,p,3.1 |
| V3964 Sgr | 17494261-1723361 | 15.78 0.10 | 14.84 0.14 | 14.57 0.18 | 4.9 |
| V825 Sco | 15.32 0.12 | 14.38 0.11 | 14.11 0.15 | 4.9 | |
| V1172 Sgr | 17502366-2040298 | 12.57 0.04 | 11.41 0.04 | 11.03 0.03 | 1.2c,6.8 |
| V977 Sco | 17515035-3231575 | 14.10 0.06 | 13.23 0.05 | 13.07 0.04 | 3.8 |
| V4643 Sgr | 17544041-2614154 | 13.18 0.07 | 12.59 0.05 | 12.27 0.05 | 5.2a,3.7 |
| V1178 Sco | 17570664-3223053 | 13.74 0.07 | 13.62 0.11 | 13.33 0.08 | 2.2 |
| V990 Sgr | 17571823-2819079 | 12.98 0.05 | 11.93 0.05 | 11.54 0.04 | 6.4 |
| DQ Her | 18073024+4551325 | 13.60 0.03 | 13.28 0.04 | 13.09 0.04 | 0.3b,1.4 |
| V533 Her | 18142048+4151221 | 14.71 0.03 | 14.65 0.05 | 14.64 0.06 | 0.3c,d,e,i,0.0 |
| GR Sgr | 18225850-2534473 | 14.87 0.07 | 14.53 0.05 | 14.51 0.08 | 0.2/1.0 |
| V1151 Sgr | 15.81 0.12 | 14.89 0.10 | 14.75 0.13 | 3.8 | |
| BS Sgr | 18264672-2708199 | 12.84 0.03 | 12.22 0.03 | 12.12 0.03 | 2.1/1.7 |
| FH Ser | 18304704+0236520 | 15.25 0.06 | 15.00 0.11 | 14.66 0.11 | 2.3c,d,e,i,2.3 |
| V1017 Sgr | 18320447-2923125 | 11.45 0.03 | 10.85 0.03 | 10.67 0.03 | 2.6 |
| V3645 Sgr | 18354936-1841385 | 13.43 0.03 | 12.55 0.03 | 12.36 0.03 | 4.0 |
| V827 Her | 16.70 0.18 | 16.06 0.20 | 15.9 | 3.9 | |
| V522 Sgr | 18480046-2522219 | 15.02 0.05 | 14.60 0.06 | 14.60 0.08 | 1.2c,0.4 |
| V603 Aql | 18485464+0035030 | 11.70 0.02 | 11.51 0.03 | 11.35 0.03 | 0.2b,c,0.6 |
| HR Lyr | 18532505+2913377 | 15.06 0.04 | 14.81 0.07 | 14.82 0.08 | 0.5c,i,0.0 |
| EL Aql | 18560202-0319205 | 13.41 0.03 | 12.55 0.03 | 12.23 0.02 | 4.9/6.7 |
| V446 Herbl? | 15.17 0.07 | 14.61 0.06 | 14.50 0.11 | 1.4c,d,e,1.9 | |
| FS Sct | 18581691-0524051 | 14.65 0.04 | 13.93 0.04 | 13.71 0.04 | 3.5/3.6 |
| V1059 Sgr | 19015056-1309420 | 15.61 0.07 | 15.33 0.11 | 14.84 0.16 | 3.6 |
| QV Vul | 17.35 0.29 | 16.27 0.23 | 16.1 | 1.0q,0.022Estimated extinction calculated using the data from Table 2. | |
| V1378 Aql | 19163547+0343263 | 16.06 0.11 | 15.51 0.10 | 15.08 0.16 | 4.4/4.7 |
| V356 Aql | 17.25 0.26 | 17.00 0.39 | 16.40 0.38 | 2.0d,4.4 | |
| V1301 Aql | 18.80 0.34 | 16.92 0.23 | 16.8 | 2.8p, | |
| V528 Aql | 16.55 0.19 | 17.15 0.35 | 16.42 0.33 | 2.6d, | |
| V1494 Aqlbl? | 19230529+0457190 | 14.85 0.05 | 14.37 0.07 | 14.13 0.07 | 1.8r,2.6 |
| V1370 Aql | 19232125+0229262 | 16.20 0.09 | 15.42 0.11 | 15.30 0.18 | 1.8e,3.0 |
| V1229 Aql | 19244452+0414486 | 16.23 0.15 | 15.68 0.12 | 15.54 0.20 | 1.5d,e,p,2.1 |
| PW Vul | 16.11 0.15 | 15.81 0.16 | 15.66 0.20 | 1.6c,p,q,1.1 | |
| V368 Aql | 19263446+0736137 | 14.53 0.04 | 14.15 0.05 | 14.03 0.07 | 0.8c,1.1 |
| NQ Vulbl | 19291475+2027596 | 15.03 0.05 | 14.63 0.05 | 14.26 0.08 | 1.7c,e,s,3.2 |
| DO Aql | 19312591-0625382 | 16.15 0.12 | 15.59 0.15 | 15.31 0.19 | 3.3 |
| LV Vul | 19480043+2710173 | 14.65 0.08 | 14.03 0.07 | 13.80 0.08 | 1.7d,p,3.1 |
| V476 Cyg | 19582445+5337075 | 16.01 0.10 | 15.59 0.15 | 15.56 0.19 | 0.7d,e,0.6 |
| RR Tel | 20041854-5543331 | 7.30 0.04 | 6.08 0.04 | 4.90 0.01 | 0.3c, |
| V2467 Cyg | 20281249+4148365 | 15.73 0.06 | 15.13 0.10 | 14.74 0.12 | 4.6a,4.3 |
| V1974 Cyg | 20303161+5237513 | 15.67 0.07 | 15.28 0.10 | 15.21 0.16 | 1.1t,u,0.8 |
| HR Del | 20422035+1909394 | 12.32 0.02 | 12.28 0.02 | 12.22 0.02 | 0.5c,d,i,0.0 |
| V1330 Cyg | 20524536+3559213 | 15.72 0.10 | 15.11 0.09 | 15.00 0.12 | 2.1/2.1 |
| V450 Cyg | 20584763+3556304 | 15.02 0.06 | 14.51 0.07 | 14.41 0.08 | 1.4d,1.5 |
| V2275 Cyg | 21030196+4845534 | 16.25 0.12 | 16.03 0.18 | 16.51 0.39 | 3.1v, |
| V1500 Cyg | 21113632+4809058 | 16.13 0.12 | 15.49 0.13 | 15.38 0.20 | 1.5w,2.3 |
| Q Cyg | 21414393+4250290 | 13.54 0.03 | 13.25 0.03 | 13.11 0.03 | 1.4c,i,0.9 |
| IV Cep | 22043692+5330236 | 14.96 0.07 | 14.63 0.08 | 14.30 0.08 | 1.9c,d,e,p,2.6 |
| CP Lac | 22154108+5537014 | 15.03 0.06 | 14.73 0.07 | 14.81 0.12 | 1.5c,d,0.8 |
| DI Lac | 22354848+5242596 | 13.73 0.04 | 13.54 0.05 | 13.40 0.04 | 1.3c,i,0.5 |
| DK Lac | 22494690+5317192 | 16.43 0.15 | 16.00 0.21 | 16.11 0.25 | 1.3c,d,e,2.0 |
| V705 Cas | 23414719+5730594 | 14.88 0.04 | 14.54 0.07 | 14.28 0.08 | 1.7x,2.1 |
| BC Cas | 23511745+6018100 | 15.44 0.05 | 14.96 0.07 | 14.58 0.08 | 3.7y,3.7 |
Published AV sources: aSchwarz et al. (2011),
bHarrison et al. (2013a), cWeight et al. (1994),
dDuerbeck (1981), eHarrison (1989), fYan
Tse et al. (2001), gSekiguchi et al. (1989), hThorstensen
& Taylor (2000), iBruch & Engel (1994), jSchaefer (2010),
kGilmozzi et al. (1994), lIijima & Nakanishi (2008),
mHenize & Liller (1975), nLyke et al. (2003),
oZwitter & Munari (1996), pMiroshnichenko (1988),
qOrio et al. (2001), rIijima & Esenoglu (2003),
sWarner (1995), tKato & Hachisu (2007),
uAustin et al. (1996), vKiss et al. (2002),
wFerland et al. (1977), xHric et al. (1998),
yRingwald et al. (1996)
| Name | 3.4 m | 4.6 m | 12 m | 22 m |
|---|---|---|---|---|
| V723 Cas | 13.39 0.03 | 13.33 0.03 | 12.23 0.26 | |
| GK Per | 9.87 0.02 | 9.76 0.02 | 9.30 0.03 | 7.89 0.15 |
| QZ Aur | 14.91 0.05 | 14.87 0.10 | 12.52 0.28 | |
| T Aur | 13.53 0.03 | 13.39 0.04 | 11.93 0.28 | |
| RR Pic | 11.99 0.02 | 11.82 0.02 | 11.33 0.07 | |
| GI Mon | 15.08 0.06 | 15.03 0.11 | ||
| V445 Pup | 10.39 0.02 | 7.30 0.02 | 0.55 0.01 | 1.32 0.01 |
| HS Pup | 15.44 0.05 | 15.98 0.24 | ||
| HZ Pup | 15.28 0.05 | 15.03 0.10 | 11.89 0.21 | |
| CP Pup | 13.78 0.03 | 13.65 0.04 | 12.39 0.35 | |
| LZ Mus | 14.46 0.03 | 13.75 0.04 | 13.51 0.05 | |
| V888 Cenex | 13.96 0.20 | 14.15 0.34 | ||
| CT Ser | 15.56 0.05 | 15.77 0.17 | ||
| X Ser | 14.70 0.04 | 14.61 0.07 | ||
| V841 Oph | 11.74 0.02 | 11.70 0.03 | 11.56 0.34 | |
| V2487 Ophbl | 14.13 0.07 | 14.44 0.12 | ||
| DQ Her | 12.91 0.02 | 12.76 0.03 | 12.26 0.22 | |
| V533 Her | 14.48 0.03 | 14.43 0.05 | ||
| BS Sgrex | 11.19 0.02 | 11.25 0.03 | 11.17 0.07 | |
| V827 Herex | 15.47 0.22 | |||
| V603 Aql | 10.80 0.03 | 10.72 0.03 | 10.01 0.29 | |
| HR Lyr | 14.76 0.05 | 14.73 0.07 | ||
| V446 Herbl,ex | 13.21 0.07 | 13.37 0.10 | 12.16 0.21 | |
| FS Sctbl,ex | 12.86 0.07 | 12.82 0.10 | ||
| V1059 Sgrbl?,ex | 14.81 0.11 | 14.77 0.17 | 13.12 0.35 | |
| V1494 Aqlex | 13.76 0.07 | 13.65 0.10 | 12.31 0.22 | 7.234 0.20 |
| V1370 Aqlex | 14.79 0.12 | 14.73 0.18 | ||
| V1229 Aqlex | 15.34 0.07 | 16.02 0.37 | ||
| PW Vulbl | 14.99 0.06 | 15.31 0.16 | ||
| V368 Aql | 13.99 0.04 | 14.20 0.08 | 12.15 0.30 | |
| DO Aqlex | 15.42 0.13 | 15.84 0.27 | 13.07 0.21 | |
| V476 Cyg | 15.21 0.04 | 15.30 0.08 | ||
| RR Tel | 3.36 0.11 | 1.85 0.01 | 0.34 0.01 | 0.64 0.01 |
| V2467 Cygex | 12.53 0.04 | 11.44 0.04 | 7.79 0.05 | 3.80 0.04 |
| V1974 Cygex | 14.99 0.11 | 14.87 0.16 | 12.24 0.15 | 8.14 0.22 |
| HR Del | 11.85 0.02 | 11.69 0.02 | 10.12 0.05 | 5.99 0.04 |
| V1330 Cygex | 15.11 0.04 | 15.97 0.27 | ||
| V450 Cyg | 14.22 0.03 | 14.38 0.06 | ||
| V2275 Cygex | 14.82 0.07 | 14.90 0.16 | ||
| Q Cyg | 12.84 0.02 | 12.81 0.03 | ||
| IV Cepbl,ex | 12.56 0.07 | 12.49 0.11 | ||
| DI Lac | 13.33 0.03 | 13.33 0.03 | 12.73 0.34 | |
| DK Lac | 14.93 0.04 | 15.03 0.12 | ||
| V705 Cas | 14.03 0.03 | 13.91 0.04 | 10.88 0.20 | 7.25 0.12 |
| BC Cas | 14.51 0.04 | 14.30 0.05 |
blThis object suffers from blending issues.
exIndicates an object where aperture photometry using IRAF
was performed to extract the listed fluxes.