The Effect of the Pre-Detonation Stellar Internal Velocity Profile on the Nucleosynthetic Yields in Type Ia Supernova
Abstract
A common model of the explosion mechanism of Type Ia supernovae is based on a delayed detonation of a white dwarf. A variety of models differ primarily in the method by which the deflagration leads to a detonation. A common feature of the models, however, is that all of them involve the propagation of the detonation through a white dwarf that is either expanding or contracting, where the stellar internal velocity profile depends on both time and space. In this work, we investigate the effects of the pre-detonation stellar internal velocity profile and the post-detonation velocity of expansion on the production of -particle nuclei, including 56Ni, which are the primary nuclei produced by the detonation wave. We perform one-dimensional hydrodynamic simulations of the explosion phase of the white dwarf for center and off-center detonations with five different stellar velocity profiles at the onset of the detonation. In order to follow the complex flows and to calculate the nucleosynthetic yields, approximately 10,000 tracer particles were added to every simulation. We observe two distinct post-detonation expansion phases: rarefaction and bulk expansion. Almost all the burning to 56Ni occurs only in the rarefaction phase, and its expansion time scale is influenced by pre-existing flow structure in the star, in particular by the pre-detonation stellar velocity profile. We find that the mass fractions of the -particle nuclei, including 56Ni, are tight functions of the empirical physical parameter /, where is the mass density immediately upstream of the detonation wave front and is the velocity of the flow immediately downstream of the detonation wave front. We also find that depends on the pre-detonation flow velocity. We conclude that the properties of the pre-existing flow, in particular the internal stellar velocity profile, influence the final isotopic composition of burned matter produced by the detonation.
Subject headings:
nuclear reactions, nucleosynthesis, abundances; supernovae: general; white dwarfs1. Introduction
Type Ia supernovae (SNe Ia) result from the explosions of carbon-oxygen (CO) white dwarfs (Fowler & Hoyle, 1960). Their extremely high and very similar peak luminosities have made SNe Ia important standard candles for measuring distances in the Universe, and therefore estimating cosmological parameters critical for our understanding of its evolution (Perlmutter et al., 1998; Schmidt et al., 1998; Riess et al., 2001). They also play a critical role in nucleosynthesis, as contributors to the abundances of both iron-peak (titanium to zinc) nuclei and intermediate mass (silicon to calcium) elements.
Despite the widespread use of and interest in SNe Ia, their explosion mechanism is not yet fully understood, and their progenitor systems have not been unambiguously identified. We have chosen to explore the single-degenerate scenario of SNe Ia, which involves the growth of a Carbon-Oxygen white dwarf toward the Chandrasekhar limit in a binary system and its ultimate thermonuclear ignition and disruption. The initial phases of the explosion involve a subsonic thermonuclear flame (deflagration) which gives rise to the expansion of the white dwarf prior to the initiation of a supersonic burning front (detonation wave) (Khokhlov, 1991; Hflich et al., 1995; Niemeyer & Woosley, 1997). The density of the white dwarf decreases as a consequence of its expansion. Thus, the detonation burns material at lower densities, producing higher abundances of intermediate mass elements (Hillebrandt & Niemeyer, 2000 and references therein). According to observations, approximately 0.4 solar masses of intermediate mass elements are synthesized during the explosion (Wheeler & Harkness, 1990). A variety of models involve the scenario of a deflagration phase followed by a detonation phase, such as the deflagration-to-detonation transition (DDT)(Khokhlov, 1991; Gamezo et al., 2004, 2005), the pulsating reverse detonation (PRD) (Bravo & García-Senz, 2006, 2009; Bravo et al., 2009), or the gravitationally confined detonation (GCD) (Plewa, Calder & Lamb, 2004; Townsley et al., 2007; Jordan et al., 2008; Meakin et al., 2009 and references therein; Jordan et al., 2012). These models differ primarily in the method by which the deflagration phase leads to a detonation wave. A common feature of the models, however, is that all of them involve the propagation of the detonation wave through a white dwarf that is either expanding or contracting, where the stellar velocity profile depends on both time and space. The detonation wave thus propagates into material that is not at rest.
In this paper, we explore the post-detonation expansion of the white dwarf and its consequences for the production of -particle nuclei, including intermediate-mass nuclei and 56Ni, using central and off-center detonation models with different velocity profiles at detonation111A related work is the study by García-Senz et al. (2007) of the nucleosynthetic yield produced by a subsonic deflagration wave in the low-density outer layers of an expanding white dwarf.. We describe the details of the numerical methods used in our simulations in . We performed a total of nine simulations; we give the setups for these simulations in . We present our results in , focusing primarily on the central explosion models. Our results include the detonation structure for non-static stars (), the expansion of the flow at different time scales behind the detonation and the nucleosynthesis using the thermal properties of the flow (), and an empirical relation between certain properties of the detonation wave and the final nucleosynthetic yields of -particle nuclei, including 56Ni, in the density range of (). We present the results for the off-center detonation models in . We conclude with a summary of our findings and of their implications for our understanding of the consequences of the detonation under the conditions appropriate for a pulsating white dwarf environment ().
2. Numerical Methods
2.1. FLASH
We performed one-dimensional spherically-symmetric simulations using the FLASH code (Fryxell et al., 2000). FLASH is a modular, block-structured Eulerian code with adaptive mesh refinement capabilities that solves Euler’s equations for compressible gas dynamics with a directionally split piecewise parabolic method (PPM; Colella & Woodward, 1984). PPM is particularly well-suited to flows involving discontinuities, such as detonation waves, and allows handling of non-ideal equations of state (EOS) (Colella & Glaz, 1985). The implementation of the EOS uses a tabular Helmholtz free energy EOS appropriate for stellar conditions encountered here including contributions from blackbody radiation, ions, and electrons of an arbitrary degree of degeneracy (Timmes & Swesty, 2000).
For the energetics required to treat detonation waves, we track three distinct burning stages: (1) the burning of carbon to O, Ne, Na, Mg, and -particles; (2) the subsequent burning of oxygen to a Quasi-Static Equilibrium (QSE) state comprised predominantly of Si group elements; and (3) if the temperature is high enough, the evolution of the system to Nuclear Statistical Equilibrium (NSE), which at the low entropies found in Chandrasekhar mass white dwarf, is primarily of comprised iron-group elements. The energy released due to carbon burning is explicitly calculated using the carbon fusion rate of Caughlan & Fowler (1988), while the energy released during Oxygen and Si-group burning are controlled by the timescales for reaching the QSE state and NSE respectively. Additional details concerning the energetics are presented in Calder et al. (2007), Townsley et al. (2007), Meakin et al. (2009 and references therein), and Seitenzahl et al. (2009).
For the hydrodynamics, we use the the conservation equations for the reacting gas flow together with two source terms: gravity and nuclear reactions. A detonation wave is a form of combustion in which a shock wave propagates into the fluid, heating it to high temperatures and triggering nuclear reactions. The energy that is released supports the detonation wave. Since the detonation wave propagates supersonically, molecular diffusion, thermal conduction, and viscous effects are negligible. Therefore, the simplified set of the Euler equations for the reacting gas flow is:
| (1) |
| (2) |
| (3) |
| (4) |
where is the fluid density, is the fluid velocity, is the pressure, is the sum of the internal energy and kinetic energy per unit mass with , is the gravitational acceleration, is a reaction progress variable that tracks the three burning stages (C-, O-, and Si-burning), is the reaction rate, and is the corresponding mass-specific energy release, (see Calder et al. (2007); Townsley et al. (2007); Seitenzahl et al. (2009) for further details). Nuclear burning is suppressed within the shock to prevent instabilities. We performed the simulations using a one-dimensional, spherically symmetric computational domain with radius 22,016 km. We employed twelve levels of refinement, which gave a maximum spatial resolution of 0.5 km during the simulations of the detonation phase.
2.2. Libnucnet
The network code used for the post processing is a version of the network code based on libnucnet, a library of C codes for storing and managing nuclear reaction networks (Meyer & Adams, 2007). The network contains 230 nuclear species ranging from neutrons, protons, and -particles, giving reliable results for the evolving abundances of the most important species, including the intermediate-mass elements (IME) and iron-peak elements. The nuclear and reaction data for the calculations were taken from the JINA reaclib database (Cyburt et al., 2010). In this network, electron-capture rates were not included since at densities , these reactions occur much more slowly than the detonation-induced explosion of the white dwarf.
3. Model Setup
We have computed nine one-dimensional detonation models. Although supernovae are multi-dimensional phenomena, the one-dimensional treatment greatly simplifies the problem. We neglect the multi-dimensional effects such as a multicellular structure (Gamezo et al., 1999; Timmes & Swesty, 2000). However, the simplicity of the one-dimensional models allows us to draw general conclusions regarding the subject of primary interest to us: the nucleosynthetic yields produced by a detonation wave propagating across a star that is not static, but is instead either expanding or contracting. While our main focus is central-detonation models, we also explore the case in which the detonation occurs off-center.
| Physical Characteristics | 111We investigate both central and off-center detonations for these initial profiles. | 111We investigate both central and off-center detonations for these initial profiles. | 111We investigate both central and off-center detonations for these initial profiles. | 111We investigate both central and off-center detonations for these initial profiles. | |
|---|---|---|---|---|---|
| Velocity-Radius Ratio [] | -1/8 | -1/4 | 0 | 1/4 | 1/8 |
| Central Density [] |
Each initial stellar model is a cold (), isothermal white dwarf (WD) in hydrostatic equilibrium with a central density of and a radius of approximately 2000 km. Its composition consists of equal parts of carbon and oxygen by mass throughout the star.
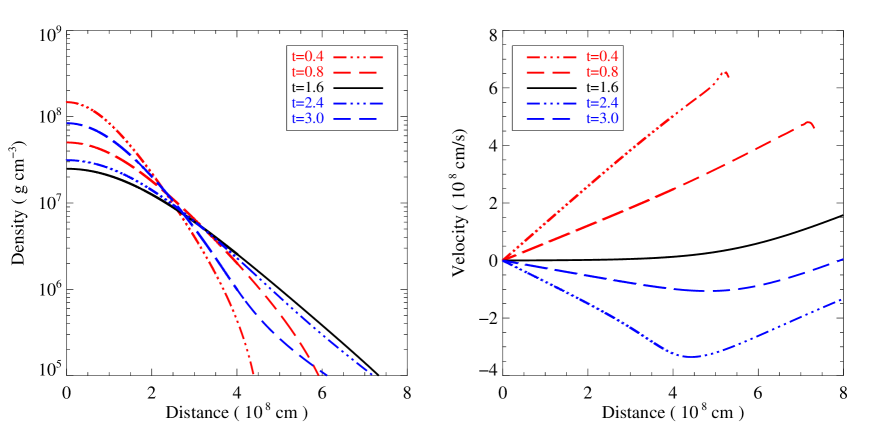
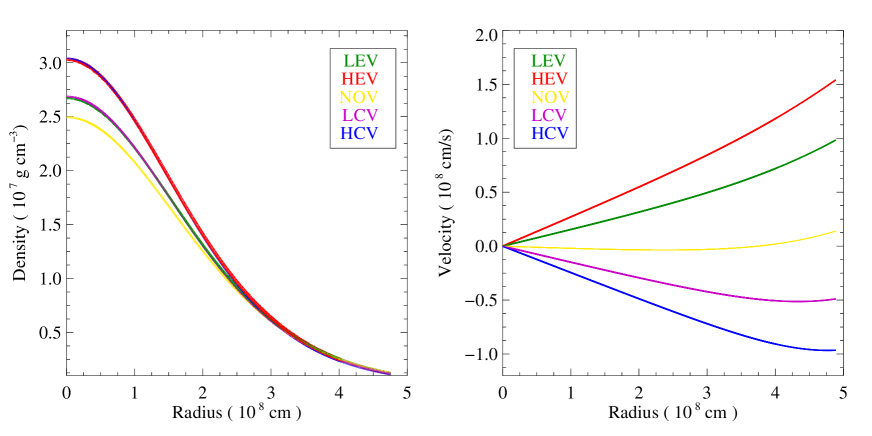
In the whole-star simulations of SNe Ia models that involve both deflagration and detonation phases, the deflagration phase leads to expansion of the WD prior to detonation. In the present one-dimensional models, we artificially expand the star out of hydrostatic equilibrium by exciting its lowest vibrational mode with a velocity profile that varies linearly with the stellar radius. The slope of the velocity profile is such that the resulting kinetic energy is 30% of the WD binding energy. This causes the star to first expand and then contract. Figure 1 shows the temporal evolution of the density and velocity profiles over the time during which the star expands and contracts. We initiated a detonation by setting the temperature in selected computational cells to . We detonated five WD models at the center of the star, while we detonated four models at slightly off-center. The set of central and off-center ignition models share the same initial stellar profiles and differ only by the ignition location. In total, we studied five initial density and velocity profiles at the time of the ignition; these are shown in Figure 2. The velocity profiles are nearly linear with radius for densities higher than . We were therefore able to choose two expanding white dwarf models in which the ratio between the initial velocity and radius profiles is approximately 1/4 () and 1/8 () in units of sec-1. For the contracting models, we choose two models in which the ratio between the initial velocity and radius profiles is approximately -1/4 () and -1/8 () in units of sec-1. Finally, we choose an initial profile () whose velocity profile is approximately 0.0 sec-1 to represent the static case. For simplicity, we denote these models by the ratio of the initial velocity and radius profiles throughout this paper. Unless explicitly stated otherwise, the data used are from the central detonation models. Table 1 summarizes the physical characteristics of the models we study. We adopt the following nomenclature for the models we study: the first letter indicates whether the velocity is relatively ow or igh, the second letter indicates whether the star is ontracting or xpanding mode, while the third letter stands for elocity. The letters “NOV” stand for elocity.
Every simulation included Lagrangian tracer particles distributed by mass that were passively advected with the fluid during the course of the simulation. The temperature and density histories of the tracer particles were calculated by interpolating the corresponding quantities using the underlying Eulerian grid. Each tracer particle represents a fluid parcel, all of which have the same mass. We used the temperature and density histories of the tracer particles to calculate the nucleosynthetic yields in a post-processing step using libnucnet, and to provide additional diagnostics for the complex flows. Each simulation contained approximately tracer particles.
4. Results
This section is largely composed of two parts: the detailed analysis of the central-detonation models in , , and , and the exploration of the off-center detonation models in .
4.1. Detonation Structure for Non-Steady Stars
In this section, we discuss the properties of a one-dimensional spherical detonation as it propagates through a WD that is either expanding or contracting. In what follows, we distinguish among three types of hydrodynamic motion that interact nontrivially at different phases of the evolution of the explosion: the expanding or contracting flow belonging to the initial pre-expanded model; the expanding rarefaction that trails the detonation wave; and the bulk expansion experienced by the stellar material downstream of the detonation wave due to the energy release by the wave. We show that the combined effect of the first two flows is responsible for creating the specific cooling conditions behind the shock that determine the time available for nuclear burning, and hence the nucleosynthetic yields.
4.1.1 Hydrodynamics of a Detonation Wave
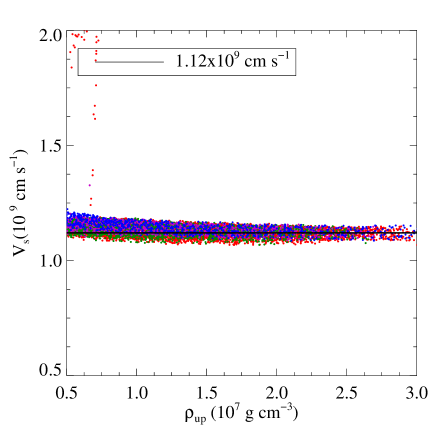
The initial high-temperature disturbance in the center of the WD forms a shock wave that quickly transitions to a detonation whose wave speed is roughly the Chapman-Jouguet (CJ) speed . The CJ speed corresponds to the smallest possible detonation speed, and many detonations fall into this category (Seitenzahl et al., 2009). In our study, the detonation wave speed in the frame of the upstream fuel remains almost constant (varying by only ) as it propagates through the entire star, and this behavior is true in all models (see Figure 3). This implies that the shock strength is independent of the upstream velocities and is insensitive to the upstream density of the fuel.
The propagation of the detonation wave is powered by the exothermic nuclear reactions that occur immediately behind it. The detonation wave propagates outward from the center of the WD, consuming the carbon and oxygen in the stellar core. Carbon burning occurs almost instantly in the high-density regions close to the center of the WD, while its burning length scale becomes comparable to the maximum resolution of the simulation (500m) at densities lower than . The length scale for Oxygen burning becomes resolved at densities g cm-3, while the length scale for Silicon burning is larger than the maximum resolution at all densities (see also Domínguez & Khokhlov, 2011). As the detonation wave approaches the WD surface, it is still burning almost all of the carbon but leaves unburned Oxygen in the low-density outer layers of the star. Not enough energy is released by nuclear burning behind the front in these low-density outers to continue to power the detonation wave; as a result, it transitions to a shock wave and propagates out of the star.
4.1.2 Rarefaction and Bulk Expansion
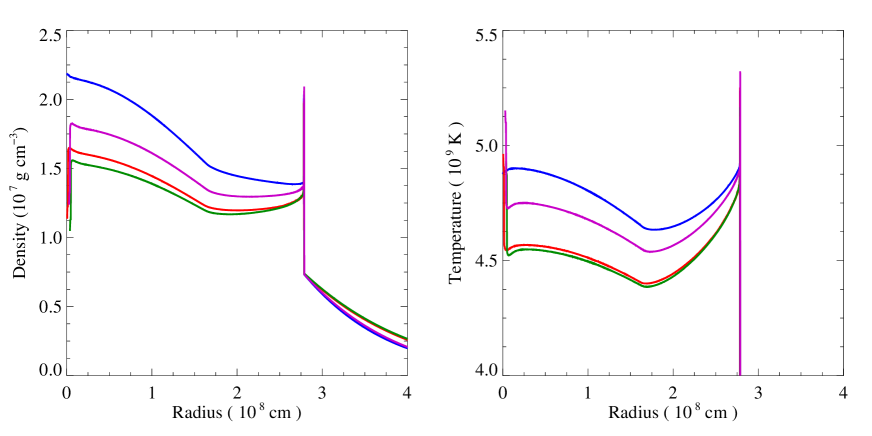
The temperature and density of the stellar material increase sharply due to the detonation wave; immediately afterward, the shocked material experiences a strong rarefaction. As an example, we show the behavior of four models at an upstream density of . Figure 4 shows the density and temperature structure of the four models. Since the different models have different initial velocity profiles, the time it takes for the detonation wave to reach approximately the same upstream density differs. Therefore, we aligned the profiles so that their upstream densities overlap.
For the above upstream density, the matter in all models enter the detonation wave and is strongly compressed and heated to similar post-shock densities and temperatures ( and ). However, the strength of the rarefaction wave behind the front differs greatly, depending on the model. In general, the speed of the rarefaction wave behind the front is higher in expanding cores than in contracting ones. This trend is consistent with the thermal history of the tracer particles, which we will discuss in .
In view of the fact that the strength of the detonation wave is similar in all models, as illustrated in Figure 3, the difference in the expansion rates behind the detonation wave shows that the physics in the rarefaction zone is not dominated by the structure of the detonation wave; rather, it is a result of the superposition of the flow due to the detonation wave and that due to the pre-existing velocity profile in the star. This is the reason the nuclear yields are different in the different models; had the detonation structure dominated the preexisting flow, all of the models would have had similar yields. Besides the rarefaction wave, there is another expanding phase due to the bulk expansion of the white dwarf.
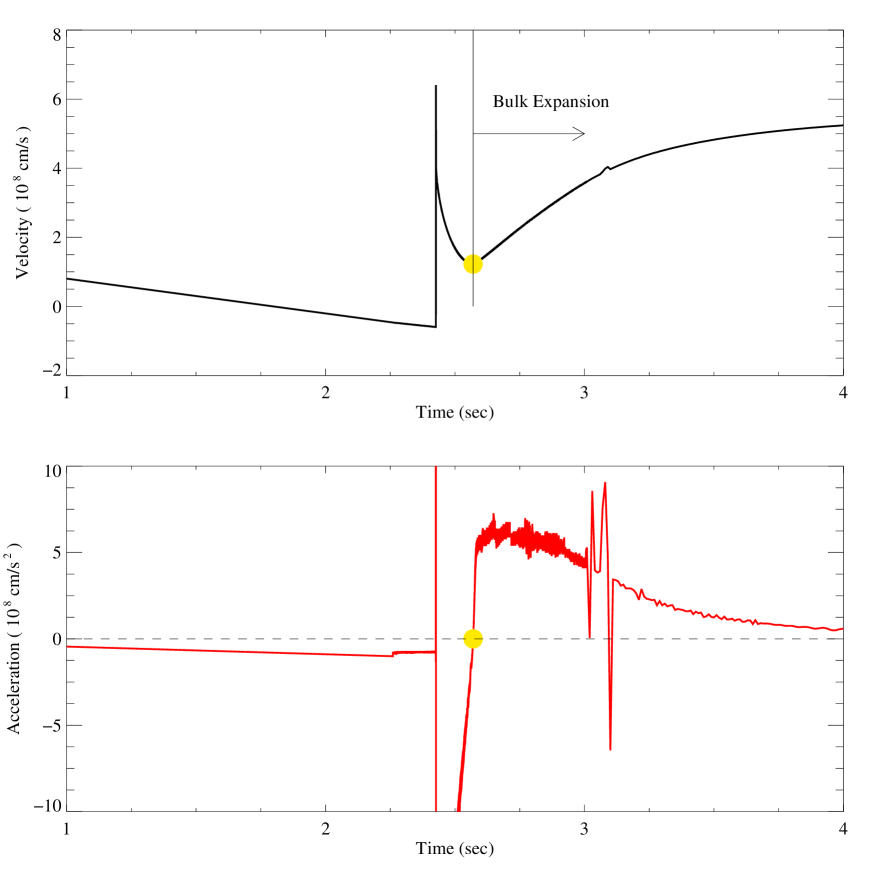
Figures 5 and 6 show Lagrangian and Eulerian views of the typical flow properties behind the outwardly moving detonation wave for the LCV model. The yellow dot marks the position of a tracer particle in time in Figure 5 and in space in Figure 6. The time histories of the tracer particle in velocity and acceleration are shown in Figure 5. The tracer particle which is originally located at a radius of at t = 0 sec travels towards the center of the WD while the detonation wave front propagates through the contracting star. As the tracer particle enters the detonation wave, it momentarily experiences a strong acceleration outward due to compression in the detonation wave. It is then accelerated toward the center (see the bottom panel of Figure 5), as the pressure decays due to the expansion of the wave front. At t = 2.57 sec, the tracer particle experiences outward acceleration due to the bulk expansion of the star. The turnover in the acceleration can be seen in the time history of the tracer particle in velocity. This behavior is explained by Figure 6, which shows the velocity profile and the acceleration () profile of the star t = 2.57 sec when the propagating detonation wave is from the center of the star. The pressure soon dominates over the inward gravitational force as the matter is heated by the energy that is released in the nuclear burning, leading to bulk expansion of the star (the location of the tracer particle is shown by the yellow dot).
4.2. The Effect of Expansion Time Scales on Nucleosynthesis
We calculated the final nucleosynthetic yields for each tracer particle by integrating the reaction network in libnucnet, starting when the tracer particle experienced the peak temperature produced by the detonation wave. We continued the integration until the temperature decreased to , below which the nuclear abundances do not change significantly except by beta decay. We found that, in all of the models, freeze-out to 56Ni occurs during the strong rarefaction phase and before the bulk expansion phase during which the pressure force drives the incinerated matter into expansion.
4.2.1 Nuclear Abundances
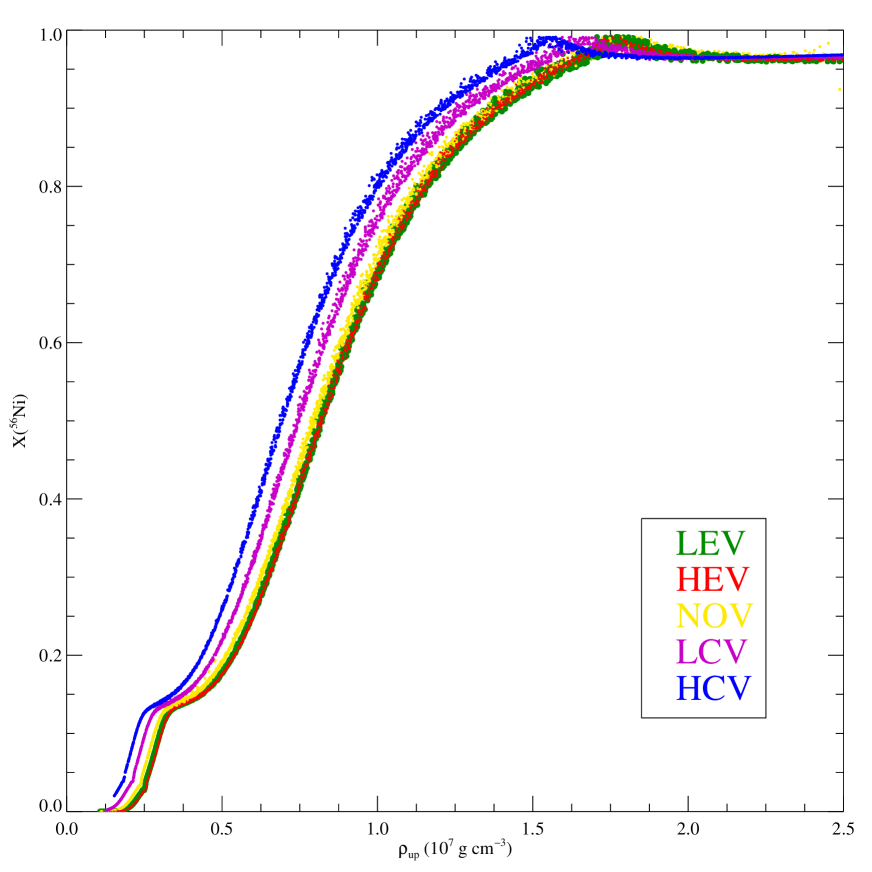
At the center of all of the models, the detonation wave converts the material chiefly into 56Ni by complete silicon burning. As the wave propagates through the low-density, outer layers, the nucleosynthesis is characterized by carbon and oxygen burning, then only carbon burning, and finally the burning ceases. Thus, the amount of 56Ni is, in general, a function of the initial density of the fuel, and increases with the fuel density. Figure 7 shows the final mass fraction of 56Ni as a function of the upstream density of fuel, where “upstream” denotes the undisturbed matter entering the detonation wave. While there is a tight relation between the final abundance of 56Ni and in each simulation, we find that the final abundance of 56Ni for a given varies across the five simulations, with the model producing the least 56Ni and the model producing the most.
The differences in the final abundances of 56Ni across the five models are due to the differences in the bulk expansion time scales, as we demonstrate in the next section.
4.2.2 Time Evolution of Thermodynamic Properties
In general, the detailed behavior of the density and temperature is coupled to the nuclear burning and hydrodynamics. In the case of a simple one-dimensional detonation model, the detonation wave propagates outward from the point of ignition by heating the upstream fuel to a temperature above the ignition temperature. Once nuclear burning begins, the energy released by it influences the hydrodynamic behavior of the ash, and the subsequent hydrodynamic behavior controls the time evolution of temperature and density of the ash. Because nuclear reactions are highly temperature-sensitive, the interplay of the time scales between burning and hydrodynamic expansion determines the final nucleosynthetic yields.
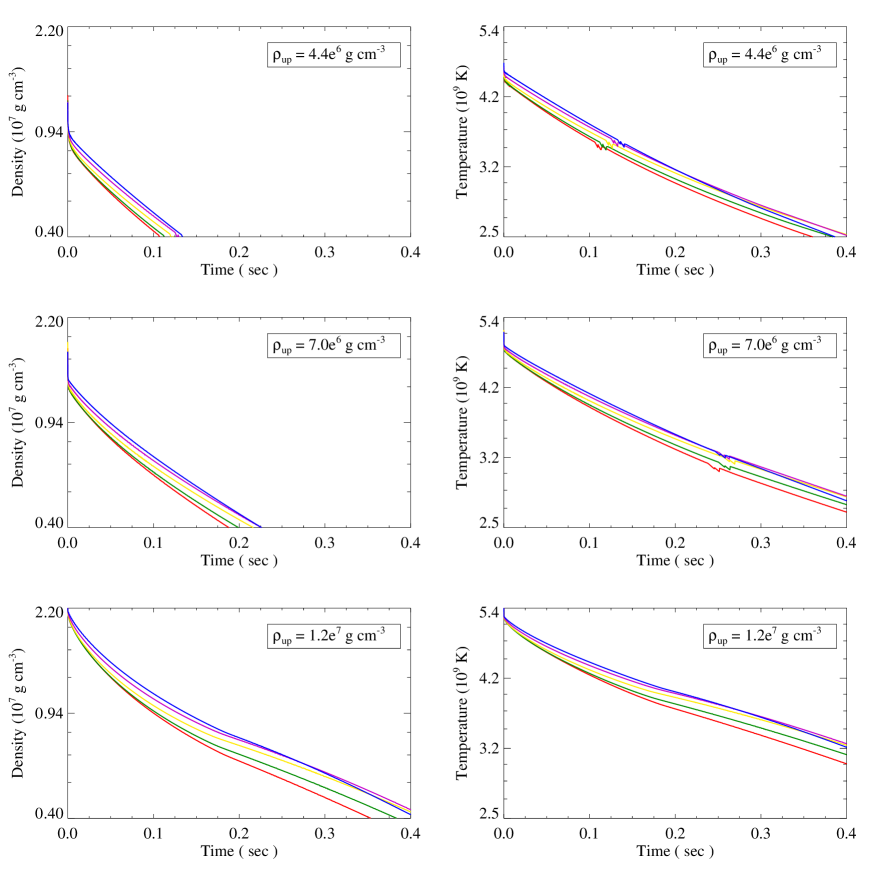
Figure 8 shows for all five models the density and temperature histories of tracer particles whose upstream densities are , , and , which spans the density range for which the final abundance of 56Ni lies between 0.1 and 1.0. The tracer particle histories were aligned such that their peak temperatures begin at time = 0.0 second.
The peak density and the peak temperature are the same to within 3% across the five models, but decrease on different time scales. We find that the flows with higher incoming speeds relative to the detonation wave (simulations: and ) expand more slowly compared to those with lower incoming speeds (simulations: and ). Most burning to 56Ni occurs within 0.4 seconds after the temperature reaches its peak.
4.2.3 The Effect of Expansion Time Scale on the Nuclear Yields
Within the stellar material that has a final 56Ni mass fraction above 0.1, the peak temperature is high enough to ensure silicon burning. The final 56Ni yield depends on the peak temperature and the expansion time scale. Freeze out occurs for a nuclide when the temperature drops low enough that reactions become too slow to alter its abundance. Because this condition occurs at different temperatures for different nuclides, the final abundances depend on the rate at which the material cools.
The thermodynamic trajectories of the tracer particles (i.e. individual Lagrangian mass elements) processed by the detonation wave are well characterized by an exponential temperature dependence (Arnett et al., 1971; Woosley et al., 1973; Timmes et al., 2000; Meakin et al., 2009 and references therein)
| (5) |
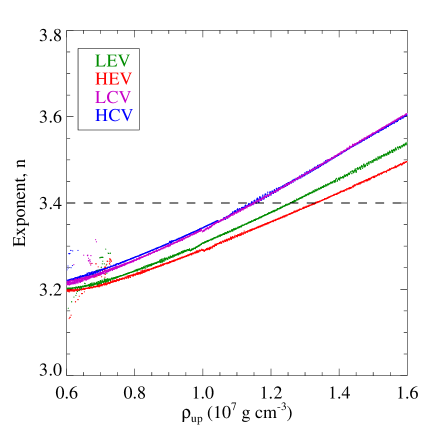
where is the initial temperature at which the nuclear burning begins and is the time scale for the temperature to decrease to 1/e of its initial value. This time scale characterizes the expansion of the fluid after it is compressed by the leading shock. The density is related to the temperature by the fitted formula
| (6) |
where n is a function of upstream density and varies between 3.2 and 3.6 over the range of densities for which the final 56Ni mass fraction lies above 0.1, as shown in Figure 9. In this work, we adopt a central value of .
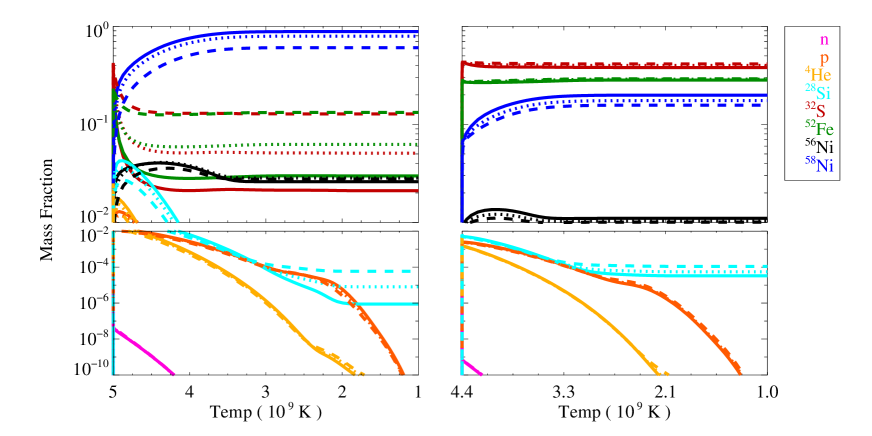
In order to study the sensitivity of the final 56Ni abundance to variations in , we used libnucnet to perform nucleosynthesis using thermal profiles that correspond to an exponential expansion. We chose peak density and temperature values that are characteristic of our tracer particle data. The initial composition consisted of equal masses of C and O, and the expansion timescale varied between 0.1 and 0.6, reflecting the estimated range seen in the tracer particle time histories in our models. The time evolution of selected isotopes is shown in Figure 10 for different expansion timescales and two different initial thermal conditions: an initial peak temperature of K and a density of g cm-3 (left panel), and an initial peak temperature of K and density of g cm-3 (right panel).
Stellar material with a similar initial density and temperature ends up with different abundances of 56Ni, depending on the history of the hydrodynamic expansion during the nuclear burning. Even in the case of stellar material that reaches the same peak temperature, the thermal profile with the longer (0.6 sec) expansion timescale produces more 56Ni while burning more 28Si than does with the shorter (0.1 sec) expansion timescale (see also Chamulak et al., 2012).
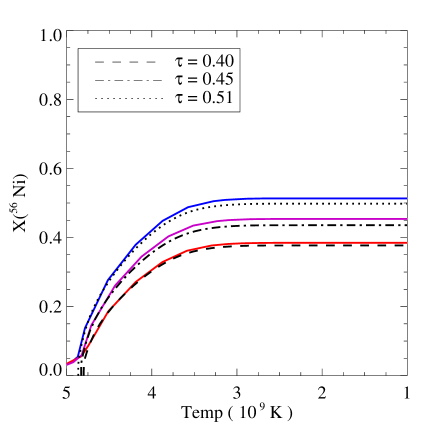
To demonstrate this point, we compare the nucleosynthetic yield for tracer particles in different models with that from the exponential thermal profiles in (5) and (6). For a given upstream density of , the temperature and density history of a tracer particle was analyzed and its expansion time scale estimated in three models: 0.4s in , 0.45s in , and 0.51s in . Nucleosynthesis was performed using both the temperature history of the tracer particles and the exponential temperature profiles. We compare the results in Figure 11. The tracer particle from the model model (shown in blue) has the longest expansion time scale, while the one from the model (shown in red) has the shortest. Importantly, the nucleosynthesis produced by each time history is consistent with that produced by an exponential temperature profile with a similar time scale. We conclude that the final 56Ni abundance is sensitive to the expansion time scale, and that the expansion time scale experienced by the tracer particles depends on the model. It does so because the models differ in the velocity of the upstream stellar material relative to the detonation wave in the laboratory frame.
4.3. Identification of a Physical Parameter That Can Be Used to Estimate Nucleosynthetic Yields
In , we showed that, even for similar fuel densities upstream of the detonation wave, the final nucleosynthetic yields vary depending on the thermal expansion history behind the detonation wave. Since the expansion time scale depends on the incoming velocity, we have demonstrated that the upstream velocity affects the final nucleosynthetic yields. In this section, we identify a physical parameter that is correlated with the expansion time scale, and that can therefore be used to estimate the final nucleosynthetic yields.
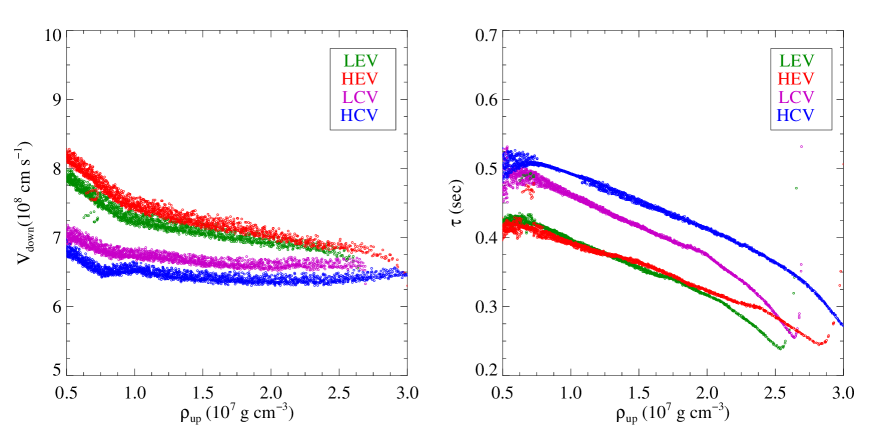
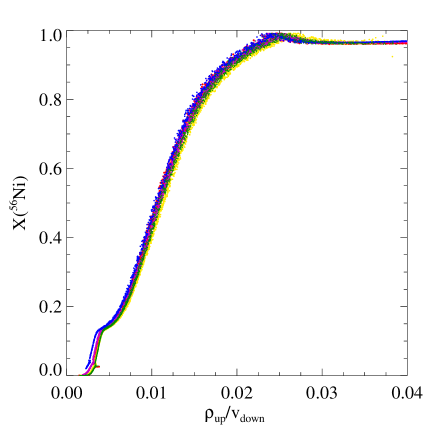
The detonation wave connects two different flows: upstream and downstream. Here we define upstream and downstream as the physical states immediately before and after the detonation wave. For the same , we found that the flow with a higher downstream velocity () expands faster than the flow with a low downstream velocity. This is illustrated in Figure 12, and indicates that the downstream velocity is a second important parameter affecting the thermal expansion behind the shock front and therefore the nucleosynthetic yield. In other words, flows with a higher downstream velocity yield lower 56Ni abundances. This suggests that a physical parameter formed by the ratio of and , i.e. , might be an even better estimator of the final abundance of 56Ni than alone. Figure 13 shows that this is indeed the case: the physical parameter formed by the ratio of upstream density and downstream velocity is able to predict the final abundance of 56Ni to within 10.
4.3.1 Intermediate Mass Elements
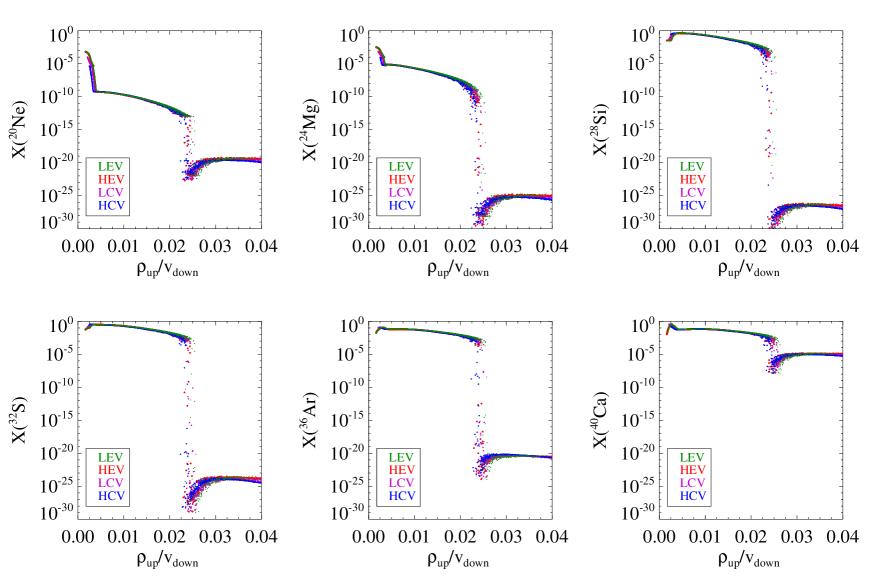
The timescale to burn to 56Ni is much longer than those to burn to the primary intermediate mass elements such as 20Ne, 24Mg, 28Si, 32S, 36Ar, and 40Ca. We therefore hypothesize that the physical parameter should be a good predictor for the final abundances of intermediate mass elements as well. Figure 14, which shows the final mass fraction of the intermediate mass elements as a function of the ratio of , shows that it is.
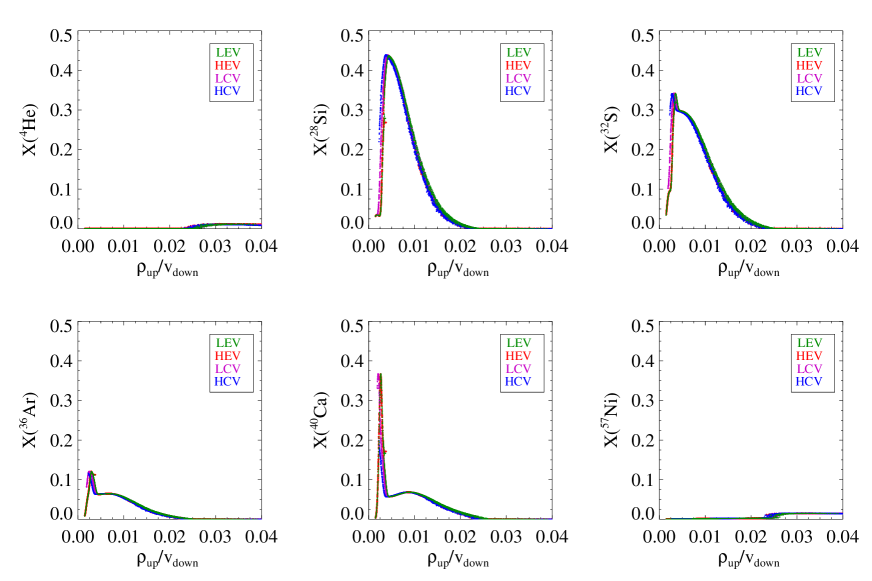
We also note two distinctive features in Figure 14. First, on the high-density branch (where ), the intermediate mass elements form at the expense of 56Ni. This is most likely due to the increased in entropy this mixture of elements represents. Second, on the low density branch (where ), the light -nuclei capture 4He and burn to heavier -nuclei, thus reducing the mass fractions of the lighter nuclei. The mass fractions of the most abundant elements in the range of interest are shown in the Figure 15. While 56Ni is the dominant product in the high density region, at lower densities, relaxation to NSE is incomplete and the final product is a mixture of intermediate mass elements.
4.4. Off-Center Detonation Models
We have also investigated off-center detonation scenarios using one-dimensional models detonated at a finite radius. These models enable us to determine whether the empirical relation we found in also holds in off-center (but still spherically symmetric) detonation models. To investigate this question, we used the same four initial density and velocity profiles as before: , , , and . We initiated an off-centered detonation in each at a distance of cm from the stellar center.
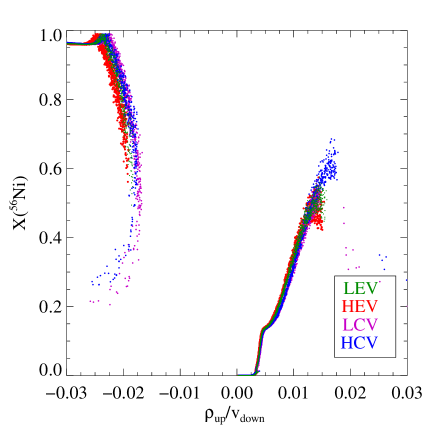
Figure 16 shows the final mass fraction of as a function of the empirical physical parameter for the four off-center detonation models. In the off-center detonation models, detonation produces an ingoing detonation wave as well as an outgoing detonation wave. The latter converges toward the center of the star, triggering a second explosion. In the region of the star where nuclear burning takes place as a result of the ingoing detonation wave, matter is driven inward by the detonation wave and the star is contracting. Consequently, vdown is negative in this region, as is the ratio of and vdown. An empirical relation still holds, but it is different for this contracting (high-density) branch where than for the expanding (low-density) branch.
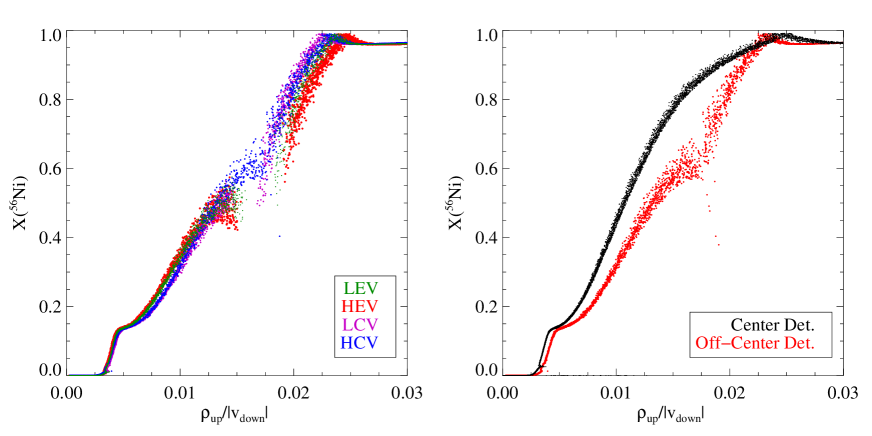
In order to better compare the relation between the physical parameter and the final mass fraction of 56Ni for the two regions, we replace vdown with its absolute value; the parameter then becomes . The resulting relation is shown in the left panel of Figure 17. The data in the vicinity of the detonation point are numerically noisy, and we have omitted them from the figure. The two branches join when plotted in this way. Although the empirical relation is not as tight for the contracting (high-density) branch as it is for the expanding (low-density) branch, the physical variable is able to predict the final abundance of 56Ni to within 15. This suggests that this physical parameter is a fairly robust predictor of the final nucleosynthetic yields.
The right panel in the Figure 17 compares the empirical relation between and the final abundance of 56Ni for the center and off-center detonation models for the initial stellar velocity profile. The results demonstrate again that the final nucleosynthetic yields cannot be characterized by the local values of density and velocity of the matter alone. Rather, they are affected by both the pre-existing velocity flow in the star and the post-detonation expansion of the star.
5. Conclusion
The explosion mechanism of Type Ia SNe is still an active topic of research, and among the leading paradigms for the explosion mechanism are the delayed detonation models. While many different delayed detonation scenarios have been published, we direct our attention to investigating the key common feature of the explosion that involves the propagation of the detonation wave in a non-static velocity field of a white dwarf. Although the most satisfactory approach to this investigation would be to simulate a multidimensional delayed detonation model on scales of an exploding white dwarf, this is a numerically challenging task, requiring a considerable amount of data storage and computation time. Furthermore, our primary interest lies in the role played by the velocity profile settled during the previous deflagrative phase in the evolution of the detonation. Therefore, we create simplified one-dimensional models that test mainly the effects of the pre-detonation stellar internal velocity profile and the post-detonation velocity of expansion on the production of -particle nuclei, including 56Ni.
We have studied the flow structure behind the traveling detonation wave front and observed two distinct expansion phases: rarefaction just behind the detonation wave and bulk expansion of the expanding white dwarf. The rarefaction timescale, or the expansion time scale studied in this work, was found to be not a function of detonation strength only, but is also influenced by pre-existing flow structure, depending on whether the initial configuration of the star is expanding or contracting. In our models, almost all the burning to 56Ni occurred only in rarefaction phase.
The relationship between the flow properties and the resulting 56Ni yields showed that the final yields of burned matter emerging from the detonation are highly sensitive to the expansion time scales of the flow behind the detonation, which is strongly conditioned by the pre-existing flow in the expanding or contracting progenitor star. The expansion time is longer for contracting stars and shorter for expanding stars, as the rarefaction proper to the detonation is combined with the pre-existing flow. With the greater expansion time scale, both temperature and density evolve relatively slowly, providing more time for 56Ni production.
We have also found an empirical relationship between the ratio of the upstream density to the post-shock velocity and the final 56Ni yield for central detonations. It is not surprising to find that 56Ni yield increases with increasing upstream density of fuel. However, we also find that the final post-detonation velocity is another parameter that influences 56Ni yield. The quantity / is tightly related with 56Ni yield, and produces relatively small scatter () about the relationship; however, the picture is more complicated for off-centered detonations. Currently this relationship is limited to one-dimensional models and we caution that the above results are preliminary. In more realistic SNe Ia models, detonations in white dwarfs not only show a rich multilevel cellular structure (Gamezo et al., 1999; Timmes & Swesty, 2000) but also travel through non-spherically symmetric stellar density distributions (Jordan et al., 2008; Meakin et al., 2009 and references therein). In addition, some explosion scenarios involve detonations propagating through partially burnt material as well as unburnt fuel. Thus, further analysis in higher dimensions will need to be carried out.

References
- Arnett et al. (1971) Arnett, W. D., Truran, J. W., & Woosley, S. E. 1971, ApJ, 165, 87
- Bravo & García-Senz (2006) Bravo, E., & García-Senz, D. 2006, ApJ, 642, L157
- Bravo & García-Senz (2009) Bravo, E. & García-Senz, D. 2009, ApJ, 695, 1244
- Bravo et al. (2009) Bravo, E., García-Senz, D., Cabezón, R. M., & Domínguez, I. 2009, ApJ, 695, 1257
- Calder et al. (2007) Calder, A. C., et al. 2007, ApJ, 656, 313
- Caughlan & Fowler (1988) Caughlan, G. A., & Fowler, W. A. 1988, At. Data Nucl. Data Tables, 40, 283
- see also Chamulak et al. (2012) Chamulak, D. A., et al. 2012, ApJ, 744, 27
- PPM; Colella & Woodward (1984) Colella, P. & Woodward, P. R. 1984, J. Comput. Phys., 54, 174
- Colella & Glaz (1985) Colella, P. & Glaz, H. M. 1985, J. Comput. Phys., 59, 264
- Cyburt et al. (2010) Cyburt, R. H., Amthor, A. M., & Ferguson, R. et al. 2010, ApJS, 189, 240
- see also Domínguez & Khokhlov (2011) Domínguez, I. & Khokhlov, A. 2011, APJ, 730, 87
- Fowler & Hoyle (1960) Fowler, W. A., & Hoyle, F. 1960, Ann. Phys., 10, 280
- Fryxell et al. (2000) Fryxell, B., et al. 2000, ApJS, 131, 273
- García-Senz et al. (2007) García-Senz, D., Bravo, E., Cabezón, R. M., & Woosley, S. E. 2007, ApJ, 660, 509
- Gamezo et al. (1999) Gamezo, V. N., Wheeler, J. C., Khokhlov, A. M., & Oran, E. S. 1999, ApJ, 512, 827
- Gamezo et al. (2004, 2005) Gamezo, V. N., Khokhlov, A. M., & Oran, E. S. 2004, Phys. Rev. Lett., 92, 211102
- Gamezo et al. (2005) ———–. 2005, ApJ, 623, 337
- Hillebrandt & Niemeyer (2000 and references therein) Hillebrandt, W. & Niemeyer, J. C. 2000, ARA&A, 38, 191
- Hflich et al. (1995) Hflich, P. A., Khokhlov, A. M., & Wheeler, J. C. 1995, ApJ, 444, 831
- Jordan et al. (2008) Jordan, G. C., IV, Fisher, R. T., Townsley, D. M., Calder, A. C., Graziani, C., Asida, S., Lamb, D. Q., & Truran, J. W. 2008, ApJ, 681, 1448
- Jordan et al. (2012) Jordan, IV, G. C., Graziani, C., Fisher, R. T., Townsley, D. M., Meakin, C., Weide, K., Reid, L. B., Norris, J., Hudson, R., & Lamb, D. Q. 2012, ApJ, 759, 53
- Khokhlov (1991) Khokhlov, A. M. 1991, A&A, 245, 114
- Meakin et al. (2009 and references therein) Meakin, C. A., Seitenzahl, I., Townsley, D., Jordan, G. C., Truran, J., & Lamb, D. 2009, ApJ, 693, 1188
- Meyer & Adams (2007) Meyer, B. S. & Adams, D. C. 2007, Met. Planet. Sci., 42, 5125 See also http://sourceforge.net/projects/libnucnet/
- Niemeyer & Woosley (1997) Niemeyer, J. C., & Woosley, S. E. 1997, ApJ, 475, 740
- Perlmutter et al. (1998) Perlmutter, S., et al. 1998, ApJ, 517, 565
- Plewa, Calder & Lamb (2004) Plewa, T., Calder, A. C., & Lamb, D. Q. 2004, ApJ, 612, L37
- Riess et al. (2001) Riess, A. G., et al. 2001, ApJ, 560, 49
- Schmidt et al. (1998) Schmidt, B. P., et al. 1998, ApJ, 507, 46
- Seitenzahl et al. (2009) Seitenzahl, I. R., Meakin, C. A., Lamb, D. Q., & Truran, J. W. 2009, ApJ, 700, 642
- Timmes & Swesty (2000) Timmes, F. X. & Swesty, F. D. 2000, ApJS, 126, 501
- Timmes et al. (2000) Timmes, F. X., Hoffman, R. D., & Woosley, S. E. 2000, ApJS, 129, 377
- Townsley et al. (2007) Townsley, D., et al. 2007, ApJ, 668, 1118
- Woosley et al. (1973) Woosley, S. E., Arnett, W. D., & Clayton, D. D. 1973, ApJS, 26, 231
- Wheeler & Harkness (1990) Wheeler, J. C., & Harkness, R. P. 1990, Rep. Prog. Phys., 53, 1467