Measuring the Mass Hierarchy with Muon and Hadron Events in Atmospheric Neutrino Experiments
Abstract
Neutrino mass hierarchy can be measured in atmospheric neutrino experiments through the observation of earth matter effects. Magnetized iron calorimeters have been shown to be good in this regard due to their charge identification capabilities. The charged current interaction of in this detector, produces a muon track and a hadron shower. The direction of the muon track can be measured very accurately. We show the improvement expected in the reach of this class of experiments to the neutrino mass hierarchy, as we improve the muon energy resolution and the muon reconstruction efficiency. We next propose to include the hadron events in the analysis, by tagging them with the zenith angle of the corresponding muon and binning the hadron data first in energy and then in zenith angle. To the best of our knowledge this way of performing the analysis of the atmospheric neutrino data has not be considered before. We show that the hadron events increase the mass hierarchy sensitivity of the experiment. Finally, we show the expected mass hierarchy sensitivity in terms of the reconstructed neutrino energy and zenith angle. We show how the detector resolutions spoil the earth matter effects in the neutrino channel and argue why the sensitivity obtained from the neutrino analysis cannot be significantly better than that obtained from the analysis using muon data alone. As a result, the best mass hierarchy sensitivity is obtained when we add the contribution of the muon and the hadron data. For , , a muon energy resolution of 2%, reconstruction efficiency of 80% and exposure of kton-year, we could get up to signal for the mass hierarchy from combining the muon and hadron data. The signal will go up when the atmospheric data is combined with data from other existing experiments, particularly NOA.
1 Introduction
The latest set of data from the reactor-based experiments Daya Bay [1], RENO [2] and
Double Chooz [3] have confirmed beyond all doubt
what the accelerator-based experiments T2K [4] and MINOS [5]
had earlier indicated – the value of the neutrino mixing parameter . The
implications of this discovery has far reaching implications in neutrino physics.
On the phenomenological front, this opens up the possibility for the determination of the
next two missing links in neutrino oscillation physics, viz., (i) the discovery of
CP violation in the lepton sector, and (ii) the sign of , aka, the
neutrino mass hierarchy. Next generation neutrino oscillation experiments are being
proposed to probe these two remaining issues. The optimal design of the next
set of neutrino oscillation experiments will depend on how well they can measure
CP violation and neutrino mass hierarchy, given that now we know that is
much larger than previously thought. The fact that the sensitivity of the proposed experiment
to one of these parameters could be severely restricted by the uncertainty on the other parameter
makes the designing of the experiments all the more challenging.
Of the two unknowns mentioned above, measurement of CP violation is trickier for a variety of
reasons. CP violation in neutrino oscillations is necessarily a
sub-leading effect and is expected to be be in the -driven appearance channel,
.
Therefore, it is necessary to have a non-zero for the measurement of the CP phase.
However, the fact that has turned to be relatively
large might prove counter-productive for the CP
violation searches. The reason mainly being that the CP violation effects in the appearance
channel become further sub-dominant compared to the main CP independent
driven oscillations for such large values of . This makes the latter an irreducible
background, decreasing thereby the sensitivity of the experiment
for CP searches [6, 7]. The uncertainty regarding the neutrino mass
hierarchy introduces another limitation on these experiments through the mass hierarchy
parameter degeneracy, deteriorating further the sensitivity of the experiment to the
CP phase.
Measurement of the neutrino mass hierarchy on the other hand certainly becomes easier as
the true value of increases. This parameter is expected to be measured using earth
matter effects in neutrino oscillations. The earth matter effect increases monotonically with the value of
, making their detection in terrestrial experiments easier for larger .
The atmospheric neutrino experiments in this regard could play a crucial role in the
field of neutrino physics in the future. The possibility of measuring the neutrino mass
hierarchy in atmospheric neutrino experiments have been considered in details in the
literature [8]-[27]. Upcoming detectors for atmospheric neutrino include
the magnetized Iron CALorimeter detector at the India-based Neutrino Observatory
(ICAL@INO) [29], the megaton-class water Cherenkov detectors such those proposed for the
Hyper-Kamiokande project [30] and as the far detector of the CERN-Frejus long baseline
experiment [31], the large liquid argon detectors [32], as well as the
giant ice detector PINGU [33].
Recently, we considered the sensitivity
of the ICAL@INO experiment to the measurement of the neutrino mass hierarchy [28]
and the atmospheric neutrino oscillation parameters [34].
These studies were performed as a part of the on-going efforts of the INO collaboration
towards the simulation of the ICAL detector and
the analysis of the simulated data to determine the physics reach of the ICAL@INO
experiment. When combined with
expected data from all the current accelerator and reactor experiments,
Daya Bay, RENO, Double Chooz, T2K and NOA, kton-year
of data from ICAL@INO was shown to give a mass hierarchy sensitivity of ,
depending on the true value of , and . However, note that
these analyses were based on using only the muon sample of the simulated INO
data. The full detector response to muons obtained from detailed Geant-based simulations
of the ICAL detector [35] were used in these studies and the sensitivity of the
experiment to the neutrino oscillation parameters estimated. In particular,
the muon energy resolution was seen to be around ,
below what has been found from simulations of other similar detectors such as
MINOS and MONOLITH [36].
However, the simulations of
the ICAL detector is on-going and the results obtained on the detector response to muons
is expected to evolve along with the improvement in the detector simulation code as well as
the analysis. Amongst other things, the reconstruction algorithm is being improved upon,
which would allow for better reconstruction of the muon track which could lead to better
energy resolution of the muons. In addition, ICAL will also be somewhat sensitive to the
associated hadron(s) which produce(s) a shower. The detector response to the hadron
shower and in particular the hadron energy resolution was recently studied by the INO
collaboration and presented in [37].
In this paper we study how much the mass hierarchy sensitivity of the ICAL@INO, or
any other similar experiment, could improve, by improving the energy and angle
resolution of the detector, as well as its particle
reconstruction efficiency. We start with the muon event analysis
and study how much the mass hierarchy sensitivity
would improve with the energy resolution of the muons. Since the angular resolution
of the muons obtained from the recent simulation results by the INO
collaboration is found to be extremely good, we fix the angular resolution to
be in , a value that is consistent with the
simulation results [35], and vary only the energy resolution. We also study the
impact of increasing the reconstruction efficiency of the muons, though this is more
mundane as the reconstruction efficiency merely increases the overall statistics of the
muons.
We next include the hadron events in the study and present
results of a statistical analysis where muon and hadron events are included separately
in a combined function.
To the best of our knowledge, this way of analyzing the
muon and the hadron data from atmospheric neutrino events
has never been considered before.
We propose a unique way of tagging the hadron events. We tag every
hadron event with the zenith angle of the corresponding muon produced in
the charged current interaction of the neutrino. We collect all
such hadrons in every muon zenith angle bin. This hadron sample can then
be further binned in hadron energy as well as hadron zenith angle.
We include these hadron events in the statistical analysis along with the muons and
show that the mass hierarchy sensitivity of the experiment improves reasonably
with the inclusion of these events.
Most analyses of the atmospheric neutrino experiments are in terms of the reconstructed
neutrino energy and zenith angle.
The neutrino energy and
zenith angle can be reconstructed
from the measured energy and zenith angle of the muon and hadron events.
The dependence of the mass hierarchy sensitivity to the reconstructed neutrino energy and
angle resolution functions has been studied in somewhat details in the literature
[16, 20].
Reconstructing the neutrino energy in magnetized iron detectors
can be done without too much difficulty by adding the measured muon energy with
the measured hadron energy. While the final simulation results from the INO collaboration
are still awaited, the MINOS simulations have yielded an energy resolution
while the MONOLITH
proposal quotes [36].
On the other hand, the neutrino zenith angle will have to be extracted either
by reconstructing the
neutrino momentum from combining the
muon and hadron momenta, or from simulating the angle between the
neutrino and muon direction.
In this paper, we will present results on the neutrino analysis
for two cases. In first one we will bin the data in neutrino energy and neutrino zenith angle bins.
We will use the zenith angle resolution function for the neutrinos quoted in the MONOLITH
proposal [36], and show the mass hierarchy sensitivity results as a function of the neutrino
energy resolution. For the next case we will bin the data in neutrino energy and muon zenith
angle bins.
For this case we will use a fixed muon
zenith angle resolution function which agrees with
the results of the INO muon simulations. We will compare the sensitivity results obtained
from the two cases.
A discussion on marginalization of the over all the oscillation parameters in the
fit is in order. It is well known that marginalization over the oscillation parameters
does reduce the mass hierarchy sensitivity when the atmospheric data is taken alone.
However, we had shown in [28] that when we do a combined fit of the atmospheric
neutrino data along with the data from the other accelerator and reactor experiments,
Daya Bay, RENO, Double Chooz, T2K and NOA, then the
remains the same as that obtained by keeping all parameters fixed at their
assumed true values. Since data from these accelerator and reactor experiments will
anyway be available by the time we get the atmospheric neutrino data from any
magnetized iron detector, it is pertinent is always add them in the fit. This is what was
done in [28]. In this paper, since we wish to only study how to optimize the
analysis of the atmospheric neutrino data for maximum mass hierarchy sensitivity,
we do not explicitly include the accelerator and reactor data. However, since their
major role in the global analysis is to keep best-fit , and very close to
their assumed true values,
we incorporate this feature by keeping these parameters fixed in the fit. The main
purpose for this simplification is to save computation time as the main physics
impact is incorporated anyway. The accelerator experiment NOA also
gives a contribution to the neutrino mass hierarchy. But it was shown in [28, 27]
that this does not lead to any synergy between the atmospheric
neutrino data and NOA data. Therefore, the additional contribution from NOA
(as a function of the true value of )
can simply be added to the obtained from the atmospheric neutrino data.
The paper is organized as follows. We start with a description of the earth matter effects in
section 2. In section 3 we discuss the events in terms of the neutrino energy spectrum,
muon energy spectrum and hadron energy spectrum. We begin our main results part in
section 4 where we give the mass hierarchy sensitivity when only the muon data is
included and show the effect of the
muon energy resolution and
reconstruction efficiency on the reach of the experiment in ruling out the wrong hierarchy.
In section 5 we should how the mass hierarchy sensitivity improves when we include the
independent hadron events in addition to the muon events in the analysis. Section 6
gives the comparative results when we do the analysis in terms of the neutrino energy and neutrino
angle as well as in terms of neutrino energy and muon zenith angle. We end the paper in
section 7 with our conclusions.
2 Earth Matter Effects in Oscillation Probabilities
Atmospheric neutrinos (and antineutrinos)
are produced in both and (and and )
flavors, with a flavor ratio of roughly
at sub-GeV energies. This ratio increases
with the neutrino energy. The neutrinos, on their way from their point of production in
the atmosphere to the detector, undergo flavor oscillations. On arrival at the detector, they
produce the corresponding charged lepton through charged current interaction on
nucleons. Since the oscillated atmospheric neutrino “beam” is a combination of
all three flavors, they produce electrons, muons, as well as tau leptons in the detector.
Magnetized iron calorimeters such ICAL@INO
can only efficiently detect the muons, and are hence
sensitive to only muon type neutrinos. However, being magnetized, this kind of
detector will be
able to identify the charge of the muon and hence will be able to separate the
signal from the signal very efficiently.
Since the oscillated muon type neutrinos arriving at the detector are a combination of the survived produced in the atmosphere and the flavor oscillated coming from produced in the atmosphere, the oscillation probability channels relevant for atmospheric muon neutrinos are the survival probability and transition probability . If for the sake of simplicity of discussion we take , then for the oscillation probabilities can be written as
| (1) | |||||
and
| (2) |
where is the matter potential in earth, being the electron density inside earth and the neutrino energy. The quantities and are the mass squared difference and mixing angle in constant density matter and are given as
| (3) |
| (4) |
We can see the role of -driven
earth matter effects and the neutrino mass hierarchy through these expressions. For
, we get and
from Eqs. (3) and (4). Plugging these values in
Eqs. (1) and (2) we find that we
would have no earth matter effects in neutrino oscillations for . In particular,
we can see that and
is the same for both normal ()
as well as inverted hierarchy (). However, for
non-zero we get a difference in as well as
between and due the earth matter effects.
This difference can be used to distinguish between the normal and inverted
neutrino mass hierarchy.
In the discussion above we had put and used a constant density for the matter for simplicity of the discussion. In all numerical results presented in this paper we use the full three-generation oscillation probability calculated using the 24 layer PREM profile for the earth matter density [38]. For , it turns out that the survival probability becomes different for and , even for . This aspect has been discussed in detail in [39, 40]. It was shown that one could define an effective mass
| (5) |
such that this issue could be alleviated.
It was shown that with this if one defined normal hierarchy as and
inverted hierarchy as , then
is the same for normal and inverted
hierarchies when . Though this complication in the definition of the
mass hierarchy does not
make much difference
to the final neutrino mass hierarchy sensitivity results when one marginalizes correctly over
(for a very recent discussion see [28]), we will continue to use this definition for the
normal and inverted hierarchy, especially since in this paper we will not marginalize our
function over the oscillation parameters, as discussed in the Introduction section.
| Parameter | True value used in data |
|---|---|
| eV2 | |
| 0.3 | |
| eV2 | |
| 0 | |
| 0.5 | |
| 0.1 |
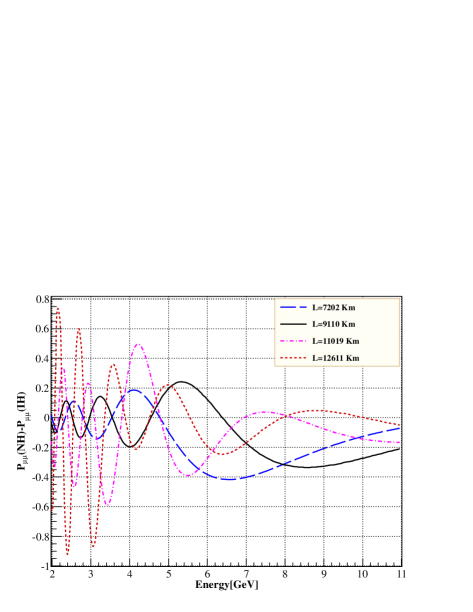
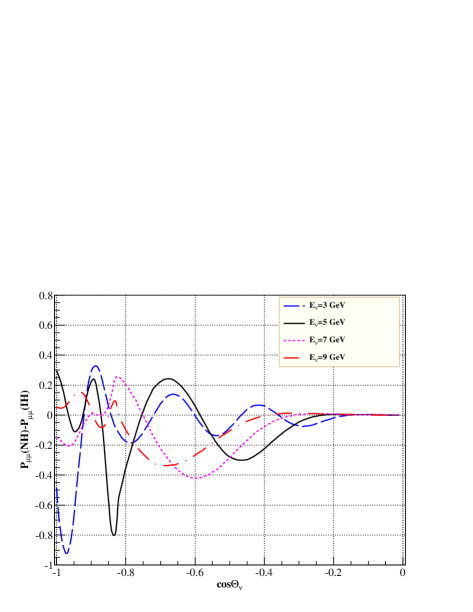
We show in Fig. 1 the difference between the survival probability predicted for the normal () and inverted () hierarchy. This figure has been generated by calculating the full three generation survival probability at the benchmark oscillation parameter values given in Table 1 and for the 24 layer PREM profile of the earth [38]. We show the difference
| (6) |
as a function of the neutrino energy in the left panel of Fig. 1 for four
different zenith angles of the neutrino –
the blue long-dashed line being for km (),
the black solid line being for km (),
the pink dot-long-dashed line being for km (), and
the red short-dashed line being for km ().
The right panel of Fig. 1 shows this difference as a
function of the neutrino zenith angle , for four different
neutrino energies – the blue long-dashed line being for GeV,
the black solid line being for GeV,
the pink short-dashed line being for GeV, and
the red long-dashed line being for GeV.
We notice that fluctuates and changes sign as we change both
the neutrino energy as well as the neutrino zenith angle.
The sign of is crucial,
as it tells us whether earth matter effects increase or decrease the survival
probability.
Since
oscillates from positive to negative with energy and zenith angle,
averaging it over either or both of these quantities will severely
deplete and wash out the net earth matter effects in the signal
at the detector. Therefore, observation of earth matter effects in
is best performed with
detectors having good energy as well as zenith angle resolution.
The fluctuations in
are seen to be faster for lower energies and longer baselines.
In particular, for the zenith angles when the neutrinos cross the
core of the earth, is seen to be
much more complicated.
One can notice that for GeV,
earth matter effects are significantly stronger for these cases.
This
sharp increase in is due to the so-called parametric
enhancement of earth matter effects [41], also known as
oscillation length resonance effects [42].
While the matter effects are large here, the Fig. 1 reveals that
that the sign of
fluctuates very fast between being positive and negative, in this regime.
This rapid fluctuation, as we will see later, will make the observation
of earth matter effects extremely difficult at these energies and zenith angles.
One would need extremely good reconstruction of the neutrino energy and angle
for the observation of these parametric resonance effects.
Even for mantle crossing trajectories and/or higher
neutrino energies,
fluctuates sign between positive and negative. However,
the fluctuations are milder.
Indeed from both the left as well as the right panel of Fig. 1
we note that for all baselines,
stays predominantly negative for neutrino energies GeV.
In particular, we can see that
for a wide range of
and . In these cases the earth matter effects
come mainly from the
standard MSW [43] enhancement of the oscillation probability.
The corresponding oscillation probabilities for the muon antineutrinos is same with the matter term replaced with everywhere. Therefore, for the antineutrinos the effect of earth matter will be exactly opposite to what we see for the neutrinos. In particular, the antineutrino signal would see earth matter effects for the inverted hierarchy. If the antineutrino flux and cross-sections were same as the ones for the neutrinos, then adding up the data from neutrinos with those from the antineutrinos would completely wash out the earth matter effects between the normal and inverted hierarchy. However, in reality the antineutrino fluxes and cross-sections are smaller than those for the neutrinos, and hence a resultant mass hierarchy effect would survive even on adding the neutrino and antineutrino data. However, the magnetized iron calorimeters such as ICAL@INO, have excellent charge identification capabilities and hence can distinguish the neutrinos from the antineutrinos. Therefore, these detectors can observe earth matter effects separately in both the neutrino as well as the antineutrino channels. Therefore, instead of partially washing the net earth matter effects, the antineutrino channel in these detectors add to the mass hierarchy sensitivity.
3 Earth Matter Effects in Event Rates
We discussed the energy and zenith angle dependence of the earth matter effects in the muon neutrino survival probability in the previous section. However, what arrives at the detector has impact from a combination of the survival probability and the conversion probability . Though the survival probability dominates, the conversion probability has the effect of washing out partially the effect of earth matter and hence the mass hierarchy. In addition, the neutrinos interact with the detector nucleons through a charged current interaction to produce the corresponding muon and final state hadron(s). What is measured in the detector is the energy and zenith angle of the final state particles, viz., the muon and, if possible, the hadron(s). A neutrino of energy could produce muons with any energy . The same argument hold for the the zenith angle dependence as well. We had seen in the previous section that the net hierarchy effect in oscillates between being positive and negative, both with energy as well as zenith angle. Therefore, in going from the neutrino energy to the muon energy through the interaction cross-section, what we effectively get is a smearing of the hierarchy dependent earth matter effects. This results in loss in the sensitivity of the experiment to the neutrino mass hierarchy. The finite detector resolutions for the energy and angle measurements further deteriorates the sensitivity. The only way to regain the sensitivity will be to simultaneously measure the energy and zenith angle of both the muon and the corresponding hadron, in order to reconstruct the neutrino energy and zenith angle. However, since the muon, and particularly the hadron, energy and angle cannot be measured very accurately in the iron calorimeter detector, the reconstruction ability of the experiment suffers. In this section we will show how the neutrino mass hierarchy sensitivity in the event spectrum changes with:
-
•
going from measuring the events in terms of neutrino energy and zenith angle to muon and hadron energy and zenith angle,
-
•
inclusion of the appearance channel ,
-
•
inclusion of the finite detector resolutions.
We show the dependence of mass hierarchy sensitivity on these issues first in the muon event spectrum, then in the hadron event spectrum and finally in the neutrino event spectrum.
3.1 Earth Matter effects in Muon Events
For generating the unoscillated (and ) event spectrum, we have used the NUANCE event generator [44] with Honda et al. fluxes [45]. We use a re-weighting algorithm on these raw events to obtain the oscillated event spectrum. This is then folded with the detector response functions in order to simulate the measured event spectrum in the detector as follows: 111Details of how we simulate the atmospheric neutrino events in the detector can be found in [28, 34].
| (7) |
where and are the number of oscillated and events respectively, in the bin, and corresponds to a specific exposure for the experiment. An expression similar to Eq. (7) can we written for the events . The summation is over where scans all true muon energy and muon zenith angle bins. The distinction between the true and measured parameters are as follows. The quantities and are the true (kinetic) energy and true zenith angle of the muon, while and are the corresponding measured (kinetic) energy and measured zenith angle obtained from the observation of the muon track in the detector. The reconstruction efficiencies of and in the bin are given by and respectively, while and are the corresponding charge identification efficiencies. We take the resolution functions and to be Gaussian,
| (8) |
| (9) |
respectively. While the reconstruction efficiencies, charge identification
efficiencies as well as the resolution functions could be
function of both the muon energy and muon zenith angle [35, 28, 34],
in this paper we will use flat projected values for these parameters.
This is justified as the results presented here are for the sake of illustration only
to show the dependence of the neutrino mass hierarchy to the
different ways of treating the data and their corresponding
detector response functions. Since the first set of simulation results
performed by the INO collaboration have shown extremely good
muon zenith angle resolution, we will fix for
all muon energies and zenith angles, throughout this paper. The charge identification efficiency
is also fixed at flat 99% everywhere. The muon energy resolution and the
reconstruction efficiencies are allowed to vary. We will mention this as and when
applicable. All detector response functions are taken to be the same for the
and events.
As discussed before, for normal (inverted) hierarchy we expect earth matter
effects in the () events, while for inverted (normal) hierarchy
there will be no earth matter effects in the () channel.
To quantify the mass hierarchy sensitivity of the experiment, we simulate the
and data separately for the normal mass hierarchy
and fit this data with the inverted mass hierarchy.
Therefore for this example case, there will be earth matter effects in the
events in the data, while no earth matter effects in the theoretical fit. On the other hand,
for the channel, there will be no earth matter effects in the data sample, but
the theoretical prediction for the event spectrum will have earth matter effects.
Because the magnetized iron calorimeter such as ICAL@INO will
have excellent charge identification capabilities, it can distinguish the signal
from the one.
What is relevant for mass hierarchy studies will then be the difference between the
predicted events for normal and inverted mass hierarchies, separately in the
and channels.
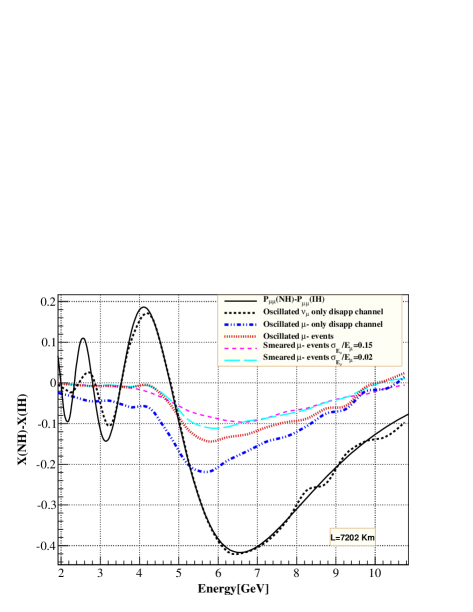
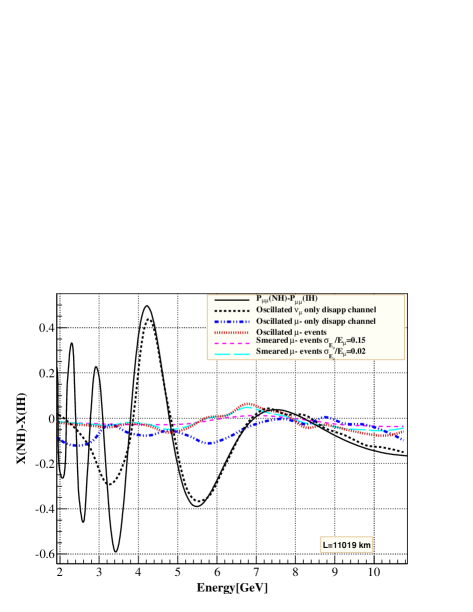
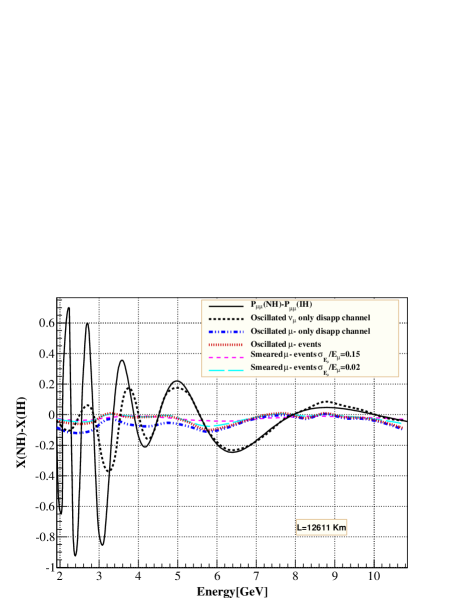
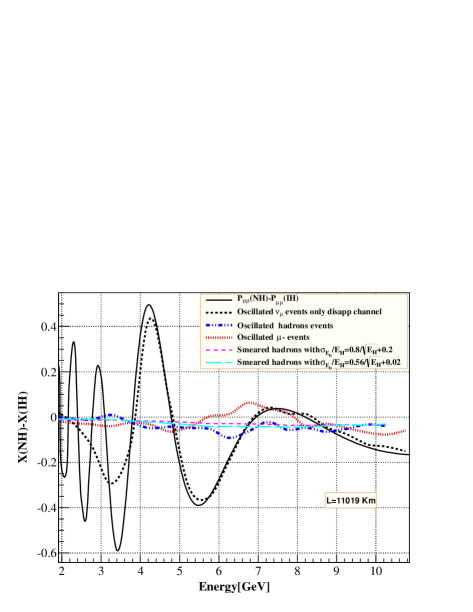
We present this difference for events
in Fig. 2. A similar figure can be drawn for the events, but
we will not repeat it here.
The four panels of this figure are for
four different zenith angles, and hence, four different path lengths of the neutrino in earth,
km, 9110 km, 11019 km and 12611 km.
The different lines in this figure are
as follows. The black solid lines give ,
(cf. Eq. 6) as a function of the neutrino energy .
These are same as those shown in the left panel of Fig. 1 and have been
repeated here to show the impact of the interaction cross-section on
the mass hierarchy sensitivity.
All other lines in this figure show the difference between the predicted
events for normal and inverted hierarchies, normalized to the unoscillated events.
Each muon event output from Nuance is characterized in terms of the incoming
true neutrino angle and energy and outgoing true muon angle and energy.
Therefore, we can bin the data in either the neutrino energy or the muon
energy.
The black dashed lines show this difference when the data is binned in
true neutrino energy and angle bins and only the muon neutrino survival probability
is taken into account. The x-axis for these lines are therefore the
true neutrino energy .
We can see
that the the black dashed lines follow the black solid lines to reasonable accuracy.
This is expected since we have used only for the event difference shown by
the black dashed lines, and since it is binned in terms of the neutrino energy and angle,
it has a one-to-one correspondence with the difference shown by the
back solid lines. The small difference between the two sets of curves comes mainly due to the
Monte Carlo fluctuations in the NUANCE output.
Next we use the same data set where only the
survival probability is considered and bin the data in terms of the
true muon energy .
This is shown by the blue dot-dashed curves in Fig. 2.
The x-axis for these lines are therefore the
true muon energy .
Notice now
that the event spectrum now gets degraded in energy. For example for km case,
while the maximum difference due to earth matter effects were coming at GeV in terms of the
true neutrino energy, it appears at GeV in terms of the true muon energy.
Notice also that the net earth matter effect is also substantially reduced in going from neutrino
energy to muon energy. This mainly comes due to the kinematic averaging effect of the
neutrino-nucleon cross-sections wherein a neutrino with a given neutrino energy
could produce a muon with any energy between and zero. This results in
the smearing out of the oscillation effects of and since the
fluctuates between being positive and negative, the averaging
brings about a net cancellation of the earth matter effects.
However, despite this kinematic smearing of the signal, some residual earth matter effects
remain with predominantly.
In particular, for the mantle-crossing bins shown in upper panels for km and 9110 km in Fig.
2, the for all muon energies and
we get at GeV and GeV,
respectively. Since the oscillations in the net earth matter effects are
larger for the core-crossing bins shown in the lower panels for km and 12611 km in Fig.
2, the smearing is more pronounced for these zenith angles.
As a result, even though the actual earth matter effects in the neutrinos are much larger for these
zenith angles, in the muon sample the averaged for these bins are significantly lower.
Still there is some residual earth matter effects with predominantly, for
most muon energies.
The blue dot-dashed lines that we discussed above have contribution from only the survival probability channel . However, since both and are produced in the earth’s atmosphere, some of the arriving at the detector will be the ones produced as and which have oscillated into through the conversion probability. These “appearance events” have to be added to the ones we had obtained using the survival probability , to obtain the final muon event spectrum which will be observed in magnetized iron detectors such as ICAL@INO. These are shown by the red dotted lines in Fig. 2. A comparison of the red dotted lines with the blue dot-dashed lines reveals the impact of the channel on the net earth matter effects and hence the mass hierarchy sensitivity of atmospheric neutrino experiments. The effect of is to reduce for all energies and all zenith angles. The reason for this can be seen from comparing the simplified expressions given in Eqs. (1) and (2). We can see that one can write
| (11) | |||||
We note that appears with a negative
sign in the approximate expression for .
Since the resultant muon flux at the detector is a sum of the
and probabilities multiplied by the
corresponding atmospheric neutrino fluxes,
the contribution to earth matter effects coming from
get partially cancelled
with that coming from . In Fig. 2
this is reflected in the reduction of
when going from the toy case where only driven events were considered
(blue dot-dashed lines) to the realistic case where both
and are taken (red dotted lines) into account.
In particular, for the km case, the changes from
to at GeV.
From the figure one can see the reduction in mass hierarchy
sensitivity for other baselines as well.
Finally, we impose the muon energy resolution on the event sample. This, as expected, brings about a further smearing of the energy spectrum. We use a Gaussian energy resolution function for the muons as given by Eq. (8). We show the impact of this smearing in Fig. 2 by the cyan long-dashed lines () and the pink short-dashed lines (). The effect of putting the muon energy resolution function is obviously to further smear the energy spectrum and the higher the , the higher will be the smearing, as seen in the figure. Nevertheless, we can see that even after imposing the energy resolution we have a residual which can be used to distinguish the normal from the inverted hierarchy. It is this final residual which translates into the for the wrong neutrino mass hierarchy in our statistical analysis.
3.2 Earth Matter Effects in Hadron Events
The charge current interaction of in the detector produces a hadron (or a bunch of
hadrons) in addition to the muon. While the muon moves over long distances making
long tracks in the detector, the hadron(s) produce(s) a shower.
The INO collaboration has
performed their first set of simulations studying the response of the ICAL detector to
hadrons. The results showing the calibration of the detector to hadron energy and
the corresponding hadron energy resolution have been presented in [37].
The study of the hadron response of the MONOLITH detector proposal was made in detail,
both in computer simulations as well as by putting the prototype in a test beam
[46, 47]. The energy and angle resolution of
the hadron shower has also been studied extensively by the MINOS collaboration.
In all works so far, the information from the hadrons have been used to reconstruct the
neutrino energy and angle. However, we propose a different method of treating the
hadron data. We will take the hadron data at par with the muon data and add their contribution
to the statistical analysis of the mass hierarchy sensitivity of the magnetized iron detector.
To the best of our knowledge, this has not been done before.
In order to add the hadron contribution to the mass hierarchy sensitivity, we first need to
bin the hadron data in a suitable way.
In this paper we treat the hadron event sample of magnetized iron detectors as follows. Since every
hadron shower is associated with a corresponding muon coming from the same charged
current interaction vertex of the neutrino, we use the muon as a tag for the hadron event.
Since the muon zenith angle is reconstructed extremely well, we tag the hadron
with the zenith angle of the corresponding muon.
This means that for every muon in a given muon zenith angle bin,
we group together all the corresponding hadrons. We next bin this group in terms of
the hadron energy.
Note that the most obviously way to calculate the true energy in the hadrons would be by adding
up the energy of the hadrons in the final state for each event.
When handling real data, this is what will be done.
However, in our analysis we do not have real data. We only use the output of the event generator
as our simulated data. Here a complication arises due to the fact that
the final state provided by NUANCE has a large number
of additional
hadrons, which come from the breaking of the iron nucleus. Hence, adding them
all up does not directly help in finding the energy released in the hadron due to the charged
current interaction.
Therefore instead of doing that, we calculate , where
is the true energy of the incoming neutrino and is the true energy of the
muon, provided by the event generator. We call the true energy in the hadrons.
Having calculated the energy of all the associated hadrons in a given muon zenith angle bin,
we redistribute these events in hadron energy bins, starting from 0.5 GeV to
10.5 GeV.
Following this methodology for hadron binning, the number of hadron events in each hadron energy bin can be written as
| (12) |
Since we use the muon events as a tag and calculate the hadron energy binned data for every muon zenith angle bin, we calculate the hadron events corresponding to the events (denoted as in Eq. (12)) as well as the ones associated with the mis-identified as (denoted as in Eq. (12)). The quantities and are the charge identification efficiencies of and events, respectively, as defined in Eq. (7). The reconstruction efficiency of the hadron shower is given by , and in this paper it is taken to be the same for hadrons associated with both and . In the way we are handling the hadron events, we also multiply our events with and for the and events respectively, since we first look at events which already have a muon track reconstructed. From this set of events we find the subset for which even the hadron shower can be reconstructed. is the energy resolution function of the hadrons, for which we use a Gaussian function similar to Eq. (8)
| (13) |
where
and
correspond to the true energy and measured energy of the hadrons
respectively. We need to put which is the muon zenith
angle resolution given by Eq. (9) in the above since
the hadrons are binned inside the muon zenith angle bin. Note that the
Eq. (12) gives the data binned in hadron energy only.
When we bin the data in both the hadron energy as well as zenith angle,
we will have to introduce the integral for the measured
hadron angle bin and the corresponding hadron angle resolution function. We will
discuss this later in section 5.2.
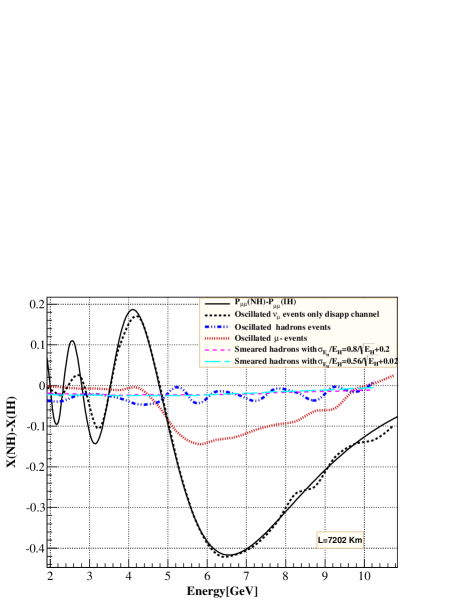
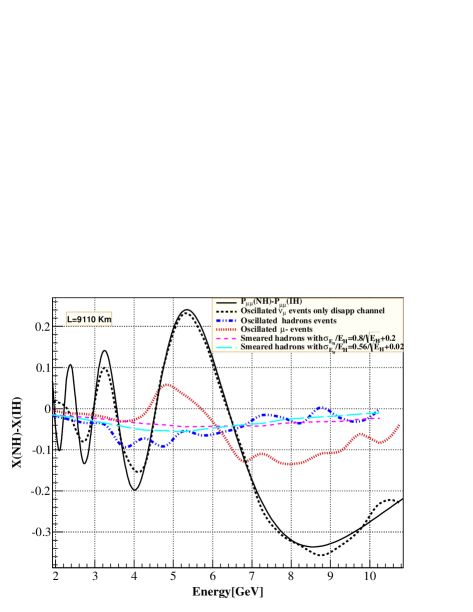
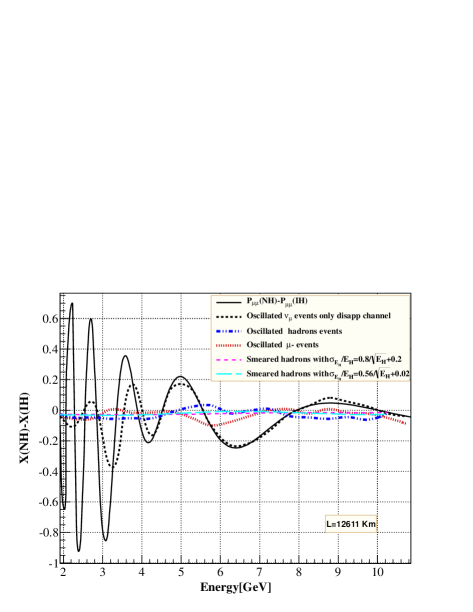
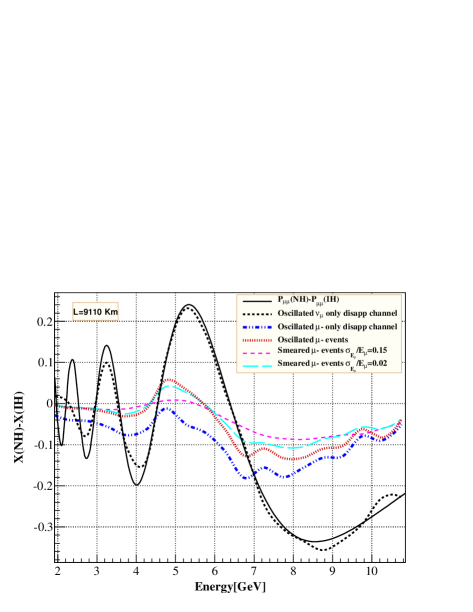
In Fig. 3 we show this binned data for the hadrons for four muon zenith angle bins corresponding to path lengths of km (top left panel), km (top right panel), km (bottom left panel), and km (bottom right panel). The hadron energy spectrum, without putting any energy resolution is shown by the blue dot-dashed lines in Fig. 3. We can see that even for the hadrons predominantly, for all hadron energies. In fact, we can see that for a wide range of hadron energies, for all muon zenith angle bins. The pink short-dashed and the cyan long-dashed lines show the hadron spectrum smeared by and , respectively. Since the shape of the hadron energy spectrum shown by the blue dot-dashed lines was anyway almost flat, the further smearing of spectrum due to the finite energy resolution of the detector does not bring about any drastic change in the spectral shape. Indeed the spectra for and look almost identical to each other. As in Fig. 2, the black solid lines in all the panels show the at the probability level. Likewise, the black dashed lines correspond to difference in the event spectrum between normal and inverted hierarchies in terms of the neutrino energy with only the disappearance channel. The red dotted lines in all the panels show the event spectrum in terms of the true muon energy, where we have included events from both the disappearance as well as appearance channels but have not incorporated the muon energy resolutions. These lines again are the same as the red dotted lines in Fig. 2. Therefore, the black solid lines, black dashed lines and the red dotted lines and have been shown here again for comparison of the hadron spectrum with the corresponding neutrino and the muon spectra.
3.3 Earth Matter Effects in Neutrino Events
If the data is classified in terms of the neutrino energy and zenith angle, then the event spectrum is given as
| (14) |
where all quantities are similar to those defined for the events in Eq. (14)
with the only difference that they now correspond to the neutrinos rather than to the muons. The
charge identification efficiency is the only one which will be identical in the two cases. The resolution
functions and
are also taken as Gaussian and their expression same as given for the muons but with the
energy and angle resolution widths replaced by the corresponding ones for the neutrinos.
A similar expression for the antineutrino events can also be written.
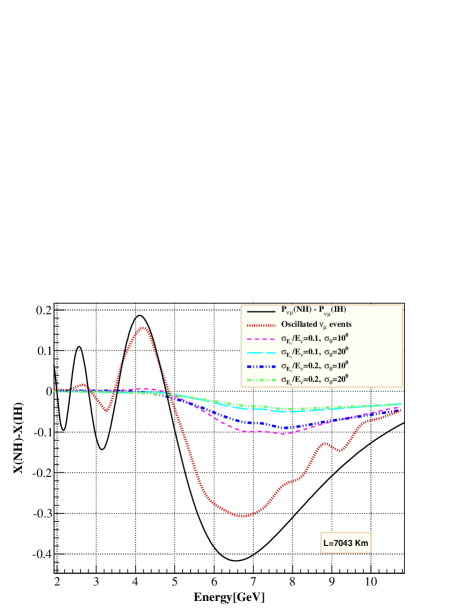
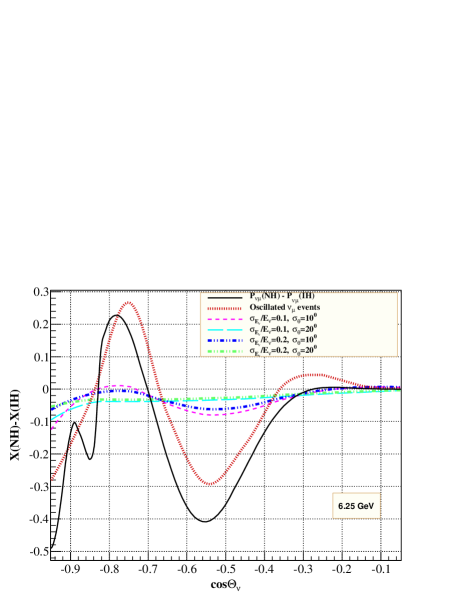
The
difference in the neutrino event
spectrum between the normal and inverted hierarchy normalized to the no-oscillation
event rate
is presented in Fig. 4. The left panel of the figure shows the difference
between the neutrino events for normal and inverted hierarchies
as a function of the neutrino energy in the zenith angle bin corresponding to .
The right panel shows the as a function of the neutrino zenith angle for the energy
bin corresponding to 6.25 GeV. The black lines in the figure show the , as before.
The red dotted line is the observed
neutrino event spectrum obtained when we take both the disappearance
() as well as appearance () channels into account.
Note that as in the case of the muons, the inclusion of the appearance channel
spoils the extent of hierarchy sensitivity in the neutrino spectrum.
Yet, it is evident from a comparison of the Figs. 2 and 4 that
the net hierarchy sensitivity at this stage is greater in the neutrino case. The reason is because
in the case of the muons there was a smearing of the spectral shape due to the
kinematic averaging of the oscillation effects due to the interaction cross-section.
However, the muon events have an advantage that the zenith angle of the muons
can be very accurately reconstructed. Hence any further deterioration in the sensitivity comes
mainly from the energy resolution of the muons. In the case of the neutrinos, both the energy as well as
the zenith angle dependence of the signal gets smeared due to the finite detector resolutions.
We show the impact of the resolution functions for four benchmark cases,
(pink dashed lines),
(cyan long-dashed lines),
(blue dot-dashed lines), and
(green dot-dashed lines).
The figure shows that the impact of the resolution functions on the net hierarchy dependence is
sharp. While both the energy as well as the angular resolutions result in reducing the hierarchy effect,
the role of the angle resolution can be seen to be greater. It should be mentioned here that the
benchmark resolution functions used here for illustration, range from being realistic to rather
optimistic. Once we include these resolution functions, the to -0.1, depending
on the values of the widths of the resolution functions. Comparison with the Fig. 2
reveals that the which we are getting with the neutrino spectrum are in general
of the same order or even lower than what we had obtained using the events binned in muon energy and
zenith angle. Therefore, as we will see also from the analysis later, that the analysis of the
neutrino data fails to give a for the wrong hierarchy better than that obtained from the
muon analysis, unless one assumes extremely optimistic resolution functions for the neutrino.
4 Mass Hierarchy Sensitivity with only Muon Events
We begin with the analysis of only the muon event sample of the experiment.
The mass hierarchy sensitivity of ICAL@INO using muon events was studied in detail by the
INO collaboration and reported in [28]. The detector specification used in that
work was the ones obtained from detailed simulations of the ICAL detector using Geant-based
detector simulation codes [35]. These are however the first set of simulation results
coming from dedicated studies of the ICAL detector performance.
The study of the ICAL detector response to muons is still on-going. Therefore,
it is expected that these results
will be further refined and improved upon. Hence it is pertinent at this point to study
how much the mass hierarchy sensitivity of ICAL@INO or any other similar
detector could be improve with the improvement in the detector response to muons.
The muon reconstruction efficiency,
charge identification efficiency, energy and angle resolutions were seen to be
a function of both the muon energy as well as zenith angle [35].
A snap-shot of the detector response to muons was shown Fig. 1 of [28] and
Fig. 1 of [34]. One can see from these plots that the reconstruction
efficiency of the muons is roughly in the ballpark of 80-90% over most of the
energy and zenith angle range of the muons, while the charge identification range
is mostly around 99%. The zenith angle resolution of the muons is seen to be
around 0.01 in from these plots, while the the energy resolution is seen to be
around 10%-15%. While the zenith angle resolution of the detector
found from the first set of simulations is seen to be extremely good, the
energy resolution could be improved upon.
Since it appears that the energy resolution of the muons might have room for improvement
in the future, in what follows we will study the improvement expected in the mass hierarchy
sensitivity of magnetized detector such as ICAL@INO,
as we improve the muon energy resolution. To clearly show the
impact of better muon energy resolution on the mass hierarchy, we assume all other
detector performance parameters fixed at a plausible value. In particular, we take
muon charge identification
efficiency % and muon zenith angle resolution in of
.
These values more-or-less agree with the values obtained by the INO collaboration
from detailed simulations, however we take them to be flat over all muon energy and zenith
angle bins. The muon reconstruction efficiency could change depending on the cuts
imposed on the data to improve the muon energy resolution. Hence, we also work with different
muon reconstruction efficiency.
The muon reconstruction efficiency and the muon energy resolution
is also taken to be flat over all bins. We also take all detector specifications to be
the same for and events.
To see how well the mass hierarchy can be determined at this experiment we simulate the data for normal mass hierarchy at the values of the oscillation parameters given in Table 1. This data is then fitted with the wrong inverted hierarchy using a binned analysis. The function is defined for the sample as
| (15) |
| (16) |
where is the observed number of events in the bin and is the corresponding theoretically predicted event spectrum given by Eq. (7). The in Eq. (16) is the systematic uncertainty in the bin and is the pull variable corresponding to the uncertainty . We have included five systematic uncertainties in our analysis. They are, an overall flux normalization error of 20%, a cross-section uncertainty of 10%, a 5% uncertainty on the zenith angle dependence of the fluxes, an energy dependent “tilt factor”, and a 5% additional overall uncertainty. A similar expression for the events can be written and the total is the sum of the two samples
| (17) |
This is minimized over the full set of pull variables .
Further details on the method of the analysis can be found in [28, 34].
All results presented in this paper are for kton-yrs of exposure of the experiment.
The difference is used as a measure of the
mass hierarchy sensitivity of the experiment.
A discussion on the number of muon bins is in order. In [28] it was shown that
for the excellent zenith angle resolution of the ICAL@INO detector, it makes sense to use
80 bins of width 0.025, which is somewhat congruent with the
width of the resolution function. In this work, since we have used a zenith
angle resolution for the muons of 0.01 which is in the same ballpark as that obtained in the
INO simulations, we continue to bin the muon zenith angle in 80 bins. Likewise, the
energy bins should also correspond to the width of the energy resolution function.
For the energy resolution obtained by the INO collaboration, 20 energy bins of width 0.5 GeV
was seen to be optimal in [28]. However, in this work we work with varying
muon energy resolution.
In particular, we vary between 2% and 20%.
In order to see the full impact of the improved energy resolution of 2%, we
bin the energy spectrum into 80 bins as well. We realize that binning the atmospheric
neutrino events with kton-year exposure in bins will
reduce the number of events drastically in each bin. However, first, we use the
Poissonian definition for the function which can consistently calculate the
even for very small event rates. Second, we take a purely
phenomenological stance in this paper
that if needed one could suitably increase the exposure of the experiment to
compensate for the increased number of bins. And last but not the least, the
experimental collaboration would perform an unbinned likelihood analysis of the data
and in that case their statistical significance would roughly match with ours.
Therefore, in this section we keep the number of energy bins fixed at 80 between
1 GeV and 11 GeV. However, in the next section when we combine the
corresponding to the hadron
data with that of the muon data, then we present results for both 80 bins as well as
20 bins between 1 GeV and 11 GeV.
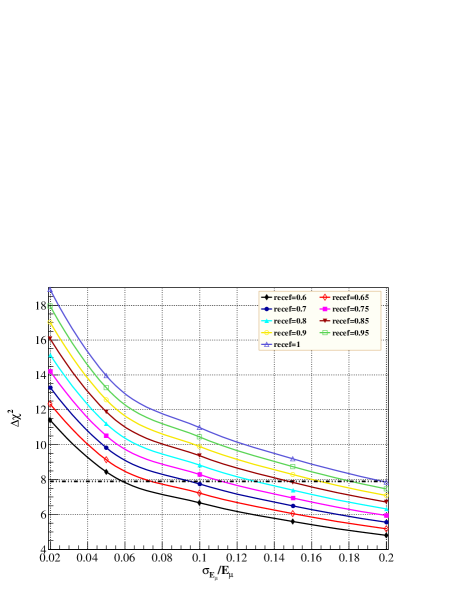
The dependence of the mass hierarchy sensitivity to the muon energy resolution and
muon reconstruction efficiency are shown in Figs. 5.
In the left panel on
Fig. 5 we show the as a function of the muon energy
resolution , for different values of the muon reconstruction
efficiency . We vary continuously between 20% and 2% and
repeat this for to .
For a given , we see that the falls sharply as the
is increased from 2% to about 6%. Thereafter, the rate of fall of
reduces, and it falls steadily as worsens.
As expected, is seen to increase with the reconstruction efficiency
. For comparison, we show by the black dot-dashed lines in the figure, the
obtained in [28] using the full detector simulation results for the muon analysis.
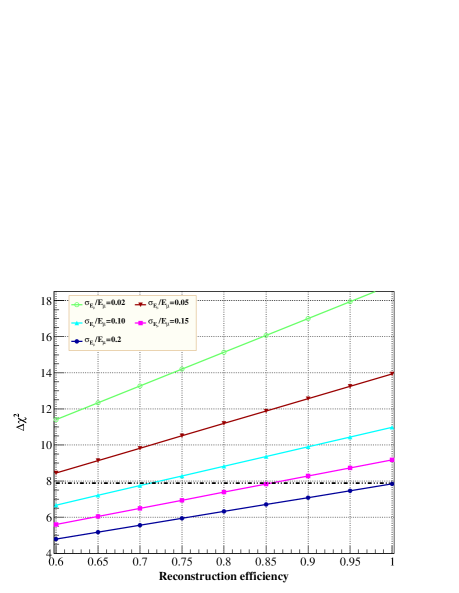
In the right panel of Fig. 5 we show the
as a function of the reconstruction
efficiency , for different values of the muon energy resolution .
The is seen to increase linearly with . This is not surprising as
in the way we have included it in our analysis,
linearly increases the statistics of the experiment. Since the mass hierarchy
signal in an ICAL@INO like experiment for a
kton-yrs exposure is still in the statistics
dominated regime, the grows linear with more data.
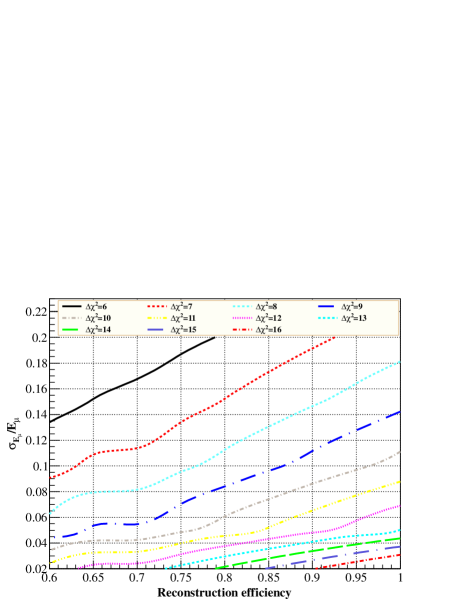
Finally, in the left panel of Fig. 6,
we show contours of constant obtained in the reconstruction efficiency and
energy resolution plane, from the analysis of the
muon events in the detector. We show the contours for
to 16. The figure shows that for energy resolution in the range of 2% to 3%
and reconstruction efficiency above 90%, one would get a signal for the
neutrino mass hierarchy from the analysis of the muon data alone. We reiterate the
the reconstruction efficiency can be compensated by adjusting the exposure of the
experiment. On the other hand, a measurement of the mass hierarchy
from the muon analysis alone seems to be extremely plausible for reasonable
range of values for the muon energy resolution and reconstruction efficiency.
5 Mass Hierarchy Sensitivity with Muon Plus Hadron Events
We had seen in Fig. 3 that the hadron events also exhibit a difference between the event rates expected for the normal and inverted hierarchy and hence carry mass hierarchy sensitivity to some extent. In this section, we quantify the improvement in the sensitivity expected in the mass hierarchy sensitivity of magnetized iron detectors if the hadron events were also added in the statistical analysis of the data. The total function associated with the is then given by
where and are the total number of and hadron bins, respectively, and are the data in the and the associated hadrons, respectively, while the theoretical predictions are given as
| (19) |
where is given by Eq. (12) and all other quantities are as defined in the previous section. Since the hadrons are tagged with their corresponding muon from the respective charged current interaction, we can distinguish between the hadrons associated with the from the ones associated with the . The sign as superscript in in Eq. (5) signifies that the hadrons implied there are ones associated with the events. Therefore, the combined using all data is given by
| (20) |
The hadron data is binned in the way described earlier in connection with the Fig. 3. We first present the results of the statistical analysis where the hadrons are binned in energy only (cf. Eq. (12). We then introduce the zenith angle resolution function of the hadron as well and further bins the data into hadron angles.
5.1 Hadron Data Binned in Energy Only
| Muon | ||||||
| Rec Eff | ||||||
| 20 | 0.12 | 70% | 7.0 | 9.0 | 9.5 | 9.7 |
| 20 | 0.12 | 80% | 8.0 | 10.3 | 10.8 | 11.0 |
| 20 | 0.12 | 90% | 9.0 | 11.6 | 12.1 | 12.4 |
| 20 | 0.02 | 70% | 10.2 | 12.2 | 12.6 | 12.8 |
| 20 | 0.02 | 80% | 11.6 | 13.9 | 14.4 | 14.6 |
| 20 | 0.02 | 90% | 13.0 | 15.6 | 16.2 | 16.4 |
| 80 | 0.02 | 70% | 13.3 | 15.3 | 15.7 | 15.9 |
| 80 | 0.02 | 80% | 15.1 | 17.5 | 18.0 | 18.2 |
| 80 | 0.02 | 90% | 17.0 | 19.6 | 20.2 | 20.4 |
We present in Table 2 the improvement in we obtain by including the hadron energy binned data into our analysis, where we bin the hadron data in 10 equal hadron energy bins between GeV and 10.5 GeV (1 GeV bins). The combined is shown in Table 2 for different cases of muon energy resolutions and reconstruction efficiencies, as well for different hadron energy resolutions. We show the sensitivity for three benchmark values of the muon reconstruction efficiency of 70%, 80% and 90%. The current ICAL@INO reconstruction efficiency corresponds to roughly 80-90%. The muon energy resolution is varied between 12%, the value obtained in the current simulations being performed by the INO collaboration [35], and 2%, which is the projected ambitious goal for this detector parameter. For 12% energy resolution we work with 20 muon energy bins between muon energy of 1 GeV and 11 GeV, which corresponds well with this value of the energy resolution. However, for the 2% energy resolution case we show the results for two choices of energy bins – 20 muon energy bins and 80 muon energy bins between muon energies of 1 GeV and 11 GeV. The choice of is commensurate with the very good energy resolution of 2% and should be the logical one to be used. However, we also show the results for the more conservative choice of . For the hadron energy resolution we repeat our analysis for three benchmark choices :-
-
1.
. This is roughly the kind of hadron energy resolution that has been obtained by the INO collaboration through the Geant-based simulation of their detector response to hadrons [37].
-
2.
. This is the the hadron energy resolution obtained by testing an 8 ton prototype magnetized iron calorimetric detector equipped with 23 m2 of glass Resistive Plate Chambers (RPC) with the T7-PS beam at CERN by the the MONOLITH collaboration [46].
-
3.
. This is the hadron energy resolution reported by the MINOS collaboration.
The results for these three different are presented in the last three columns of
Table 2. A comparison of the obtained from
using only the muon data in the analysis (given in the fourth
column of Table 2) with the obtained by
adding the corresponding hadron data to the muon data
(given in the last three columns of Table 2)
shows the increase in the mass hierarchy sensitivity of the experiment
due to the contribution of the hadron data. For instance, we can see that with
80% muon reconstruction efficiency and 12% energy resolution,
one gets . On adding the hadron data this
increases to , depending on the
hadron energy resolution of the detector. Therefore, we get a contribution of about
2-3 to the from just the hadron events in the detector. Since the hadron
events are tagged with the muon events, an increase in the muon reconstruction efficiency
brings about a corresponding increase in the statistics of the hadron events and hence
an increase in the contribution of the hadron events to the mass hierarchy sensitivity.
For 90% reconstruction efficiency, we see that hadron data gives a contribution
of about 2.5-3.5 to the .
For 80% muon reconstruction efficiency, if we improve the
muon energy resolution to 2%, the corresponding
increases to 11.6 for bins and further to 15.1 for .
On addition of the hadron events to the muon sample, the corresponding sensitivity reach
numbers stand as 13.9-14.6 and 17.5-18.2, respectively. An increase of muon reconstruction
efficiency to 90% will give and
in the most
optimistic cases of the muon resolutions of 2% with 80 muon energy bins.
On the other hand, if we compare the increase in the as we
change the hadron energy resolution , we find that the
change is marginal. Indeed the Table 2 shows that in going from
to
the changes by less than .
5.2 Hadron Data Binned in Energy and Zenith Angle
| 20 | 0.12 | 8.0 | 11.3 | 12.1 | 12.5 | |
|---|---|---|---|---|---|---|
| 20 | 0.12 | 8.0 | 11.6 | 12.5 | 12.9 | |
| 20 | 0.02 | 11.6 | 14.9 | 15.7 | 15.4 | |
| 20 | 0.02 | 11.6 | 15.2 | 16.1 | 16.6 | |
| 80 | 0.02 | 15.1 | 18.8 | 19.3 | 18.9 | |
| 80 | 0.02 | 15.1 | 18.5 | 19.7 | 20.12 | |
The magnetized iron calorimeter is capable of measuring the angle of the hadron shower. In order to use the full energy and angle information on the hadrons in the analysis, we bin the data in both hadron energy as well as zenith angle. For every muon zenith angle bin, we bin the hadrons into 5 energy bins between and 10.5 GeV of bin width 2 GeV and 5 zenith angle bins of bin width . We smear the zenith angle binned data by the Gaussian smearing function in addition to the smearing functions for the muon zenith angle resolution and hadron energy resolution shown in Eq. (12). The simulation results for the angular resolution of the hadron shower in ICAL are yet to be made public by the INO collaboration. Therefore, in what follows we will use the following two cases for the zenith angle resolution for the hadron shower:
-
1.
, taken from the MINOS proposal.
-
2.
, taken from the analysis of the MONOLITH prototype data in the T7-PS beam at CERN [47].
The results obtained by including the full energy as well as angle binned hadron
data along with the muon data in the statistical analysis, are shown in Table 3.
We find that the binning in hadron zenith angle brings in a further mild increase in the total
. The increase in the due to the introduction of the
hadron events into the analysis is seen to be improving it by .
With a 80% reconstruction efficiency and muon energy resolution of
2% one could get a total (16) if one choose to work with
80 (20) muon energy bins.
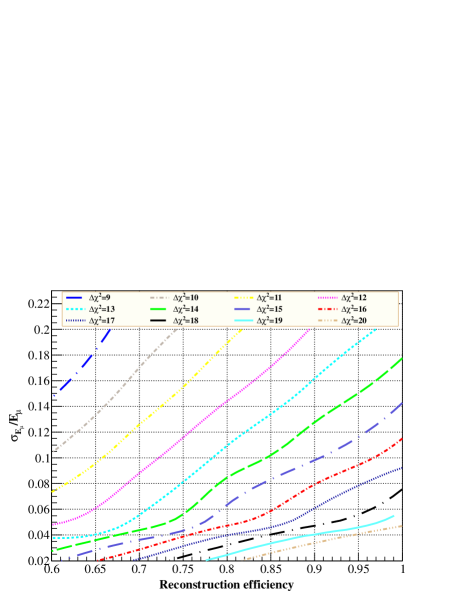
The constant contours for the full data set in the
reconstruction efficiency and
muon energy resolution plane is shown in the right panel of Fig. 6.
Here we have included the energy and zenith angle binned hadron data into the
analysis with [46] and
[47]. The contours are
shown
to 20.
We can see that getting a signal for the mass hierarchy becomes
very easy for most values of the reconstruction efficiency and muon energy resolution
once the hadron data is added. For muon energy resolution in the range of
2% to 10% and reconstruction efficiency greater than 65%, we should get
sensitivity to the mass hierarchy.
If the muon energy resolution is in the range of 2% to 4%
and reconstruction efficiency above 80%, one would get a signal for the
neutrino mass hierarchy from the analysis of the combined data.
6 Mass Hierarchy Sensitivity with Neutrino Events
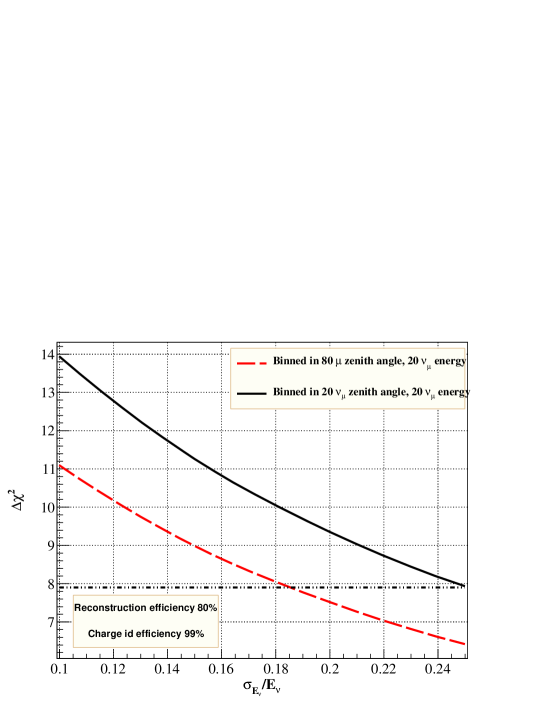
As discussed before, the measured energy and angle of the muon, as well as the
energy and angle of the hadron, can be combined to reconstruct the
energy and zenith angle of the neutrino. The width of the corresponding energy and
angle resolution was seen to be crucial when we presented the neutrino event
spectrum in section 3.3. Here we show the statistical significance
with which the wrong hierarchy can be ruled out by the neutrino analysis. The
is defined similar to what we had for the muon analysis (cf.
Eq. (15)), with just the
muon bins replaced by the neutrino bins. We show the
results of our analysis in Fig. 7. The black solid line shows the
obtained for the wrong hierarchy when we bin the data in
20 neutrino energy bins between 1 GeV and 11 GeV, and 20 zenith angle bins
between and . We have taken the
neutrino reconstruction efficiency of 80% and
charge identification efficiency of 99% in this figure.
The neutrino energy resolution is
taken as flat over all bins and is varied in the x-axis. The neutrino zenith angle
resolution adopted in this figure has been taken from Fig. 4.7 of the MONOLITH
proposal [36]. While the average of neutrino zenith angle
resolution is around , in the energy range of interest, the zenith angle
resolution is seen to be around .
The neutrino energy resolution in this proposal is
quoted as being around 20%. We can see from the figure that at 20% energy
resolution from this analysis. 222For a flat 10%
neutrino energy
resolution and zenith angle resolution function, we obtain
from the neutrino analysis.
This is comparable to the sensitivity obtained
with just the muon data with 80% efficiency and energy resolution of 12%.
If the hadron data is added to the muon data, then even with these modest
detector response for the muons, we would get (cf. Table 3).
If the muon energy resolution was improved to 2%, then we would have a more than
sensitivity to the mass hierarchy from the muon-plus-hadron analysis. Whereas, from the
Fig. 4 we can see that the sensitivity from the neutrino analysis can
never match these numbers, even for extremely optimistic energy resolution of 10%.
The reason can be traced to the event rates plots shown in Figs. 2, 3 and
4. The effect of the detector resolutions on the neutrino spectrum make it
comparable, and sometimes even worse than the muon spectrum. If we add the hadron
spectral data to the muon spectral analysis, we get an additional contribution to the
hierarchy sensitivity which cannot be matched by the neutrino analysis.
For comparison, in Fig. 7
we also show the obtained
when we bin the data in neutrino energy and muon zenith angle bins.
We keep the reconstruction efficiency at 80% and charge identification efficiency at 99%.
The muon zenith angle resolution function is taken with width 0.01. We see that the
obtained in this case is even worse than what we had obtained with the
neutrino zenith angle analysis using the MONOLITH zenith angle resolution function.
7 Conclusions
Measurement of the neutrino mass hierarchy is the next important thing to do in neutrino physics.
The atmospheric neutrino experiments could play a crucial role in this respect, by observing the
hierarchy dependent earth matter effects. In this paper we consider the magnetized iron calorimeter
as the atmospheric neutrino detector, such as the ICAL@INO. This class of detectors are sensitive
to mainly muons, but have good energy and angle resolution and very good charge
identification capabilities. In this paper we optimized the mass hierarchy sensitivity of the experiment
with respect to the detector response functions and showed how using the hadron data as an
independent input along with the muon data is most likely to give the best sensitivity to the
neutrino mass hierarchy. This way of treating the data from atmospheric neutrinos, to
the best of our knowledge, is being proposed for the first time in this paper.
We began with first discussing the earth matter effects
in the muon neutrino survival probabilities which leads
to the neutrino mass hierarchy sensitivity in this kind of
experiment. We next showed how this sensitivity gets watered down
when we consider the event rates in the detector
(i) due to the inclusion of the appearance
channel, (ii) due to the averaging effect of the charged current interaction which
produces muons with any energy and angle allowed by the process, and
(iii) with inclusion of detector resolutions.
We showed how the mass hierarchy effect in the muon event sample,
hadron event sample as well
as the neutrino event sample decreases as we include these factors one by one.
In the case of the muon and hadron spectrum, the major smearing of the
earth matter effects come from the cross-section effect. The
energy resolution brings about a further reduction in the signal,
however the effect is mild.
We showed that despite this reduction in the earth matter effects,
both the muons as well as the hadrons
event spectra have mass hierarchy
sensitivity, which survives even after including all the resolution functions.
The neutrino analysis is affected only due to the appearance channel
and the detector resolutions. However, the neutrino events turned out
to be very sensitive to the detector
energy and zenith angle resolution. It was shown that the hierarchy effects
reduce sharply as we switch on the neutrino energy and angle resolutions,
such that the net earth matter effect present in the neutrino spectrum
becomes comparable to that in the muon spectrum.
We performed a analysis to quantify the reach of the experiment to measuring the neutrino mass hierarchy. We showed results for three different analysis.
-
•
We started with the analysis of only the muon events using a treatment similar to that in [28] but with flat efficiencies and resolution functions. Since the zenith angle resolution given by the INO collaboration is already very good, we fixed the zenith angle resolution for the muons at in and showed how the mass hierarchy sensitivity could be improved by improving the muon energy resolution and muon reconstruction efficiency. If the muon energy resolution could be improved to 2%, we could get a more than measurement of the mass hierarchy from the kton-year of muon data alone.
-
•
We next included the hadron events as an additional input in the analysis along with the muon data. Since the detector is not expected to measure the hadron energy and angle as well as it can do for the muon and since we wanted to keep track of the particles coming from a given neutrino energy and angle, we tagged the hadron with their corresponding muon from the charged current interaction. Since the muon zenith angle is the best measured quantity we collect all hadrons in a given muon zenith angle bin. These hadrons are then binned in their energy and zenith angle. We defined a function for the combined analysis of the hadron and muon events with the so-binned muon and hadron data. The results showed that the hadron events bring in a noticeable improvement in the final sensitivity of the experiment to the neutrino mass hierarchy by increasing the by up to 5. The combined muon and hadron analysis is projected to give a sensitivity from a kton-year exposure, if one could achieve 2% energy resolution and 80% reconstruction efficiency in the muons.
-
•
Finally we showed the mass hierarchy sensitivity expected from the analysis of the data in terms of the neutrino energy and angle. For the zenith angle resolution obtained by the MONOLITH collaboration, we showed the expected from the neutrino analysis as a function of the neutrino energy resolution. For the 20% energy resolution quoted by the MONOLITH collaboration, one would get a little over signal for the neutrino mass hierarchy, which is lower than what we got from the combined muon and hadron analysis. We argued that this happens because the neutrino channel is very sensitive to the detector resolution functions. Once the detector resolution functions are imposed, the net earth matter effects in the neutrino channel becomes equal to, or sometimes even less than, the residual earth matter effects in the muon spectrum. When we add the hadron spectrum to the muon data, the total overshoots that expected from the neutrino analysis.
In conclusion, the neutrino mass hierarchy can be measured rather well from the observation of atmospheric neutrinos in magnetized iron calorimeters. The sensitivity can be significantly increased by improving the muon energy resolution of the detector. The addition of the hadron data into the analysis will improve the results even further, and return sensitivity reach which is better than what can be achieved from the neutrino analysis at these detectors. For , , a muon energy resolution of 2%, reconstruction efficiency of 80% and exposure of kton-year, we could get up to signal for the mass hierarchy from combining the muon and hadron data. The signal will go up when the atmospheric data is combined with data from other existing experiments, particularly NOA.
Acknowledgements
We thank Tarak Thakore and Moon Moon Devi for discussions and the INO collaboration for their continued support. S.C. acknowledges partial support from the European Union FP7 ITN INVISIBLES (Marie Curie Actions, PITN-GA-2011-289442).
References
- [1] F. P. An et al. [DAYA-BAY Collaboration], Phys. Rev. Lett. 108, 171803 (2012) [arXiv:1203.1669 [hep-ex]].
- [2] J. K. Ahn et al. [RENO Collaboration], Phys. Rev. Lett. 108, 191802 (2012) [arXiv:1204.0626 [hep-ex]].
- [3] Y. Abe et al. [DOUBLE-CHOOZ Collaboration], Phys. Rev. Lett. 108, 131801 (2012) [arXiv:1112.6353 [hep-ex]].
- [4] K. Abe et al. [T2K Collaboration], Phys. Rev. Lett. 107, 041801 (2011) [arXiv:1106.2822 [hep-ex]].
- [5] P. Adamson et al. [MINOS Collaboration], Phys. Rev. Lett. 107, 181802 (2011) [arXiv:1108.0015 [hep-ex]].
- [6] H. Minakata, arXiv:1209.1690 [hep-ph].
- [7] E. Fernandez-Martinez, talk at “What is ?, INVISIBLES 12 and Alexei Smirnov Fest”, GGI, Firenze, June, 2012.
- [8] J. Bernabeu, S. Palomares-Ruiz, A. Perez and S. T. Petcov, Phys. Lett. B 531, 90 (2002) [hep-ph/0110071].
- [9] M. C. Gonzalez-Garcia and M. Maltoni, Eur. Phys. J. C 26, 417 (2003) [hep-ph/0202218].
- [10] J. Bernabeu, S. Palomares Ruiz and S. T. Petcov, Nucl. Phys. B 669, 255 (2003) [hep-ph/0305152].
- [11] O. L. G. Peres and A. Y. .Smirnov, Nucl. Phys. B 680, 479 (2004) [hep-ph/0309312].
- [12] S. Palomares-Ruiz and S. T. Petcov, Nucl. Phys. B 712, 392 (2005) [hep-ph/0406096].
- [13] D. Indumathi and M. V. N. Murthy, Phys. Rev. D 71, 013001 (2005) [hep-ph/0407336].
- [14] R. Gandhi, P. Ghoshal, S. Goswami, P. Mehta and S. U. Sankar, Phys. Rev. D 73, 053001 (2006) [hep-ph/0411252].
- [15] S. Choubey and P. Roy, Phys. Rev. D 73, 013006 (2006) [hep-ph/0509197].
- [16] S. T. Petcov and T. Schwetz, Nucl. Phys. B 740, 1 (2006) [hep-ph/0511277].
- [17] D. Indumathi, M. V. N. Murthy, G. Rajasekaran and N. Sinha, Phys. Rev. D 74, 053004 (2006) [hep-ph/0603264].
- [18] S. Choubey, Nucl. Phys. Proc. Suppl. 221, 46 (2011) [hep-ph/0609182].
- [19] E. K. Akhmedov, M. Maltoni and A. Y. .Smirnov, JHEP 0705, 077 (2007) [hep-ph/0612285].
- [20] R. Gandhi, P. Ghoshal, S. Goswami, P. Mehta, S. U. Sankar and S. Shalgar, Phys. Rev. D 76, 073012 (2007) [arXiv:0707.1723 [hep-ph]].
- [21] E. K. .Akhmedov, M. Maltoni and A. Y. .Smirnov, JHEP 0806, 072 (2008) [arXiv:0804.1466 [hep-ph]].
- [22] R. Gandhi, P. Ghoshal, S. Goswami and S. U. Sankar, Phys. Rev. D 78, 073001 (2008) [arXiv:0807.2759 [hep-ph]].
- [23] A. Samanta, Phys. Rev. D 81, 037302 (2010) [arXiv:0907.3540 [hep-ph]].
- [24] A. Samanta and A. Y. .Smirnov, JHEP 1107, 048 (2011) [arXiv:1012.0360 [hep-ph]].
- [25] M. C. Gonzalez-Garcia, M. Maltoni and J. Salvado, JHEP 1105, 075 (2011) [arXiv:1103.4365 [hep-ph]].
- [26] V. Barger, R. Gandhi, P. Ghoshal, S. Goswami, D. Marfatia, S. Prakash, S. K. Raut and S U. Sankar, Phys. Rev. Lett. 109, 091801 (2012) [arXiv:1203.6012 [hep-ph]].
- [27] M. Blennow and T. Schwetz, JHEP 1208, 058 (2012) [arXiv:1203.3388 [hep-ph]].
- [28] A. Ghosh, T. Thakore and S. Choubey, JHEP 1304, 009 (2013) [arXiv:1212.1305 [hep-ph]].
- [29] For details of the India-based Neutrino Observatory, visit www.ino.tifr.res.in/
- [30] K. Abe, T. Abe, H. Aihara, Y. Fukuda, Y. Hayato, K. Huang, A. K. Ichikawa and M. Ikeda et al., arXiv:1109.3262 [hep-ex].
- [31] D. Angus et al. [LAGUNA Collaboration], arXiv:1001.0077 [physics.ins-det].
- [32] A. Bueno, Z. Dai, Y. Ge, M. Laffranchi, A. J. Melgarejo, A. Meregaglia, S. Navas and A. Rubbia, JHEP 0704, 041 (2007) [hep-ph/0701101].
- [33] D. J. Koskinen, Mod. Phys. Lett. A 26, 2899 (2011).
- [34] T. Thakore, A. Ghosh, S. Choubey and A. Dighe, JHEP 1305, 058 (2013) [arXiv:1303.2534 [hep-ph]].
- [35] “Simulations study of the sensitivity of the ICAL detector to muons”, INO Collaboration, under preparation.
- [36] MONOLITH Proposal, LNGS P26/2000, CERN/SPSC 2000-031, August 15, 2000.
- [37] M. M. Devi, A. Ghosh, D. Kaur, L. S. Mohan, S. Choubey, A. Dighe, D. Indumathi and S. Kumar et al., arXiv:1304.5115 [physics.ins-det].
-
[38]
A. M. Dziewonski and D. L. Anderson,
Phys. Earth Planet. Interiors 25, 297 (1981);
S. V. Panasyuk, Reference Earth Model (REM) webpage,
http://cfauves5.harvrd.edu/lana/rem/index.html. - [39] R. Gandhi, P. Ghoshal, S. Goswami and S U. Sankar, Mod. Phys. Lett. A 25 (2010) 2255 [arXiv:0905.2382 [hep-ph]].
- [40] H. Nunokawa, S. J. Parke and R. Zukanovich Funchal, Phys. Rev. D 72, 013009 (2005) [hep-ph/0503283].
- [41] Q. Y. Liu and A. Y. .Smirnov, Nucl. Phys. B 524, 505 (1998) [hep-ph/9712493]; Q. Y. Liu, S. P. Mikheyev and A. Y. .Smirnov, Phys. Lett. B 440, 319 (1998) [hep-ph/9803415]; E. K. Akhmedov, Nucl. Phys. B 538, 25 (1999) [hep-ph/9805272] E. K. Akhmedov, A. Dighe, P. Lipari and A. Y. Smirnov, Nucl. Phys. B 542, 3 (1999) [hep-ph/9808270].
- [42] M. Maris and S. T. Petcov, Phys. Rev. D 56, 7444 (1997) [hep-ph/9705392]; Q. Y. Liu, M. Maris and S. T. Petcov, Phys. Rev. D 56, 5991 (1997) [hep-ph/9702361]; S. T. Petcov, Phys. Lett. B 434, 321 (1998) [hep-ph/9805262]; M. Chizhov, M. Maris and S. T. Petcov, hep-ph/9810501.
- [43] L. Wolfenstein, Phys. Rev. D 17, 2369 (1978); S. P. Mikheev and A. Y. Smirnov, Sov. J. Nucl. Phys. 42, 913 (1985) [Yad. Fiz. 42, 1441 (1985)]; S. P. Mikheev and A. Y. Smirnov, Nuovo Cim. C 9, 17 (1986); V. D. Barger, K. Whisnant, S. Pakvasa and R. J. N. Phillips, Phys. Rev. D 22, 2718 (1980).
- [44] D. Casper, webpage: nuint.ps.uci.edu/nuance/default.htm
- [45] M. Honda, T. Kajita, K. Kasahara and S. Midorikawa, Phys. Rev. D 70, 043008 (2004) [astro-ph/0404457].
- [46] M. Ambrosio, G. Bari, G. Bencivenni, A. Candela, A. Chiarini, F. Chignoli, M. De Deo and M. D’Incecco et al., Nucl. Instrum. Meth. A 456, 67 (2000).
- [47] G. Bari, A. Candela, M. De Deo, M. D’Incecco, M. Garbini, P. Giusti, C. Gustavino and M. Lindozzi et al., Nucl. Instrum. Meth. A 508, 170 (2003).