Measurement of the Luminosity in the ZEUS Experiment at HERA II
Abstract
The luminosity in the ZEUS detector was measured using photons from electron bremsstrahlung. In 2001 the HERA collider was upgraded for operation at higher luminosity. At the same time the luminosity-measuring system of the ZEUS experiment was modified to tackle the expected higher photon rate and synchrotron radiation. The existing lead-scintillator calorimeter was equipped with radiation hard scintillator tiles and shielded against synchrotron radiation. In addition, a magnetic spectrometer was installed to measure the luminosity independently using photons converted in the beam-pipe exit window. The redundancy provided a reliable and robust luminosity determination with a systematic uncertainty of 1.7%. The experimental setup, the techniques used for luminosity determination and the estimate of the systematic uncertainty are reported.
keywords:
luminosity measurement, ZEUS experiment1 Introduction
At the HERA storage rings electrons111In this paper, “electron” is meant to specify both electron or positron. and protons have been accelerated to energies of 27.5 GeV and 920 GeV, respectively, and brought to collisions inside two experiments, ZEUS and H1. Data taken with these experiments provided us with precise measurements of quark and gluon distributions in the proton and allowed precision tests of Quantum Chromodynamics as the theory of the strong force at small distances. The luminosity is a key parameter of the storage ring determining its physics potential in terms of event statistics in the processes of interest characterised by a certain cross section. The precise measurement of the luminosity in the experiments is of crucial importance, since the luminosity uncertainty translates directly to the uncertainty of the cross section and hence to the measurement of quark and gluon distributions.
The luminosity is measured in electron-proton scattering using the rate of high energy photons from the bremsstrahlung process, . This is a pure QED process, which has a high rate and a precisely calculable cross section. In the first phase of HERA a photon calorimeter [1] was used to measure the rate of bremsstrahlung photons. This calorimeter was positioned in the HERA tunnel about 100 m downstream of the ZEUS experiment, where the electron and proton beams were separated. Bremsstrahlung photons moved through a straight vacuum chamber and an aluminum exit window before entering the photon calorimeter.
After the completion of an upgrade program the HERA accelerator restarted operations in 2001. The luminosity was steadily increased reaching a factor of 5 times the one of the first HERA phase. The major changes were stronger beam focusing and slightly larger beam currents. The physics program was extended to processes with lower cross section e.g., to explore the heavy flavour content of the proton or to probe weak interactions using in addition electron beam polarisation.
However, the earlier beam separation and stronger focusing of the beam led to more synchrotron radiation and a larger rate of bremsstrahlung events, the latter resulting in a pile-up of more than one photon per bunch crossing in the photon calorimeter. To reduce the impact of synchrotron radiation on the photon calorimeter, the thickness of the carbon absorber blocks installed in front of the photon calorimeter was increased from 2 to 4 radiation lengths. A second luminometer, the spectrometer [2], was installed outside the synchrotron radiation cone, to measure the luminosity using a different detector technique. Bremsstrahlung photons were measured after they converted to electron pairs in the exit window of the photon beam pipe. The converted electron pair was spatially split by the magnetic field of a dipole, and both particles were individually measured by two electromagnetic calorimeters. The calorimeters were placed vertically at sufficiently large distance from the photon beam not to be affected by the direct synchrotron radiation and unconverted bremsstrahlung photons. The large flux of low energy electrons from synchrotron photon interactions in material upstream of the dipole magnet was swept away from the calorimeters. The data rate in the spectrometer was, in comparison to photon calorimeter, considerably reduced due to the conversion probability of about 9% in the beam-pipe exit window and a higher threshold on the photon energy. The fraction of bunch crossings with more than one photon creating depositions in the spectrometer approached only a few percent at the highest instantaneous luminosity.
Utilising two independent luminosity measurements allowed a permanent comparison, which was important for tracing back in real time detector malfunctions and to reduce systematic uncertainties.
In this paper, we report on the operation of the photon calorimeter and spectrometer in the data taking periods after the upgrade, describe the steps to obtain the luminosity from the raw data, and evaluate systematic uncertainties of the luminosity measurement. Since the spectrometer was a new device, more detailed studies are reported.
2 Bremsstrahlung and Luminosity Determination
The energy spectrum of bremsstrahlung photons in the process
| (1) |
is given by Bethe and Heitler [3] in Born approximation neglecting the finite size of the proton as:
| (2) |
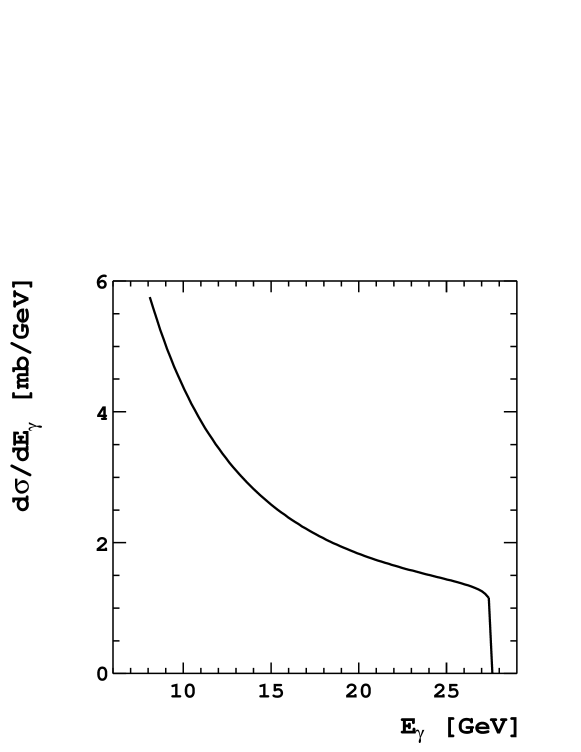
where is the fine structure constant, the classical electron radius, the energy of the radiated photon, and are the proton and electron beam energies, is the scattered electron energy, and and are the proton and electron masses. For illustration the photon energy spectrum is shown in Figure 1 for an electron beam energy of 27.5 GeV. Recently one-loop QED radiative corrections have been calculated for the process (1) [4]. Their impact on the cross section (2) and photon angular distribution is considered in section 7.1.2.
The integrated luminosity is calculated for a certain data taking period as:
| (3) |
where is the number of bremsstrahlung photons selected in a certain energy range over the period, and is the bremsstrahlung cross-section integrated over the same energy range. The acceptance, A, is the probability for a bremsstrahlung photon created in the interaction region to be observed in the luminometer. To estimate the acceptance of the photon calorimeter and the spectrometer detailed Monte Carlo simulations of both devices were done as described in section 5.
3 Photon Calorimeter and Spectrometer
The performances of the photon calorimeter and the spectrometer were studied in test-beams. The results are described in detail in Refs. [1, 2].
Both devices were installed about 100 m downstream from the nominal interaction point, IP, in the direction of the electron beam, as sketched in Figure 2.
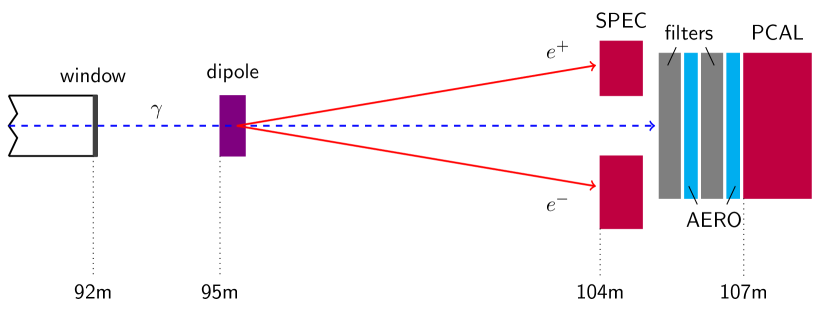
Photons originating from bremsstrahlung at the IP moved through a vacuum chamber of 92 m length terminated by an exit window made of an aluminum alloy of 9.9 mm thickness. Approximately 9 % of the photons converted into electron pairs in this window.
Upstream of the window, inside the vacuum chamber, the aperture was restricted due to beam-line components and magnets, which absorbed photons from the edges of the photon beam. The shape of the unobscured region was obtained from a foil sensitive to synchrotron radiation, which was located in the beam-line near the front face of the calorimeters [2].
3.1 The Photon Calorimeter
Photons not converted in the exit window hit the photon calorimeter, a lead-scintillator sandwich calorimeter of 24 X0 depth positioned 107 m downstream of the interaction region. Two carbon blocks of 2 X0 thickness each were placed in front of the calorimeter to absorb low energy synchrotron radiation photons. The calorimeter was composed of 48 lead absorber plates of 2020 cm2 size and 0.5 X0 thickness interspersed with 2 mm thick scintillator sheets. Two wavelength shifter bars were attached at each side to the scintillator sheets. They were equipped at the rear end by photomultipliers.
Downstream of the 8-th absorber plate, where the shower maximum is expected, two planes of crossed scintillator fingers of 1 cm width and 3 mm thickness were positioned. Each finger was read-out directly by a photomultiplier. The energy resolution of the calorimeter was measured in an electron beam as 14%/ and 90%/ without and with the 4 X0 carbon absorber blocks in front, respectively.
3.2 The Luminosity Spectrometer
The electron pairs created in the exit window follow the original photon direction, until they encountered a 60 cm long dipole magnet with a field strength of 0.5 T where they were deflected from the photon beam direction. A few meters downstream they were registered by two calorimeters placed above (up) and below (down) the y-z plane, with the z axis pointing in the direction of the proton beam, the x axis towards the centre of HERA and the y axis completing a right-handed Cartesian system. The aperture restrictions upstream of the exit window prevent direct photon hits in the calorimeters.
Both calorimeters were composed in the -z direction of 3.5 mm thick tungsten absorber plates interspersed with scintillator layers of 2.6 mm thickness. Each layer was divided into strips of 7.9 mm width. The strips were alternately vertically and horizontally mounted, providing an x and y position measurement of a shower. The scintillator strips of each orientation were connected sequentially in the z direction to one wavelength shifter bar equipped with a photomultiplier, forming a readout channel. Each calorimeter had 16 channels in x direction. In y direction, the down calorimeter had 15 channels and the up calorimeter 11 channels. The latter is due to the limited space between the photon beam and the proton beam pipe. The calorimeters, both with a longitudinal depth of 24 X0, were calibrated in an electron beam with energies between 1 and 6 GeV. The energy resolution and calibration uncertainty were measured as 17%/ and 0.5%, respectively.
3.3 Data Acquisition and Data Storage
The data acquisition system, DAQ [5], common for the photon calorimeter and the spectrometer, was independent from the ZEUS central DAQ. This allowed processing of large data samples, necessary for the luminosity measurement, without affecting the central DAQ performance. Signals from each photomultiplier were digitised by 12–bit flash ADCs and transferred to four memory boards, MB, after each bunch crossing. To correct for pedestals, the ADC values stored from the previous bunch crossing were subtracted.
3.3.1 The Photon Calorimeter Specific Part
The digitised signals from the two photomultipliers were averaged and converted into energy using calibration constants obtained as described in section 4.1. Rates of events were counted on-line with energy thresholds of 10 GeV and 17 GeV for pilot bunches222Pilot electron bunches have no corresponding proton bunches and hence can be used to measure background rates. and colliding bunches. In addition, total rates and rates for colliding bunches were recorded for energy thresholds of 7.5 GeV, 12 GeV and 16.5 GeV, respectively. These rates were used to cross check the corrections applied for pile-up of more than one bremsstrahlung photon per bunch crossing in the luminosity measurement. For each run a special record is written containing pedestals, signals from light test-pulses, on-line event rates, electron and proton currents in HERA and the active time of the ZEUS experiment. The signals from the scintillator fingers were digitised and recorded to monitor the photon shower position.
3.3.2 The Spectrometer Specific Part
From the sum of photomultiplier signals of the up and down calorimeters the energies and were calculated using calibration constants from special runs as described in section 4.2.1. Only events with and above 2 GeV generated a trigger signal for the readout.
The MBs stored incoming data into a buffer to await the trigger signal. If the MB buffer was full, incoming data were discarded until buffer space was available, leading to dead-time of the system. Counters recorded the total number of HERA buckets and the number in which the MB buffer was active, allowing a continuous dead-time correction for the luminosity calculation. To minimise dead-time, a trigger prescale factor 3 was applied. The typical trigger rate at the given prescale settings was around 3 kHz. The photon energy and the photon position were calculated and an event selection as described in section 4.2 was performed. The accepted events were stored every 16.5 seconds in an environmental record. For data quality monitoring, 10000 triggered events were saved per run. To create this sample, every 100-th event was selected, starting at the beginning of the run.
4 Photon Measurements
The photon calorimeter measured the rate of unconverted photons above certain energy thresholds, and the spectrometer the rate of converted photons when the conversion electrons hit the calorimeters and trigger the readout.
4.1 Measurement of the Photon Flux in the Photon Calorimeter
Photons were counted above the energy thresholds given in section 3.3.1. The relation between digitised and averaged photomultiplier signals in ADC counts and the energy of the photon, , is parametrised as
| (4) |
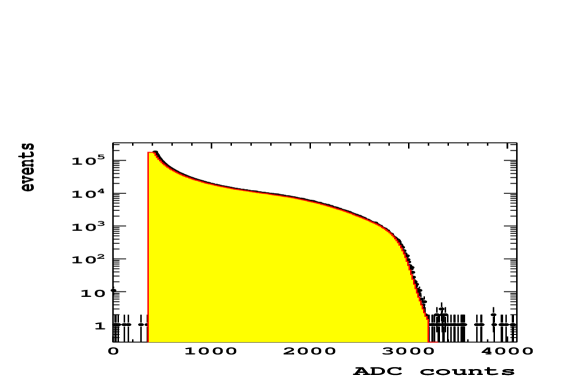
where is the maximum photon energy, equal to the electron beam energy, and a pedestal offset due to synchrotron radiation. The calibration constant and the parameter , accounting for deviations from a linear response, were obtained from a fit of the bremsstrahlung energy spectrum predicted from Monte Carlo to data taken in special runs without proton beam. Then only bremsstrahlung photons from interactions of the electron beam with the residual gas in the vacuum chamber contribute with relatively low rate to the spectrum and pile-up of several photons per bunch crossing is negligible. An example for a fit to the data distribution is shown in Figure 3. Also shown is the Monte Carlo distribution.
During data taking with collisions, the photomultiplier gain was monitored with light pulses. Gain changes were corrected by readjusting the high voltage. In addition, using the rates of photons for different energy thresholds, the calibration constant was estimated to be stable within 1 % within a run.
The parameter was determined to be -0.017 and found to be stable within all data taking periods. The parameter was measured using random triggers as a function of the electron beam current per bunch crossing.
Taking the event rates recorded for each of the energy thresholds and the electron pilot bunches, the rate of bremsstrahlung events, , corrected for interactions of the beam with residual gas, was obtained as
| (5) |
where and were the total photon rate and the rate from the pilot bunches, and and the total and the pilot-bunch electron currents, respectively.
At high photon rates more than one photon from a single bunch crossing may have hit the calorimeter. The average number of photons per bunch crossing, , was estimated to be
| (6) |
where and are the total bremsstrahlung cross section333 was calculated for photons with energies above 0.1 GeV, being the energy threshold of the calorimeter and the bremsstrahlung cross section above an energy threshold , is the HERA orbit frequency and the number of colliding bunches. The bremsstrahlung rate corrected for multiple photons per bunch crossing was then
| (7) |
where the correction term P() was determined from Monte Carlo simulations.
4.2 Measurement of the Photon Flux in the Spectrometer
4.2.1 Position and Energy Measurement of Electrons and Photons in the Spectrometer
At nominal magnetic field, electrons with energies above 3.5 GeV hit the calorimeters. Events with electrons measured in both calorimeters were used to reconstruct the energy and transverse coordinates of the converted photon.
To minimise the impact of noise, only 4 strips near the shower maximum were used for the electron energy measurement. The measurement was corrected for transverse energy leakage, a small effect except at the edges of the calorimeter, and the light attenuation in scintillators. The photon energy was calculated as the sum of electron energies.
The shower position was calculated as the energy-weighted average in x and y. Only channels with an energy above 60 MeV were used. The photon coordinates, and , were obtained from the position and energy measurements of the individual electrons, taking into account electron deflection by the dipole magnet.
The calorimeters were routinely calibrated to take into account gain variations due to radiation damage and recovery mechanisms in the scintillators and wavelength shifter bars. Special runs were taken with an adjustable slit collimator inserted into the photon beam to select a certain y position. Using the bending power of the dipole magnet a direct relation between the electron energy and the y position of the shower in the calorimeter was obtained. Data taken in this configuration were used to determine the individual channel gains iteratively. After each step gains were varied to match the predicted energy and y position. The procedure converged after a small number of steps.
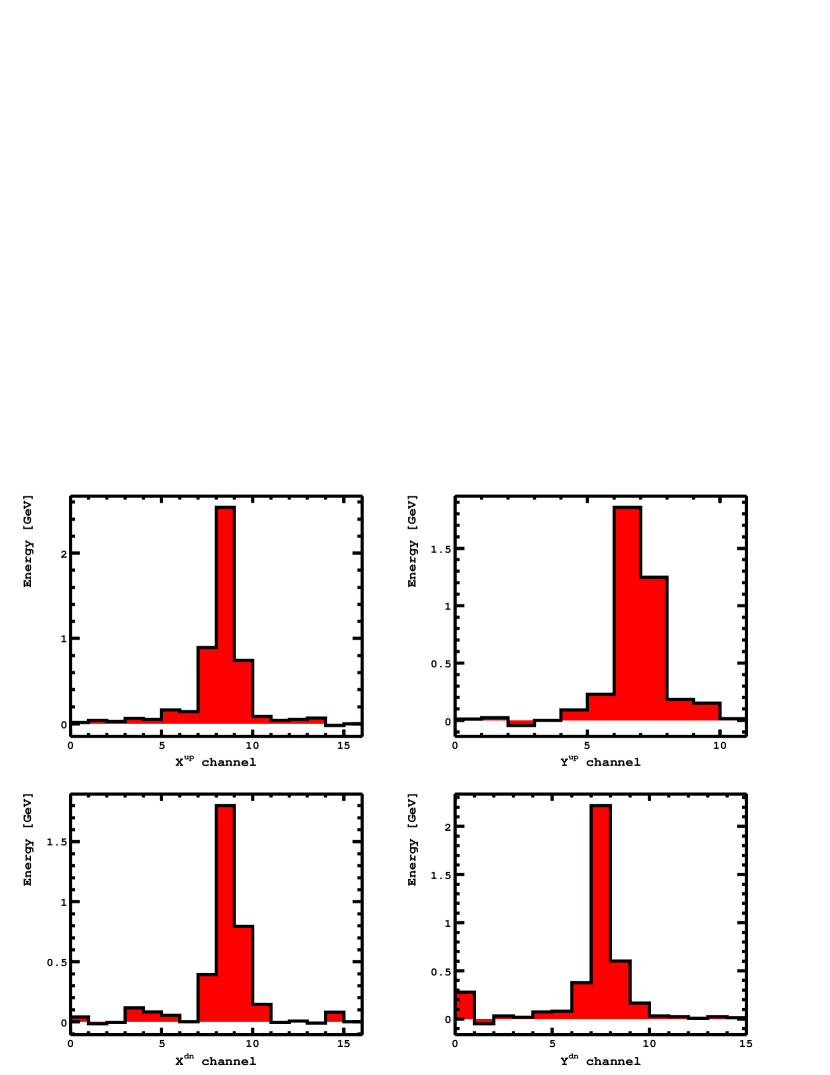
4.2.2 Event selection
The depositions in the spectrometer of a typical triggered event are shown in Figure 4. After the reconstruction of the energy and position of the showers in each calorimeter the following selection criteria were imposed:
-
1.
The reconstructed energy for each calorimeter must be larger than 3.5 GeV to suppress noise.
-
2.
The largest energy depositions must not be at the edge strips in each of the four planes to minimise leakage, thus ensuring good energy and position reconstruction.
-
3.
The y position of a shower in the down detector was restricted to make the fiducial regions of up and down calorimeters equal.
-
4.
The rms width of the shower must be less than 1 cm for each of the four projections (rms-cut) to reject hadron showers from proton interactions with the residual gas.
The last requirement was applied only in the data taking periods 2005 and 2006 with electron beam. It caused severe event loss due to depositions from synchrotron radiation at the inner edges of the y-plane. This loss of events was corrected for using the 10000 event sample recorded at the beginning of each run [6]. In data taking periods with positron beams in 2006 and 2007 the last requirement was omitted, since the fraction of hadron showers in the spectrometer was estimated to be negligible using runs with only protons in the collider.
About half of the triggered events passed the requirements. The reconstructed photon coordinates, and and the photon energy were stored into histograms for each environmental record. The mean photon beam position and width were calculated at the exit window. From the moments of the and distributions and the correlation coefficient Y the photon beam ellipse and its tilt were determined. The number of photons was counted and corrected for interactions of the beam with the residual gas using Eqn.(5). The raw data of the environmental record were then discarded.
5 Monte Carlo Simulations to Determine the Acceptances
The acceptances of the photon calorimeter and spectrometer were determined by Monte Carlo simulations using the GEANT 3.21 package. Photons were generated according to the bremsstrahlung spectrum as given in Eqn.(2) taking into account the electron beam angular divergence. They were then randomly distributed in a sufficiently large area of the (x,y) plane at the z-position of the exit window. Using beam profiles measured by the spectrometer as described in section 4.2.2 and the aperture limits of the vacuum chamber, a weight was applied to each photon. Only photons generated inside the measured aperture were tracked to the luminometers.
5.1 Photon Calorimeter Simulation
Photons with an energy larger than = 0.1 GeV not converted in the beam exit window or air were transported to the photon calorimeter and a shower was simulated. The energy deposited in the scintillators and scintillator fingers was recorded for shower energy and position reconstruction. The light collection and the impact of the readout electronics was parametrised using test-beam data.
A detector response function was calculated as a function of the photon energy ,
| (8) |
with being the probability that for an incident photon with an energy the energy was measured in the calorimeter and the bremsstrahlung cross section integrated from to the upper kinematic limit. Using the detector response function the cross section, , for photons with a measured energy above a threshold, , is obtained,
| (9) |
The acceptance is the number of events above a given energy threshold, , divided by the generated number of events, ,
| (10) |
5.2 Spectrometer Simulation
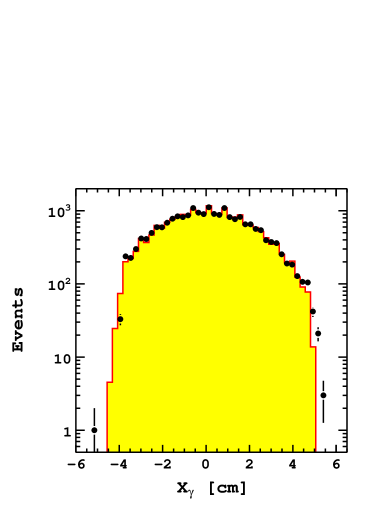
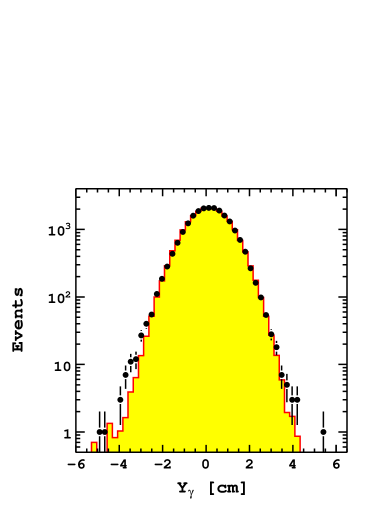
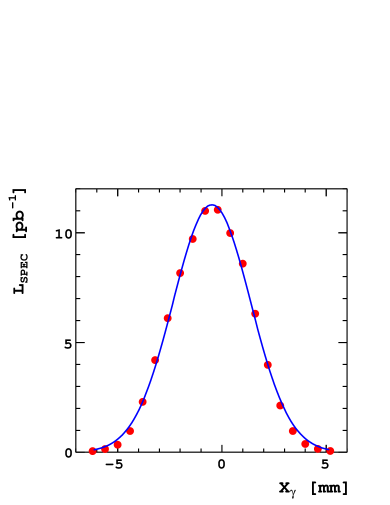
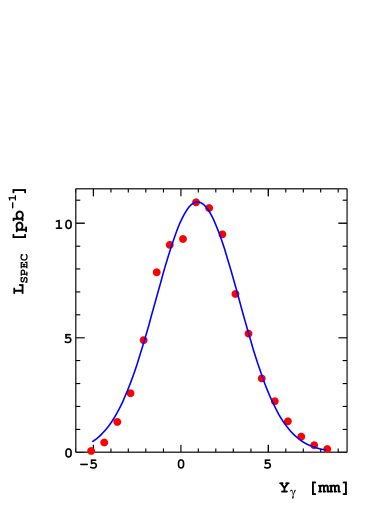
The generated photons were converted in the exit window. The electrons were transported to the calorimeters using a parametrised field map of the dipole and taking into account interactions in the exit window and in air. Showers were simulated in the calorimeters and the energy depositions in the scintillator tiles were transformed into signals of the photomultipliers. The simulated events were subject to the reconstruction and selection as described in section 4.2 and accepted events were used to to calculate and , and the energy of the photon, . This sample was then used to calculate the acceptance for every environmental record. Assuming a Gaussian shaped photon beam and taking into account the correlations between and determined from data, the events were re-weighted to fit to the measured and distribution. An example of the result is shown in Figure 5. The acceptance was then calculated as the ratio of the sum of accepted and generated Monte Carlo event weights. A typical value of the average acceptance is 0.65% for GeV with a maximum of 2% at 22 GeV.
6 Luminosity Measurement
6.1 Calorimeter Procedure
The counter rates with the energy thresholds defined in section 3.3.1 were corrected for interaction of the electron beam with residual gas in the vacuum and pile-up using Eqn. (5) and Eqn. (7) and summed up to as defined in Eqn. (3). For each energy threshold a value for the luminosity was obtained. Finally a correction for the ZEUS active time was applied.
6.2 Spectrometer Procedure
 |
 |
The number of photons was counted in each environmental record applying the criteria given in section 4.2.2. The integrated luminosity was calculated using Eqn. (3) and corrected for dead times of the ZEUS and the spectrometer DAQ systems. The impact of pile-up due to conversion of more than one photon per bunch crossing was estimated as described in the Appendix. The number of photons obtained after applying the selection criteria is slightly larger than the true number. A correction, as shown in Figure 6 as a function of a quantity , is applied, where is the fraction of colliding bunches with a bremsstrahlung event passing the selection criteria. The correction, reaching 0.4 % at = 0.0015, corresponding to the maximal instantaneous luminosity measured at HERA,
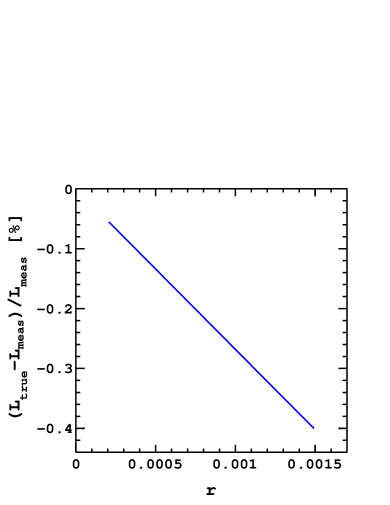
was applied to the measured luminosity of each environmental record.
7 Systematic Effects in the Luminosity Measurement
7.1 Systematics Common to the Photon Calorimeter and the Spectrometer
7.1.1 Acceptance
The estimation of the uncertainty in the acceptance holds for both the photon calorimeter and the spectrometer. The shape of the aperture area and its alignment relative to the detectors were each measured to an accuracy of 1 mm. A variation of these quantities by 1 mm shifted the values of the acceptance within 1%.
The variation of the acceptance as a function of the photon beam position was studied using neutral current events selected in the ZEUS detector. For the 2004/06 electron beam and the 2006/07 positron beam independent analyses were done using samples of neutral current events with Q2 185 GeV2. This process has a high rate and is not expected to have any common systematics with the luminosity measurement. Details of the event selection criteria can be found in Ref.[7].
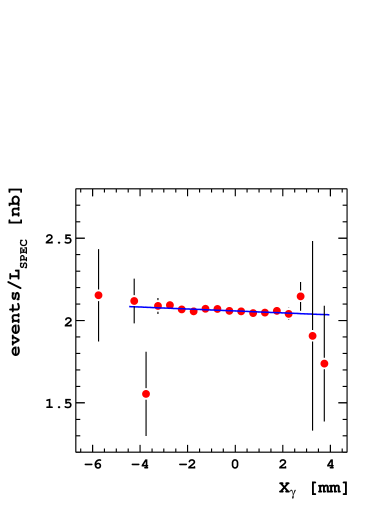
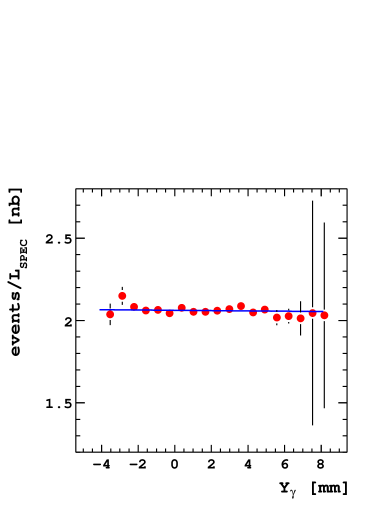
The ratio between the rate of neutral current events and the luminosity measured with the spectrometer is shown in Figure 7 (left) as a function of the x position of the photon beam, , and in Figure 8 (left) as a function of the y position of the photon beam, for data taken with a positron beam.
 |
 |
 |
 |
The ratio as a function of exhibits a slope of whereas no dependence on is observed.
Also shown in the right figures is the distribution of photons used in the luminosity measurement as a function of and , normalised to the integrated luminosity. A fit with a Gaussian to the distribution shown in Figure 7 (right) results in a mean value of -0.5 mm and a width of 1.9 mm. The systematic uncertainty of the luminosity is estimated as the variation within the width as 1.1%.
The same study using data taken with the electron beam results in a systematic uncertainty of 1.2%.
The impact of the event rate on the luminosity measurement was investigated using the ratio between neutral current events and the luminosity measured by the spectrometer as a function of the product of the electron and proton currents. These currents are measured with other devices, and their product is proportional to the luminosity. Using the same technique as described above a systematic uncertainty of 0.6% was estimated for data taken with positron beam. No impact was observed for data taken with electron beam.
These results obtained using the spectrometer were considered to be valid also for the photon calorimeter.
7.1.2 Theory Uncertainty
The formula given in Eqn.(2) for the bremsstrahlung cross section as a function of the photon energy is obtained in the Born approximation neglecting the finite size of the proton. Recently the process has been calculated including one-loop QED radiative corrections and proton form-factors [4]. The inclusion of the one-loop QED corrections causes a small reduction in the photon energy spectrum at the high energy limit of the acceptance. The angular spread of the photon momenta obtained from this calculation is by an order of magnitude smaller than the divergence of the electron beam in ZEUS. The impact of both effects on the luminosity measurement is negligible.
7.1.3 Summary of Common Systematic Uncertainties
A summary of the systematic uncertainties common to the Photon Calorimeter and the Spectrometer is given in Table 1.
| Source of systematics | 2005/2006 | 2006/2007 |
|---|---|---|
| aperture and | 1 | 1 |
| detector alignment | ||
| x-position of the | 1.2 | 1.1 |
| photon beam | ||
| beam currents | - | 0.6 |
| sum | 1.6 | 1.6 |
7.2 Photon Calorimeter
The systematic uncertainties originating from the calibration of the photon calorimeter and multiple photon hits were considered.
7.2.1 Pedestal Shifts and Calibration Constants
In the calibration of the photon calorimeter an offset due to synchrotron radiation in the photomultiplier signal was taken into account. The synchrotron radiation was measured with random triggers of bunch crossings and parametrised as a function of the electron beam current. Values for pedestal shifts of 0.20 MeV/ and 0.08 MeV/ were obtained for electron and positron beams, respectively. The impact of a remaining pedestal uncertainty of 85 MeV and the uncertainty on the calibration constant was translated in an uncertainty of the luminosity measurement. The combination of both effects lead to a systematic uncertainty of 1.5%.
7.2.2 Multiple Photon Hits
The luminosities obtained for several energy thresholds were corrected for pile-up using Eqn.(7). The differences of the values obtained for several energy thresholds were distributed as a function of the average number of photons per bunch crossing. From their variation a systematic uncertainty of 0.5% was estimated.
7.3 Spectrometer
As additional sources of systematic uncertainties specific for the spectrometer the proton beam interactions with residual gas in the beam-pipe, potentially creating depositions in the calorimeters, and the conversion probability in the beam exit window were considered.
7.3.1 Impact of Proton Beam Interactions with Residual Gas in the Beam-pipe
Data was collected when only protons were circulating in HERA to estimate the contribution of background from interactions of the proton beam with residual gas in the beam-pipe. The event selection criteria, described in section 4.2.2, were applied. The event rate without applying the rms-cut was 0.1 Hz. The typical event rate for bremsstrahlung events was 10-15 kHz at the beginning of a fill. Hence the fraction of events from proton–residual gas interactions in the data is about .
The effect on the luminosity measurement due to pile-up of a proton shower in the up calorimeter and an electron shower in the down calorimeter was estimated from the data to be less than at standard vacuum conditions.
7.3.2 Photon Conversion Coefficient in the Beam Exit Window
The beam exit window, where about 9% of the photons were expected to convert, consists of an aluminum alloy. After the shutdown of HERA the window has been dismounted and its thickness and composition measured. For the thickness 9.9 0.01 mm was obtained. The chemical composition of the beam exit window was determined by two laboratories using mass spectroscopy. The measurements are summarised in Table 2.
| Element | Z | cm-1 | fraction, % (lab1) | fraction, % (lab2) |
|---|---|---|---|---|
| Mg | 12 | 0.0528 | 0.318 | 0.344 |
| Al | 13 | 0.0858 | 81.790 | 86.200 |
| Si | 14 | 0.0815 | 14.765 | 10.300 |
| Fe | 26 | 0.4385 | 0.227 | 0.260 |
| Cu | 29 | 0.5342 | 2.433 | 2.400 |
| Zn | 30 | 0.4397 | 0.338 | 0.365 |
| average | 0.0984 | 0.0986 |
Although there are differences of up to several per cent in the chemical compositions measured in two laboratories, the average photon conversion coefficients at 20 GeV are equal within 2.3 per mille. In the following the measurements of lab2 are used.
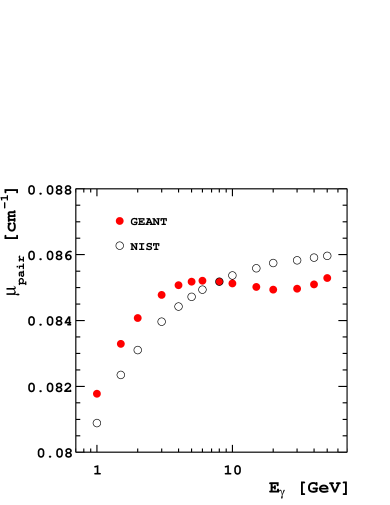
The photon conversion coefficient is a function of the energy. In Figure 9 its parametrisation used in GEANT444GEANT3 and GEANT4 use the same cross section parametrisation. is compared with the values from the NIST [8] data base for aluminum being the largest element fraction in the exit window. In the relevant energy range around 20 GeV the difference in the conversion coefficient approaches 1%.
For the acceptance calculation the values from the NIST database are used. The uncertainty of the luminosity resulting from the photon conversion coefficient in the beam exit window is estimated to be 0.7%. The dominant contribution originates from the uncertainty of the cross section measured at 1.5 GeV [9] used in the NIST database and its extrapolation to 20 GeV. The uncertainty of the thickness contributes with 0.1% and the uncertainty of the chemical composition with 0.3%.
7.4 Summary of the Systematic Uncertainties
The systematic uncertainties estimated for the photon calorimeter were the same for electron and positron beams. The uncertainty not common with the uncertainties of the spectrometer results to 1.6%.
The systematic uncertainties obtained for the spectrometer are estimated for electron and positron beams separately. The uncertainty not common with the photon calorimeter amounts to 0.9%. A summary is given in Table 3.
| Source of systematics | photon | spectrometer | spectrometer |
|---|---|---|---|
| calorimeter | 2005/2006 | 2006/2007 | |
| common systematics | 1.6 | 1.6 | 1.6 |
| photon conversion | 0.7 | 0.7 | |
| in the beam exit window | |||
| rms-cut correction | 0.5 | - | |
| beam currents | - | 0.6 | |
| pedestal shifts | 1.5 | ||
| pile-up | 0.5 | ||
| sum | 2.2 | 1.8 | 1.8 |
Averaging the systematic uncertainties not common between photon calorimeter and spectrometer and adding it in quadrature to the common systematic uncertainty leads to a total systematic uncertainty of the luminosity measurement of 1.7%.
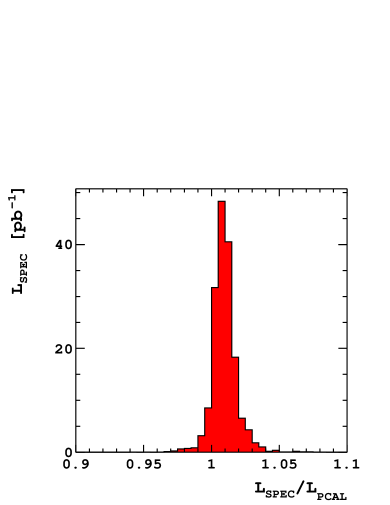
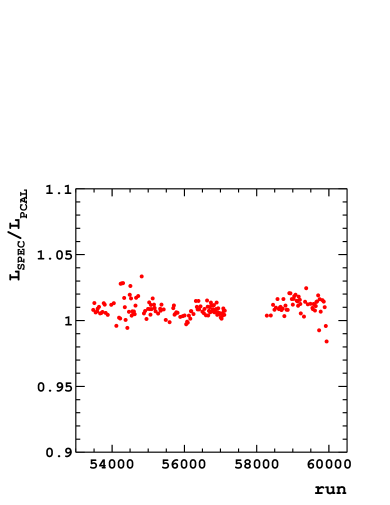
8 Comparison of the Luminosities Measured with the Calorimeter and Spectrometer
The distribution of the ratio between
the luminosity values obtained for each run from the spectrometer and the
photon calorimeter is shown in Figure 10 (left)
for data taken with electron beam
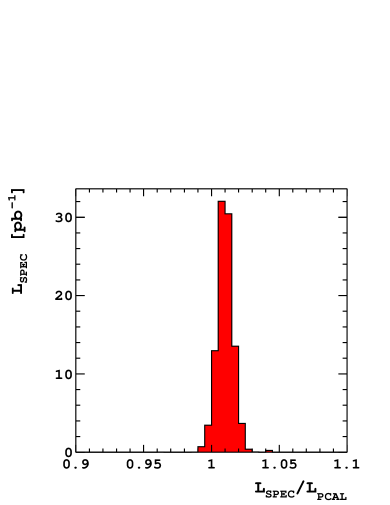
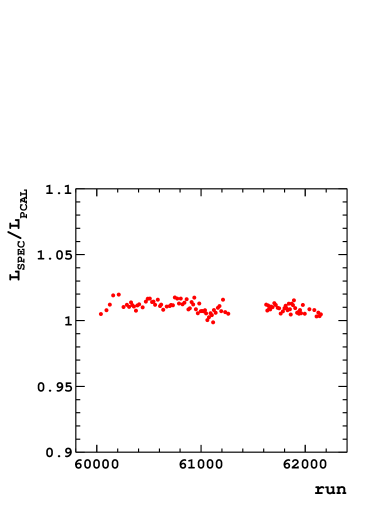
and in Figure 11 (left) for data taken with positron beam.
Very good
agreement between the two measurements is found.
The distributions
of the ratios have nearly Gaussian shape with a mean value
of 1.01 both for the electron
and positron data.
The distributions of the ratio versus run number is nearly flat over the periods as shown in Figure 10 and Figure 11 (right), indicating a very good stability of the measurements. Most of the points lie within 1 % of the central values, with a slightly larger spread for runs around 54000 in which corrections are applied for event losses due to the rms-cut used in the event selection for the spectrometer.
 |
 |
 |
 |
During data taking the spectrometer had a larger fraction of runs with malfunctions in the hardware. However, the systematic uncertainties of the spectrometer are smaller than the ones of the photon calorimeter. Therefore, the luminosity values of each run are taken from the photon calorimeter and multiplied with the ratio as shown in Figures 10 and 11 to obtain the luminosity values used in the physics analyses.
9 Summary
The luminosity in the ZEUS experiment was measured by counting photons from electron bremsstrahlung, . The cross sections of this process is calculated in next-to-leading order in QED. Two independent devices, the photon calorimeter and the spectrometer, were used to measure the photon rate. The results of both agree within one per cent. The systematic uncertainty of the luminosity measurement is estimated to be 1.7%.
References
- [1] J. Andruszkow et al., ”Luminosity measurement in the ZEUS Experiment”, Acta Phys. Polon. B32 (2001) 2025-2058.
- [2] M. Helbich et al., ”The Spectrometer system for measuring ZEUS luminosity at HERA”, Nucl. Instrum. Meth. A565 (2006) 572; B. Surrow, ”Measurement of the Proton Structure Function F2 at low Q2 and very low x with the ZEUS Beam Pipe Calorimeter at HERA”, Ph. D. Thesis, Univ. of Hamburg (1998); T. Monteiro, “Study of Exclusive Electroproduction of Mesons at low q2 using the ZEUS Beam Pipe Calorimeter at HERA”, Ph. D. Thesis, Univ. of Hamburg (1998).
- [3] H. Bethe and W. Heitler, “On the stopping of fast particles and on the creation of positive electrons”, Proc. Roy. Soc. London A 146 (1934) 83.
- [4] T. Haas and V. Makarenko, “Precision calculation of processes used for luminosity measurement at the ZEUS experiment”, arXiv:1009.2451 [hep-ph], Eur. Phys. J. C 71 (2011) 1574.
- [5] T. Bold, “Common Data Acquisition System for the ZEUS Luminosity Monitor”, Lambert Academic Publishing, (2010).
- [6] V. Drugakov, Ph. D. Thesis, NCPHEP Minsk, 2013.
- [7] The ZEUS Coll., S. Chekanov et al., Eur. Phys. J. C 62 (2009) 625.
- [8] M.J. Berger et al. ,”XCOM: Photon Cross Sections Database”, http://www.nist.gov/pml/data/xcom/index.cfm.
- [9] T. M. Knasel and J. K. Walker, Phys. Lett. B 27 (1968) 103.
Appendix
To correct for the impact of pile-up the following model was used. The mean number of electron pairs per bunch crossing, , with an energy larger than 8 GeV reached up to 0.02 at the beginning of a fill. Neglecting the probability of more than 2 electron pairs per bunch crossing, the fraction of colliding bunches with an event in the spectrometer passing all selection cuts, , is
| (11) |
where and are the probability of the creation and acceptance of an electron pair when no electron pair was in the previous bunch crossing and and the same quantities when there was an electron pair in the previous bunch crossing. accounts for losses due to previous bunch subtraction, which may lead to event rejection by the reduction of the deposited energy. and are the probability and acceptance of events with two electron pairs which are counted as one event. accounts for fake coincidences made by and from different photons
The number of electron pairs per bunch crossing is described by a Poisson distribution with the mean . Evaluating probabilities to order and solving Eqn.(11) for we have
| (12) |
where f is the fraction of colliding bunches with a preceding colliding bunch. It accounts for the fact that the colliding bunches come in trains alternating with pilot and empty bunches.
The luminosity is
| (13) |
where is the number of colliding bunches and is the energy threshold.
The measured luminosity is
| (14) |
The relative luminosity shift is then
| (15) |
The quantities are determined using Monte Carlo simulations of the photon beam with parameters obtained from data. Values of f are calculated for the bunch sequence of each run.