1\Yearpublication2006\Yearsubmission2005\Month11\Volume999\Issue88
later
Metal jumps across sloshing cold fronts: the case of A496
Abstract
Cold-fronts in cool-core clusters are thought to be induced by minor mergers and to develop through a sloshing mechanism. While temperature and surface-brightness jumps have been detected and measured in many systems, a detailed characterization of the metal abundance across the discontinuity is only available for a handful of objects. Within the sloshing scenario, we expect the central cool and metal rich gas to be displaced outwards into lower abundance regions, thus generating a metal discontinuity across the front. We analyzed a long (120 ksec) XMM-Newton observation of A496 to study the metal distribution and its correlation with the cold-fronts. We find Fe discontinuities across the two main cold-fronts located 60 kpc NNW and 160 kpc South of the peak and a metal excess in the South direction.
keywords:
X-rays: galaxies: clusters – galaxies: clusters: individual (A496)1 Introduction
After that Chandra discovered cold fronts (Markevitch et al. 2000), these features have been detected in a large number of galaxy clusters and have been found to be a common phenomenon in the cluster population. Indeed, the majority of clusters host at least one cold front (Markevitch, Vikhlinin & Forman 2003; Ghizzardi, Rossetti and Molendi 2010, hereafter G10).
Cold fronts origin and evolution have been widely studied in the last years by several authors, both using X-ray observations and numerical simulations and a global picture for these phenomena has been provided (see Markevitch & Vikhlinin 2007 for a review). However, relatively little attention has been paid to the metallicity properties of cold fronts (see e.g. Simionescu et al. 2010; de Plaa et al. 2010), especially in the sloshing scenario of cool core clusters. These clusters have prominent metallicity peaks in their centers (e.g. De Grandi & Molendi 2002) and hence the mixing of the gas induced by the sloshing could be important.
Sloshing cold fronts are thought to be triggered in cool core clusters by minor mergers: an infalling substructure induces perturbations to the underlying gravitational potential of the main cluster and consequently the cold inner gas is displaced from the center of the potential well, it is decoupled from the dark matter through ram pressure and starts to slosh. High resolution hydrodynamical simulations have been developed to detail the history of the gas during the sloshing (see e.g. Ascasibar & Markevitch 2006; Roediger & ZuHone 2012; ZuHone et al. 2010, 2011). The effect of sloshing on metal distribution in relaxed clusters have been recently addressed in simulations tailored to reproduce the Virgo and A496 clusters (Roediger et al. 2011, 2012). In these simulations, the sloshing of the central enriched gas creates metal abundances jumps across the cold fronts and redistributes the heavy elements throughout the ICM.
On the observational side, a detailed characterization of the metal abundance across the fronts is only available for a handful of objects (Perseus: Fabian et al. 2011; Centaurus: Sanders & Fabian 2006; A2204: Sanders, Fabian & Taylor 2005, 2009). This is a significant limitation as the sloshing mechanism may play a crucial role in carrying metals from the core to the outskirts and a precise characterization of the metal distribution in a sloshing ICM can provide information on the enrichment and metal mixing processes at work.
In this paper we report our results on the metal distribution in the galaxy cluster A496 obtained using a long (120 ksec) XMM-Newton observation. A496 is a good candidate to inspect the correlation between metal distribution and cold fronts as it’s a bright, nearby, cool core cluster hosting at least four cold fronts.
2 Results
2.1 Surface brightness discontinuities in A496
XMM-Newton data for A496 have been processed in a standard way: all the details concerning the data reduction and the analysis procedures are provided in Ghizzardi et al. (in preparation).
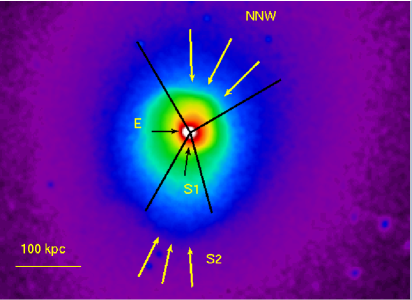
To look for cold fronts in A496, we built the EPIC flux map in the 0.2-4 keV energy band, following the method described in G10. The resulting flux map is shown in Fig. 1. A visual inspection of the map clearly reveals several sharp discontinuities. The main discontinuity is located at NNW (30o-120o measured from the W direction) at a distance 60 kpc ( 100′′) from the X–ray peak. The morphology of the front appears boxy.
A surface brightness discontinuity is then observed at 35 kpc ( 55′′) in the South direction (labeled S1 in Fig. 1). Both these discontinuities had also been detected by Dupke & White (2003) using Chandra data. The high spatial resolution of Chandra allowed Dupke & White (2003) to detect another innermost cold front (16 kpc; labeled E in Fig. 1) East of the center. This cold front is too close to the center to be resolved by the XMM-Newton instruments.
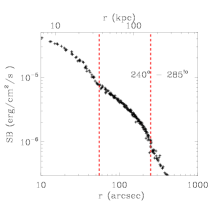
In the South direction (240o-285o), another outer discontinuity is detected at 160 kpc ( 240′′), marked S2 in Fig. 1 (see also Tanaka et al. 2006). This front could not be detected in Chandra maps as it lies almost at the edge of the ACIS-S3 chip.
2.2 Thermodynamical maps and A496 cold fronts.
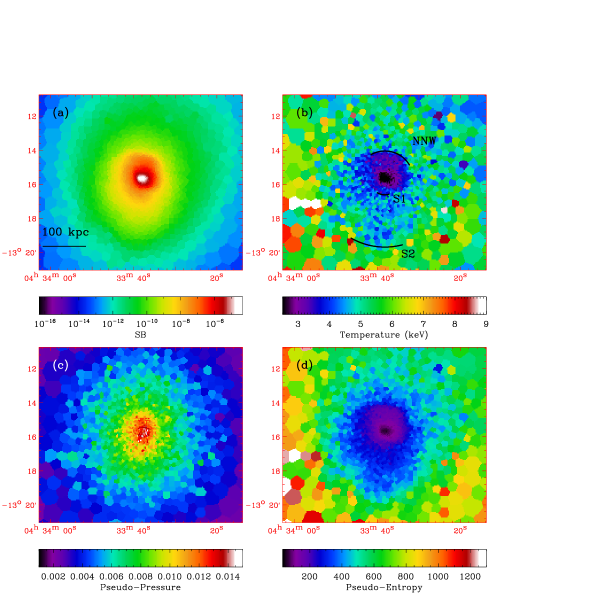
To assess the nature of the discontinuities we checked the temperature behavior across the fronts. To this aim, following the Rossetti et al. (2007) method, we built the thermodynamical maps (surface brightness, temperature, pseudo-pressure and pseudo-entropy) for A496 which are shown in Fig. 2.
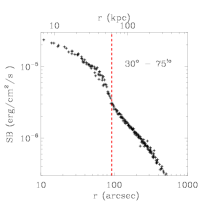
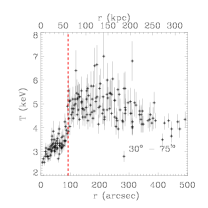
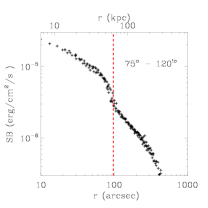
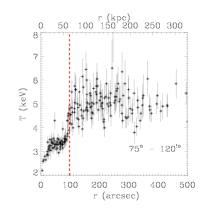
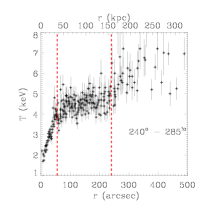
The temperature map (panel (b) in Fig. 2) is typical of a cool core cluster: the outer temperature is about 5 keV in the external regions and it decreases when moving towards the center down to keV. The map shows that temperature rises are associated to the surface brightness discontinuities as expected for cold fronts. To quantify these discontinuities, we extract the surface brightness and temperature profiles in the sectors hosting the cold fronts. We split the 30o-120o sector hosting the NNW main discontinuity into two sub-sectors (30o-75o and 75o-120o) because of the boxy morphology of this feature. The profiles are plotted in Fig. 3: the vertical red lines mark the cold fronts positions in each sector. Notably, the 240o-285o sector hosts two discontinuities. The plots confirm that the temperature increases across all the discontinuities detected and that all these discontinuities (four, when including also the E cold front detected by Dupke & White 2003) are definitively cold fronts.
The temperature map shows that the central cool gas develops in a spiral-shaped pattern extending from the center anti-clockwise towards north (where the main NNW cold front is located); then the spiral turns towards East and finally expands in the South direction. The cold fronts correspond to the edge of the spiral and the southern outermost (S2) cold front is located at the tail of the spiral.
The entropy (panel (d) in Fig. 2) follows the temperature behaviour and, as expected in a sloshing scenario (G10) it decreases rapidly in the central core. The pressure (panel (c) in Fig. 2) is nearly symmetric, suggesting that the cluster is fairly relaxed and that no remarkable perturbations to the underlying gravitational potential have been induced by any major merger event, as expected in a sloshing scenario, where the mechanism is triggered by minor mergers.
2.3 Metal distribution
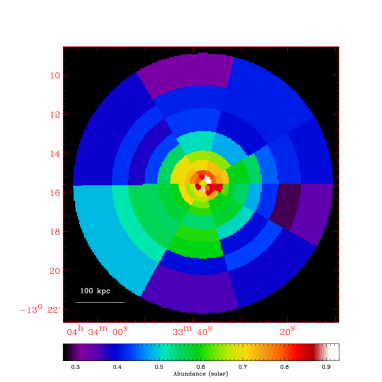
In order to study the distribution of metals in A496, we divide the cluster into rings and sectors. Both are selected to match the cold fronts positions. For each selected region, we extracted the spectra for the three EPIC detectors and fitted them simultaneously with a single temperature apec plasma model using the xspec software. The metallicity map obtained from this spectral analysis is shown in Fig. 5 and we plot the temperature and abundance profiles for the sectors of interest in Fig. 4. We focus on the main (NNW) cold front and on the outermost southern S2 cold front. Here, the metallicity exhibits the typical behavior of a cool core cluster, with a central abundance peak (0.9 solar) and a decreasing trend towards the outskirts where it reaches the value of 0.3-0.4 solar. In the central bin a significantly lower value is measured. This is due to the iron-bias and the feature disappears when using a two temperature model for the central bin (see Ghizzardi at al., in preparation).
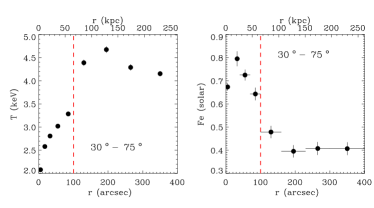
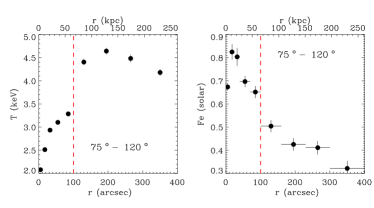
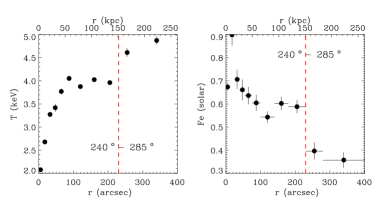
The metal abundance drops abruptly across the S2 cold front (240o-285o), similarly to what observed in other cool core clusters (Perseus: Fabian et al. 2011; Centaurus: Sanders & Fabian 2006; A2204: Sanders, Fabian & Taylor 2005, 2009). A significant decrease of the metal abundance, consistent with a discontinuity, is also observed across the NNW cold fronts (30o-75o and 75o-120o) where we detect the most significant variation of metallicity: the profile gradient across the cold front is higher than in any other region of the profile.
In the sector 240o-285o, the metallicity of the area inside the outermost cold front (radius in the range 60-150 kpc) keeps constant on a plateau at 0.6 solar, before dropping at the cold front position. This can be better seen in the metallicity map (Fig. 5). The map shows that the external metallicity is almost constant at a value of 0.3-0.4 solar in all the directions except for the sector 180o-285o where an excess of metals (0.6 solar) can be clearly observed. This sector corresponds to the region of the spiral tail.
3 Discussion and summary
We analyzed a long XMM-Newton observation of A496. Taking advantage of the XMM-Newton large collecting area and spectral resolution the quality of the data is good enough to study in detail the metal abundance for this cluster and the correlation of the metal distribution with cold front positions. A496 is particularly suitable to investigate this issue: our analysis (in agreement with previous results) shows that this cool core cluster hosts at least 4 cold fronts. The temperature map exhibits a spiral-like pattern of cool gas which wraps around the center anti-clockwise. The presence of multiple cold fronts and of the spiral feature are the typical signatures of sloshing of the central cool gas. The spiral morphology is characteristic of a sloshing scenario as the central cool gas may acquire angular momentum during an off-axis minor merger (Ascasibar & Markevitch 2006).
We performed a spectral analysis to build metal abundance profiles and we find that the metallicity has a discontinuity across all the cold fronts. According to this, a general picture can be drawn for the metal behavior during the sloshing evolution: when the sloshing starts the innermost cold, dense and metal rich gas is displaced from the center into a hotter and less abundant region of the cluster. This displacement creates the cold front feature characterized by the density and temperature discontinuities, and also the observed metal jump across the front. As the colder gas sloshes towards the potential well center, it carries the metals keeping its high metallicity, hence the metal jump across the front is preserved.
We also find a metal excess in the region hosting the tail of the spiral-like structure. This suggests that the cool central gas drags the heavy elements while swirling around the center of the potential well and that the sloshing is able to move metal from the center in the outer part of the cluster as the spiral expands towards the outermost regions of the cluster.
References
- [1] Ascasibar Y., Markevitch M.: 2006, ApJ 650, 102
- [2] De Grandi S., Molendi S.: 2002, A&A 551, 153
- [3] De Plaa J., Werner N., Simionescu A. et al.: 2010, A&A 523, A81
- [4] Dupke R., White, R. E., III: 2003, ApJ 583, L13
- [5] Fabian, A. C. et al., 2011: MNRAS 418, 2154
- [6] Ghizzardi, S., Rossetti, M. , Molendi, S.: 2010, A&A 516, A32
- [7] Markevitch, M., Vikhlinin, A.: 2007, Phys. Rep. 443, 1
- [8] Markevitch et al.: 2000, ApJ 541, 542
- [9] Markevitch, M., Vikhlinin, A., Forman, W. R.: 2003, in Astronomical Society of the Pacific Conference Series, Vol. 301, Astronomical Society of the Pacific Conference Series, ed. S. Bowyer, C.-Y. Hwang, 37
- [10] Roediger, E., ZuHone, J. A.: 2012, MNRAS 419, 1338
- [11] Roediger, E., Brggen, M., Simionescu, A., et al.: 2011, MNRAS 413, 2057
- [12] Roediger, E., Lovisari, L., Dupke, R., et al.: 2012, MNRAS 420, 3632
- [13] Rossetti, M., Ghizzardi, S., Molendi, S., Finoguenov, A.: 2007, A&A 463, 839
- [14] Sanders J. S., Fabian A. C.: 2006, MNRAS 371, 1483
- [15] Sanders, J. S., Fabian, A. C., Taylor, G. B.: 2005, MNRAS 356, 1022
- [16] Sanders J. S., Fabian A. C., Taylor G. B.: 2009, MNRAS 393, 71
- [17] Simionescu A., Werner N., Forman W. R. et al.: 2010, MNRAS 405, 91
- [18] Tanaka T., Kunieda H., HudaverdiM., Furuzawa A., Tawara Y.: 2006, PASJ 58, 703
- [19] ZuHone, J. A., Markevitch, M., Johnson, R. E.: 2010, ApJ 717, 908
- [20] ZuHone, J. A., Markevitch, M., Lee, D.: 2011, ApJ 743, 16