Characterization of the Red Giant HR 2582 Using
the CHARA Array
Abstract
We present the fundamental parameters of HR 2582, a high-mass red giant star whose evolutionary state is a mystery. We used the CHARA Array interferometer to directly measure the star’s limb-darkened angular diameter (1.0060.020 mas) and combined our measurement with parallax and photometry from the literature to calculate its physical radius (35.765.31 ), luminosity (517.817.5 ), bolometric flux (14.80.5 10-8 erg s-1 cm-2) and effective temperature (457760 K). We then determined the star’s mass (5.61.7 ) using our new values with stellar oscillation results from Baudin et al. Finally, using the Yonsei-Yale evolutionary models, we estimated HR 2582’s age to be 165 Myr. While our measurements do not provide the precision required to definitively state where the star is in its evolution, it remains an excellent test case for evaluating stellar interior models.
1 Introduction
The red giant star HR 2582 (HD 50890, HIP 33243) was part of a study by Hekker et al. (2009), who used the CoRoT satellite (Auvergne et al., 2009) to observe G and K giant stars with solar-like oscillations. The distribution of these pulsating stars’ seismic parameters indicted they belonged to the “red clump” of low-mass, post-flash core-He-burning, evolved stars (Miglio et al., 2009). When the effective temperature and luminosity of these stars are not well characterized, it is difficult to determine their masses, ages, and radii (Kallinger et al., 2010).
HR 2582 was of particular interest because its mass could be inferred using other data besides asteroseismology. Baudin et al. (2012, hereafter B12) used spectroscopic observations to determine the following parameters: rotational velocity (102 km s-1), effective temperature (4665200 K), surface gravity log (1.40.3 cm s-2), metallicity [Fe/H] (-0.180.14), luminosity (log = 2.700.15 ), and finally a radius (348 ) using the Stefan-Boltzmann law.
HR 2582 was observed for 55 days using CoRoT during its first science run. B12 found evidence for solar-like oscillations at low frequencies (between 10 and 20 Hz) with a spacing of 1.70.1 Hz between consecutive radial orders and noted that only radial modes are clearly visible in the data. They discovered an excess of power in the power density spectrum at Hz and determined the star’s mass using
| (1) |
Their value was , which indicates HR 2582 is more massive than the stars in the red clump group described by Hekker et al. and Miglio et al. and implies rapid evolution.
These results provide insights on the internal workings during the final evolutionary stages when the star is burning hydrogen in a shell, is burning its central helium, or is in the last stage of He-shell burning. While the star can be placed on the Hertzsprung-Russell diagram with relative precision, it is not sufficient to distinguish between the three evolutionary stages. Still, the results provide strong constraints on stellar interior models and are a good test case for those models (B12).
The advantage interferometry brings to HR 2582 is the ability to directly measure the angular diameter of the star instead of inferring its parameters using indirect methods. Then is determined using our angular diameter plus the distance to the star known from its parallax, and is calculated. We combine our results with those from stellar oscillation frequencies to more completely understand the star and determine its mass. Section 2 details our observing procedure; Section 3 discusses the visibility measurements and how stellar parameters were calculated, including angular diameter, radius, luminosity, and temperature; Section 4 explores the physical implications of the new measurements; and Section 5 summarizes our findings.
2 Interferometric Observations
We observed HR 2582 using the Center for High Angular Resolution Astronomy (CHARA) Array on 2012 December 12. The CHARA Array is a six-element optical-infrared interferometer located on Mount Wilson, California (ten Brummelaar et al., 2005). We used the Classic beam combiner in the -band (2.13 m) with the 279 m S1-W1 baseline.111The three arms of the CHARA Array are denoted by their cardinal directions: “S”, “E”, and “W” are south, east, and west, respectively. Each arm bears two telescopes, numbered “1” for the telescope farthest from the beam combining laboratory and “2” for the telescope closer to the lab. The “baseline” is the distance between the telescopes. For a full description of the instrument, and the observing procedure and data reduction process used here, see ten Brummelaar et al. (2005) and McAlister et al. (2005).
When observing using an interferometer, selecting appropriate calibrator stars is extremely important because they are the standard against which we measure the scientific target. We used two calibrators, HD 46487 and HD 49434, which are both unresolved, single stars that acted as point sources. Because the stars’ angular diameters are so small, uncertainties in their apparent sizes did not affect the target’s diameter calculation as much as if they had a comparable angular size. We interleaved calibrator and target star observations so that every target was flanked by calibrator observations made as close in time as possible, which allowed us to convert instrumental target and calibrator visibilities to calibrated visibilities for the target.
We created spectral energy distribution (SED) fits to each calibrator star to check for possible unseen close companions. We used published photometric values combined with Kurucz model atmospheres222Available to download at http://kurucz.cfa.harvard.edu. based on and log from the literature to estimate their angular diameters. The stellar models were fit to observed photometry after converting magnitudes to fluxes using Colina et al. (1996, ) and Cohen et al. (2003, ). The photometry, and log values, and resulting angular diameters for the calibrators are listed in Table 1. There were no hints of excess emission associated with a low-mass stellar companion or circumstellar disk in the calibrators’ SED fits (see Figure 1).
3 Results
3.1 Angular Diameter Measurement
The observed quantity of an interferometer is defined as the visibility (), which is fit with a model of a uniformly-illuminated disk (UD) that represents the observed face of the star. The diameter fit to was based upon the UD approximation given by , where is the first-order Bessel function and , where is the projected baseline at the star’s position, is the apparent UD angular diameter of the star, and is the effective wavelength of the observation (Shao & Colavita, 1992). A more realistic model of a star’s disk involves limb-darkening (LD), and the relationship incorporating the linear LD coefficient (Hanbury Brown et al., 1974) is:
| (2) |
where . Table 2 lists the date of observation, the projected baseline , the calibrated visibilities (), and errors in ().
The LD coefficient of 0.31 was obtained from Claret & Bloemen (2011) after adopting a of 4750 from Wright et al. (2003) and a log of 2.14 cm s-2 from Cox (2000) for a K0 III, the spectral type listed in Wright et al. The resulting is 0.9780.020 mas and is 1.0050.020 mas, a 2 error. Figure 2 shows the fit for HR 2582. Limb-darkening is a second-order effect in the visibility curve that appears only after the first null in the visibility curve, i.e., when the visibility drops to zero. Because we are not beyond that null, we do not expect to see limb-darkening effects in our data and do not need to incorporate it into our model fit.
For the fit, the errors were derived using the reduced minimization method (Wall & Jenkins, 2003; Press et al., 1992): the diameter fit with the lowest was found and the corresponding diameter was the final . The errors were calculated by finding the diameter at on either side of the minimum and determining the difference between the diameter and diameter. The resulting is 19.8 and the reduced (/DoF) is 3.3.333The degrees of freedom (DoF) is the number of observations minus the number of parameters fit to the data. When the is forced to be 1, is 6.0 and the errors nearly double from 0.020 to 0.036 mas. However, Andrae (2010) describes why forcing is not recommended: when the is forced to be 1, it implies the model is completely correct, which is most often not the case. Even if the model is perfect, the DoF must be large in order to allow us to force the to equal one with impunity. In this situation, our DoF is 6 so we use the errors associated with , not .
3.2 Stellar Radius, Luminosity and Effective Temperature
HR 2582 has a parallax of 2.990.44 mas (van Leeuwen, 2007), which translates to a distance of 334.549.2 pc. When combined with our newly measured , this gives us the physical radius of the star: 35.765.31 , a error of 15. This is comparable to the radius determined by B12 of 34 8 and provides better precision over their error of 24.
In order to determine the and of HR 2582, we constructed its SED using photometric values published in Cousins (1962), McClure & Forrester (1981), Haggkvist & Oja (1987), Beichman et al. (1988), Golay (1972), Kornilov et al. (1991), Mermilliod et al. (1997), and Cutri et al. (2003). The assigned uncertainties for the Two Micron All Sky Survey infrared measurements are as reported, and an error of 0.05 mag was assigned to the optical measurements.
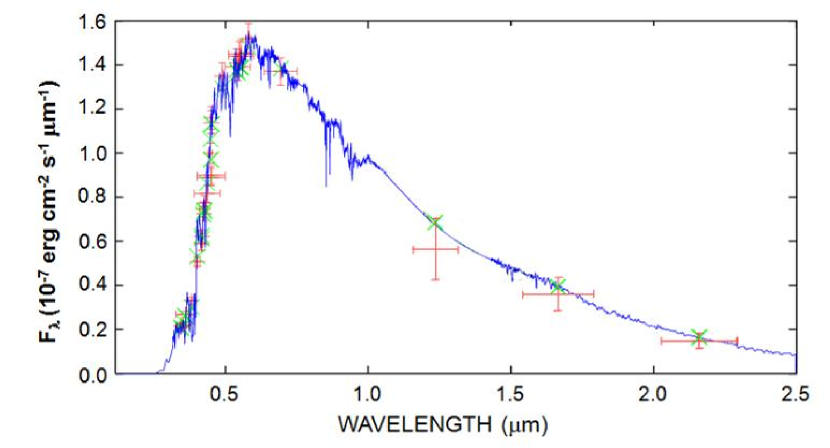
HR 2582’s bolometric flux () was determined by finding the best fit stellar spectral template from the flux-calibrated stellar spectral atlas of Pickles (1998) using the minimization technique. This best SED fit allows for extinction, using the wavelength-dependent reddening relations of Cardelli et al. (1989). The best fit was found using a K1 III template with an assigned temperature of K, an extinction of = 0.091 0.042 mag, and a of . Figure 3 shows the best fit and the results are listed in Table 3.
We then combined with HR 2582’s distance to estimate its luminosity where , which produced a value of 517.8 17.5. The uncertainty in is largely due to the uncertainty in the distance. The was also combined with the star’s to determine its effective temperature by inverting the relation
| (3) |
where is the Stefan-Boltzmann constant. This produces an effective temperature of K, a 1 error. Because is chosen based on a given , we checked to see if would change based on our new and iterated. increased by 0.02 to 0.33, increased by only 0.001 mas to 1.0060.020 mas, and decreased by 2 K to 4577 K, which are well within the errors. We adopted these and as our final values (see Table 3). The very slight change in did not affect the radius calculation. We also note the log used here (2.14 cm s-2) differs from that determined by B12 (1.4 cm s-2). We used B12’s log to select and the resulting change in is +0.01 to 0.32 and we see above how little effect that has on the resulting .
In Section 3.1, we compared the merits of versus and leaned in favor of using errors. Those are the results listed in Table 3. However, if we do assume our model is perfect, force to equal one, and use the resulting error of 0.036 mas in , increases from 60 to 91 K, an error of 2, and remains the same at 5.31 , an error of 15.
4 Discussion
As a check to our measurement, we estimated HR 2582’s using two additional methods: (1) we used the SED fit as described in Section 3.2; and (2) we used the relationship between the star’s dereddened () color (calculated with the extinction curve described in Cardelli et al., 1989), , and from Blackwell & Lynas-Gray (1994). Our measured is 1.0060.020 mas, the SED fit predicts 0.9720.053 mas, and the color-temperature-diameter relationship produces 0.9260.369 mas.
The main sources of errors for the three methods are uncertainties in visibilities for our interferometric measurement, uncertainties in the comparison between the observed and model fluxes for a given set of and log values for the SED estimate, and uncertainties in the parameters of the relation and the spread of stars around that relation for the color-temperature-diameter determination. The three agree within the errors, and our interferometric measurements provide an error approximately 3 and 18 times smaller than the other methods, respectively.
We used our new values of and in Equation 1 to calculate HR 2582’s mass with the result of 5.61.7 . This is slightly more massive than B12’s mass of 5.22.9 but is well within the errors. We also used and to estimate the age of HR 2582 using the Yonsei–Yale isochrones (, Yi et al., 2001). We adopted [Fe/H] = –0.18 to be consistent with B12. The resulting age is 165 Myr (see Figure 4), which is higher than the 105.5 Myr age quoted in B12. They do not discuss how they determined the age except to note that it is one of the model outputs, and do not give an error for that parameter.
This resulting age does not definitively answer the question of what evolutionary state HR 2582 is currently occupying. If the star is burning hydrogen in a shell on the first ascending branch, it is 157 Myr old. If it is burning helium in its core on the descending or second ascending branches, it is 163 Myr or 180 Myr old, respectively (B12). We lack the precision to determine exactly what is occurring in the interior of this star but it remains an excellent test case for stellar models, particularly with our more precise radius and temperature measurements.
5 Summary
We directly measured the limb-darkened angular diameter of HR 2582 with the CHARA Array interferometer and used our result of 1.0060.020 mas along with the parallax measurement and photometry from the literature to calculate its physical radius (35.765.31 ), luminosity (517.817.5 ), and effective temperature (457760 K). We combined our and values with stellar oscillation results from B12 to determine the mass, which was 5.61.7 and the same and with isochrones to estimate the star’s age at 165 Myr.
References
- Allende Prieto & Lambert (1999) Allende Prieto, C., & Lambert, D. L. 1999, A&A, 352, 555
- Andrae (2010) Andrae, R. 2010, arXiv:1009.2755
- Auvergne et al. (2009) Auvergne, M., Bodin, P., Boisnard, L., et al. 2009, A&A, 506
- Baudin et al. (2012) Baudin, F., Barban, C., Goupil, M. J., et al. 2012, A&A, 538, A73 [B12]
- Beichman et al. (1988) Beichman, C. A., Neugebauer, G., Habing, H. J., Clegg, P. E., & Chester, T. J. 1988, Infrared astronomical satellite (IRAS) catalogs and atlases. Volume 1: Explanatory supplement, 1
- Blackwell & Lynas-Gray (1994) Blackwell, D. E., & Lynas-Gray, A. E. 1994, A&A, 282, 899
- Cardelli et al. (1989) Cardelli, J. A., Clayton, G. C., & Mathis, J. S. 1989, ApJ, 345, 245
- Claret & Bloemen (2011) Claret, A., & Bloemen, S. 2011, A&A, 529, A75
- Cohen et al. (2003) Cohen, M., Wheaton, W. A., & Megeath, S. T. 2003, AJ, 126, 1090
- Colina et al. (1996) Colina, L., Bohlin, R. C., & Castelli, F. 1996, AJ, 112, 307
- Cousins (1962) Cousins, A. W. J. 1962, Monthly Notes of the Astronomical Society of South Africa, 21, 20
- Cox (2000) Cox, A. N. 2000, Allen’s Astrophysical Quantities (Melville, NY: AIP Press)
- Cutri et al. (2003) Cutri, R. M., et al. 2003, The IRSA 2MASS All-Sky Point Source Catalog, NASA/IPAC Infrared Science Archive
- Golay (1972) Golay, M. 1972, Vistas in Astronomy, 14, 13
- Haggkvist & Oja (1987) Haggkvist, L., & Oja, T. 1987, A&AS, 68, 259
- Hanbury Brown et al. (1974) Hanbury Brown, R., Davis, J., Lake, R. J. W., & Thompson, R. J. 1974, MNRAS, 167, 475
- Hekker et al. (2009) Hekker, S., Kallinger, T., Baudin, F., et al. 2009, A&A, 506, 465
- Kallinger et al. (2010) Kallinger, T., Weiss, W. W., Barban, C., et al. 2010, A&A, 509, A77
- Kornilov et al. (1991) Kornilov, V. G., Volkov, I. M., Zakharov, A. I., et al. 1991, Trudy Gosudarstvennogo Astronomicheskogo Instituta, 63, 1
- McAlister et al. (2005) McAlister, H. A., et al. 2005, ApJ, 628, 439
- McClure & Forrester (1981) McClure, R. D., & Forrester, W. T. 1981, Publications of the Dominion Astrophysical Observatory Victoria, 15, 439
- Mermilliod (1991) Mermilliod, J. C. 1991, Catalogue of Homogeneous Means in the UBV System, Institut d’Astronomie, Universite de Lausanne
- Mermilliod et al. (1997) Mermilliod, J.-C., Mermilliod, M., & Hauck, B. 1997, A&AS, 124, 349
- Miglio et al. (2009) Miglio, A., Montalbán, J., Baudin, F., et al. 2009, A&A, 503, L21
- Monet et al. (2003) Monet, D. G., et al. 2003, AJ, 125, 984
- Paunzen et al. (2006) Paunzen, E., Schnell, A., & Maitzen, H. M. 2006, A&A, 458, 293
- Pickles (1998) Pickles, A. J. 1998, PASP, 110, 863
- Press et al. (1992) Press, W. H., Teukolsky, S. A., Vetterling, W. T., & Flannery, B. P. 1992, Numerical recipes in C. The art of scientific computing (Cambridge: University Press, c1992, 2nd ed.)
- Savage et al. (1985) Savage, B. D., Massa, D., Meade, M., & Wesselius, P. R. 1985, ApJS, 59, 397
- Shao & Colavita (1992) Shao, M., & Colavita, M. M. 1992, ARA&A, 30, 457
- ten Brummelaar et al. (2005) ten Brummelaar, T. A., et al. 2005, ApJ, 628, 453
- van Leeuwen (2007) van Leeuwen, F. 2007, Hipparcos, the New Reduction of the Raw Data (Cambridge, UK Series: Astrophysics and Space Science Library; Springer)
- Wall & Jenkins (2003) Wall, J. V., & Jenkins, C. R. 2003, Practical Statistics for Astronomers (Princeton Series in Astrophysics; Cambridge: Cambridge Univ. Press)
- Wright et al. (2003) Wright, C. O., Egan, M. P., Kraemer, K. E., & Price, S. D. 2003, AJ, 125, 359
- Yi et al. (2001) Yi, S., Demarque, P., Kim, Y.–C., et al. 2001, ApJS, 136, 417
| Parameter | HD 46487 | HD 49434 |
|---|---|---|
| magnitude | 4.39 | 6.06 |
| magnitude | 4.95 | 6.03 |
| magnitude | 5.09 | 5.74 |
| magnitude | 5.14 | 5.59 |
| magnitude | 5.27 | 5.45 |
| magnitude | 5.38 | 5.40 |
| magnitude | 5.44 | 5.13 |
| magnitude | 5.46 | 5.01 |
| () | 0.02 | 0.00 |
| (K) | 15200 | 7413 |
| log (cm s-2) | 4.04 | 4.29 |
| (mas) | 0.2100.004 | 0.3470.016 |
Note. — The photometric values are from the following sources: - Mermilliod (1991), - Monet et al. (2003), - Cutri et al. (2003). E() was from Savage et al. (1985) for HD 46487 and Paunzen et al. (2006) for HD 49434. and log was from Cox (2000) for HD 46487 based on its spectral type (B5 V) and from Allende Prieto & Lambert (1999) for HD 49434. The uniform-disk angular diameters () are the result of the SED fitting procedure described in Section 2.
| MJD | (m) | ||
|---|---|---|---|
| 56273.285 | 172.02 | 0.902 | 0.054 |
| 56273.290 | 174.25 | 0.868 | 0.052 |
| 56273.306 | 183.32 | 0.796 | 0.054 |
| 56273.343 | 208.48 | 0.812 | 0.021 |
| 56273.404 | 248.94 | 0.736 | 0.036 |
| 56273.423 | 259.43 | 0.602 | 0.015 |
| 56273.437 | 265.92 | 0.664 | 0.028 |
| Parameter | Value | Reference |
|---|---|---|
| From the literature: | ||
| magnitude | 6.040.01 | Mermilliod (1991) |
| magnitude | 3.650.28 | Cutri et al. (2003) |
| (mas) | 2.990.44 | van Leeuwen (2007) |
| Distance (pc) | 334.549.2 | Calculated from |
| 0.33 | Claret & Bloemen (2011) | |
| The results of our SED fit: | ||
| 0.090.04 | ||
| (10-7 erg s-1 cm-2) | 1.480.05 | |
| (K) | 4656120 | |
| (mas) | 0.9720.053 | |
| The results of this work: | ||
| (mas) | 0.9780.020 | |
| (mas) | 1.0060.020 | |
| () | 35.765.31 | |
| (K) | 457760 | |
| () | 517.817.5 | |
| Mass () | 5.6 1.7 | |
| Age (Myr) | 165 | |