A combined experimental and computational study of the pressure dependence of the vibrational spectrum of solid picene C22H14
Abstract
We present high-quality optical data and density functional perturbation theory calculations for the vibrational spectrum of solid picene (C22H14) under pressure up to 8 GPa. First-principles calculations reproduce with a remarkable accuracy the pressure effects on both frequency and intensities of the observed phonon peaks. We use the projection on molecular eigenmodes to unambiguously fit the experimental spectra, resolving complicated spectral structures, in a system with hundreds of phonon modes. With these projections, we can also quantify the loss of molecular character under pressure. Our results indicate that picene, despite a compression of the unit cell, remains substantially a molecular solid up to 8 GPa, with phonon modes displaying a smooth and uniform hardening with pressure, without any evidence of structural phase transitions. The Grüneisen parameter of the 1380 cm-1 Raman peak () is much lower than the effective value () due to K doping. Therefore, doping and pressure have very different effects and it can be argued that softening of the 1380 cm-1 mode is probably due to coupling with electronic states in K doped solid picene.
pacs:
62.50.-p, 78.30.-j, 63.20.dk, 74.70.KnIntroduction
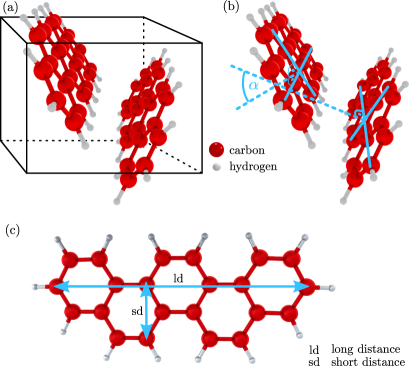
A superconductive phase has recently been observed in potassium-doped picene, below a critical temperature (Tc) of 7-18 K. Mitsuhash2010 This finding has attracted wide attention being the first report of “high-” superconductivity (SC) in an aromatic compound. Picene (C22H14) is indeed an alternant polycyclic aromatic hydrocarbon (PAH), i.e. a planar aromatic molecule, formed by juxtaposed benzene rings (see Fig. 1). Specifically, this molecule comprises five rings, arranged in a zig-zag fashion. After the initial report, superconductive phases were also observed in other PAHs upon doping with alkali, alkali-earths and rare-earths. These other compounds, i.e. phenanthrene, Wang2011_SC-phenanthrene ; Wang2011_SC-phenanthrene2 ; Wang2012_SC-phenanthrene3 coronene, Mitamura2011_perpestive-picene and dibenzopentacene Xue2011_SC-dipicene comprise three, six and seven benzene rings respectively, thus suggesting that PAHs most likely form a completely new and possibly large class of superconductors.
The superconducting mechanism in PAHs is still a matter of theoretical and experimental debate; first-principles studies have concentrated on picene, and shown that both the electron-electron () Giovannetti2011_electronicStr ; Kim2011_electronicStr ; valenti_2012 ; arita_2012 ; kim_2013 and electron-phonon () interaction Casula2011_ele-ph ; Subedi2011_ele-ph ; Kato2011_ele-ph ; Sato2012_ele-ph are sizeable in these -bonded systems. Works that ascribe superconductivity to the interaction disagree on the relative importance of intermolecular, intramolecular and intercalant phonons to the coupling. In fact, linear-response calculations in the rigid-band approximation for solid picene find that the coupling is dominated by intramolecular phonons, with an intensity ( meV for holes, and 110 meV for electrons), Subedi2011_ele-ph that is consistent with the results of simpler vibrational analysis. Kato2011_ele-ph ; Sato2012_ele-ph Linear response calculations which include the dopants explicitly in a theoretically-optimized structure find a rather different spectral distribution of the coupling, which indicates an important role of the dopant and metallic screening. This would make PAHs substantially different from the fullerenes, where the existing models for superconductivity rely on local (molecular) estimates of the coupling. Massimo ; Olle A definite confirmation of this scenario could only come from a detailed comparison of measured and calculated phonon spectra for doped and undoped samples, which would allow to test the reliability of the approximations used in different first-principles calculations.
At the moment there are still difficulties in obtaining single phase, well characterized superconducting PAHs, while, due to recent advances in chemical synthesis, high-quality samples of pure solid picene are now available. Besides superconductivity, picene, like other PAHs, has important possible applications in organic electronics, Mitamura2011_perpestive-picene ; Okamoto2008_FET-picene and this has stimulated several experimental and theoretical studies of its vibrational, JPCM2012_IR_Ram_picene ; Girlando2012_IR_Ram_picene ; Kambe_2013 optical Citroni2013 ; Fanetti2013_HP ; Knupfer2011 and electronic Xin2012_ARPES properties.
In this work, we present a combined experimental and theoretical analysis of the vibrational spectra of solid picene under pressure, up to 8 GPa. We collected high-quality Raman and infrared (IR) data at room temperature, and compared those with detailed linear-response calculations of the same spectra Baroni2001_DFPT as a function of pressure. Experimental and theoretical spectra showed a remarkable agreement, for both the positions and intensities of the peaks. We also propose a novel theoretical analysis of the vibrational modes, based on the projections on molecular eigenvectors, which permits us to obtain a deep microscopical insight into the phonon spectra. We show that, besides permitting to disentangle the complicated experimental spectra, this analysis can also be used to characterise the increase of intermolecular interactions as a function of pressure. A similar analysis, applied to other pure and intercalated molecular solids, could help to quantify intermolecular interactions.
The main outcomes of our study are: (a) a complete characterization of the phonon spectrum of picene, (b) a detailed understanding of the pressure behavior of picene including a classification of all phonon modes,(c) a strong indication that doping causes an expansion of the lattice in K-doped samples and (d) that the lattice expansion is not the main origin of the frequency softening of the Raman peak observed in K-doped samples.
The paper is organized as follows: in section I, we give an overview of the experimental and computational methods; these are described in detail in appendix A. In section II, we present the main results of our study, i.e. the measured IR and Raman spectra under pressure with a complete assignment of of the most intense lines. The ab-initio equation of state (EOS) of picene is also presented in this section. In section III, based on the experimental and first-principles results, we discuss the pressure evolution of the vibrational properties of crystalline picene. We start from the evolution of selected modes with pressure, introduce two compact quantities that can be used to characterise the gradual breakdown of the vibrational picture, and finally discuss the Raman peak at 1380 cm-1. Mitamura2011_perpestive-picene ; Kambe_2013 Section IV contains the details of the spectral analysis and of the applied theoretical concepts, which we believe to be useful for further studies. The main conclusions of our study are summarised in Sect. V.
I Methods
Solid picene was prepared by a new optimized synthesis route which permits us to obtain sizeable quantities of pure polycrystalline picene powder Malavasi2011_picene-prep . Samples have been fully characterized by X-ray diffraction and ambient pressure Raman and IR spectroscopyJPCM2012_IR_Ram_picene . High pressure Raman and IR measurements have been performed by using diamond anvil cells (DAC). Raman spectra have been collected by using two different instruments with different excitation lines. The first spectrometer at the Department of Physics of the Sapienza University of Rome was equipped with a He-Ne laser ( nm), the second one at Porto Conte Ricerche laboratory (Alghero, Italy) was equipped with a diode laser ( nm). High-pressure IR transmittance data of the picene samples in the DAC were collected at room-temperature exploiting the high brilliance of SISSI beamline of the ELETTRA synchrotron (Trieste, Italy) Lupi2007_SISSI .
For first-principles calculations of the Raman and IR cross sections under pressure, we employed Density Functional Perturbation Theory (DFPT), Baroni2001_DFPT ; Lazzeri2003_Raman_DFT as implemented in the quantum-espresso code. qe We used standard LDA norm-conserving pseudopotentials. psps Further details about experimental and computational procedures are given in the appendix A.
II Results
II.1 IR and Raman spectra
Experimental data and theoretical calculations about Raman and IR spectra at ambient pressure are already available in the literatureJPCM2012_IR_Ram_picene ; Girlando2012_IR_Ram_picene . The picene molecule has C2v symmetry; of the 102 optical modes, those with (35), (16), (34) symmetry are both Raman and IR active, while the (17) are only Raman-active table:web . A detailed list of peak frequency, symmetry, optical activity and normalized intensity of the vibrational modes at zero pressure is given in our earlier work JPCM2012_IR_Ram_picene . We want to remark that for an isolated molecule, the Raman response is dominated by the (totally symmetric) modes, whereas the IR response is given by the modes JPCM2012_IR_Ram_picene ; Girlando2012_IR_Ram_picene . Apart from the specific assignment, vibrations with a frequency in the range 200 - 1000 cm-1 can be ascribed to both, out-of-plane and in-plane vibrational modes of carbon and hydrogen, whereas those above 1000 cm-1 are basically due to in-plane vibrational modes. Finally modes above 2900 cm-1 (not shown here) can be attributed to hydrogen vibrations Subedi2011_ele-ph .
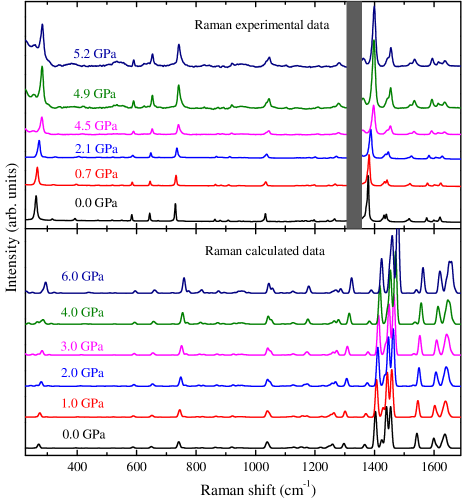
A comparison of the measured and calculated IR and Raman spectra under pressure is shown in Fig. 2 and 3. As evident from these figures, all the vibrational modes display a smooth and uniform hardening with pressure, without any evidence of structural phase transitions. In the experimental IR spectra (Fig. 2, upper panel), we notice that the most intense absorption lines result from vanishingly small transmitted intensities and, therefore, can be affected by rather large uncertainties. A good signal to noise ratio is instead obtained for a large number of lower intensity absorption peaks. In the experimental Raman spectra (Fig. 3, upper panel) the total integral of each spectrum has been normalized to the sum of the theoretical Raman cross-sections in order to obtain a meaningful comparison between the experimental and theoretical intensities.
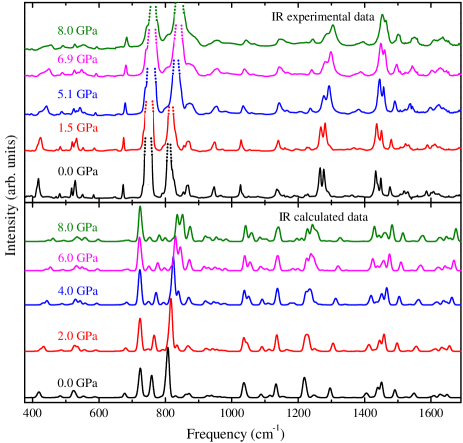
A good agreement between experiment and theory is found for both IR and Raman spectra. Calculations reproduce remarkably well the absolute peak frequencies and intensities, including their detailed pressure dependence, over the whole spectral range. The only exception is the high frequency region of the Raman spectra where the calculated peaks intensities appear higher than the experimental ones. Both calculated and experimental IR spectra show the most intense peaks in the frequency region around 800 cm-1. Even the counterintuitive enhancement under pressure of the spectral weight in the 1600 cm-1 region in the IR spectra is well reproduced by calculations. A good example is the IR spectral structure around 1030 cm-1 (see Fig. 2). On increasing the pressure above 2 GPa the theoretical spectra show a clear splitting of the low-pressure single peak into two components, whereas the experimental spectra show a peak broadening and the evolution toward an asymmetric line shape. It is clear that with the help of the DFT calculation we can cope with a lower experimental definition due to the spectral resolution, pressure gradients, sample inhomogeneities , and obtain a fine spectral deconvolution. Although less evident, a similar effect is also observed in the Raman spectrum around 730 cm-1. The overall agreement shows that DFT calculations are very reliable in describing this system under lattice compression (see Fig. 3). This makes us confident about using the microscopical insight provided by the calculations for a deeper analysis of experimental spectra. A complete assignment of the vibrational modes between 400 and 1700 cm-1 is thus possible.
The frequency, the symmetry and the IR/Raman activitynote:tab:crit computed for the peaks within the range 700-1700 cm-1 are listed in table 1. The experimental peak frequencies, as obtained through a detailed lineshape analysis, are also reported (examples can be found in Section IV.1 and in appendix B). Wherever the assignment is unambiguous, we also report the Davydov partners of the main lines Davydov (marked by a bracket “” in table 1). Two crystalline modes form a (generalized) Davydov pair if their phonon eigenvector corresponds to the in- and out-of-phase linear combination of the same molecular vibration; section IV.2 describes in detail how these are obtained. However, we notice that in picene the intensities for Davydov pairs differ by at least an order of magnitude with an exception of the IR-active pair around 800 cm-1, therefore Davydov splittings are hardly accessible experimentally (see also Fig. 8).
| Sym | |||||||||
|---|---|---|---|---|---|---|---|---|---|
| (cm-1) | () | () | (cm-1) | ||||||
| 725.6 | 5.24 | () | 2 | () | 0.00 | 740 | |||
| 756.4 | 0.89 | () | 78 | () | 0.14 | - | |||
| 759.6 | 3.67 | () | 0 | () | 0.12 | 756 | |||
| 801.3 | 2.68 | () | 64 | () | 0.13 | ||||
| 808.6 | 9.75 | () | 2 | () | 0.13 | ||||
| 1035.1 | + | 2.33 | () | 11 | () | 0.02 | 1025 | ||
| 1037.7 | + | 0.07 | () | 938 | () | 0.04 | - | ||
| 1133.9 | 1.55 | () | 25 | () | 0.04 | 1134 | |||
| 1216.4 | 1.72 | () | 7 | () | 0.04 | 1265 | |||
| 1223.8 | 1.64 | () | 5 | () | 0.10 | 1276 | |||
| 1400.4 | 0.15 | () | 22 | () | 0.06 | - | |||
| 1403.1 | 0.47 | () | 6829 | () | 0.08 | 1377 | |||
| 1424.1 | 0.00 | 1482 | () | 0.10 | 1433 | ||||
| 1438.1 | 0.77 | () | 18 | () | 0.08 | - | |||
| 1440.0 | 1.25 | () | 7937 | () | 0.08 | 1433 | |||
| 1451.0 | 3.05 | () | 14 | () | 0.08 | 1450 | |||
| 1451.8 | 0.00 | () | 1804 | () | 0.08 | 1440 | |||
| 1454.2 | 0.02 | () | 108 | () | 0.08 | - | |||
| 1454.5 | 0.03 | () | 6309 | () | 0.09 | 1440 | |||
| 1491.3 | 1.59 | () | 1 | () | 0.07 | 1475 | |||
| 1493.6 | 0.01 | () | 1 | () | 0.07 | - | |||
| 1542.3 | 0.05 | () | 2792 | () | 0.07 | 1516 | |||
| 1544.5 | 0.28 | () | 5 | () | 0.07 | - | |||
| 1599.0 | 0.12 | () | 1518 | () | 0.07 | 1574 | |||
| 1599.1 | 0.00 | () | 380 | () | 0.06 | - | |||
| 1633.3 | 0.18 | () | 1714 | () | 0.06 | ||||
| 1639.3 | 0.04 | () | 1732 | () | 0.07 | ||||
Table 1 also reports the values of the the Grüneisen parameters Postorino_2002 of the vibrational modes of solid picene evaluated according to the formula:
| (1) |
Since the pressure versus volume ( vs ) relation was not accessible experimentally, we used the theoretical equation of state (EOS) (see sect. II.2) to determine in eq. 1. For all modes, both calculations and experimental results consistently show positive values, i.e. all frequencies harden upon lattice compression. The values reported in the table () are those extracted from DFT calculations which however agree very well with our measured data.
It is particularly interesting to compare our pressure results with two different phonon measurements in K doped samples, performed by the same group – see Ref. [5] and [21]. Both these works report on a frequency softening with increasing K doping, whereas opposite effects are claimed for the volume: a compression is reported in Ref. [5], an expansion in Ref. [21]. Our data clearly support the latter picture. In fact, a close inspection of the spectra reported in Ref. [5] shows a frequency softening of all the observed Raman peaks on increasing the K content. A general softening clearly indicates a lattice expansion. Other effects that could lead to the softening of phonon frequencies in K doped samples, such as electron-phonon coupling or charge transfer, would be extremely mode-dependent. In section III.3, we will continue this discussion, focusing on the Raman-active mode at 1380 cm-1, which has been used as a marker for electron transfer in alkali metal intercalated picene Mitamura2011_perpestive-picene ; Kambe_2013 .
II.2 Equation of State
We already mentioned above that the vs relation was experimentally not accessible. Therefore, for the EOS, we have to resort to our ab-initio (DFT) calculations. In order to maintain a reasonable balance between accuracy and computational cost, we employed the local density approximation (LDA). It is well-known that LDA leads to an overbinding in van der Waals (vdW) solids, but, compared to other widely-used functionals (GGA), it predicts in most cases stable structures and yields reasonable values of elastic constants and phonon frequencies. Hasegawa_2007 ; Ortmann_2006 ; Marzari_2005 .
We computed the total energy as a function of volume, for fully-optimised unit cells between 50% and 110% of the experimental volume. Fig. 4 (a) shows the results of our calculations for the Equation of State (symbols), together with a fit to the Birch-Murnaghan relation (line).
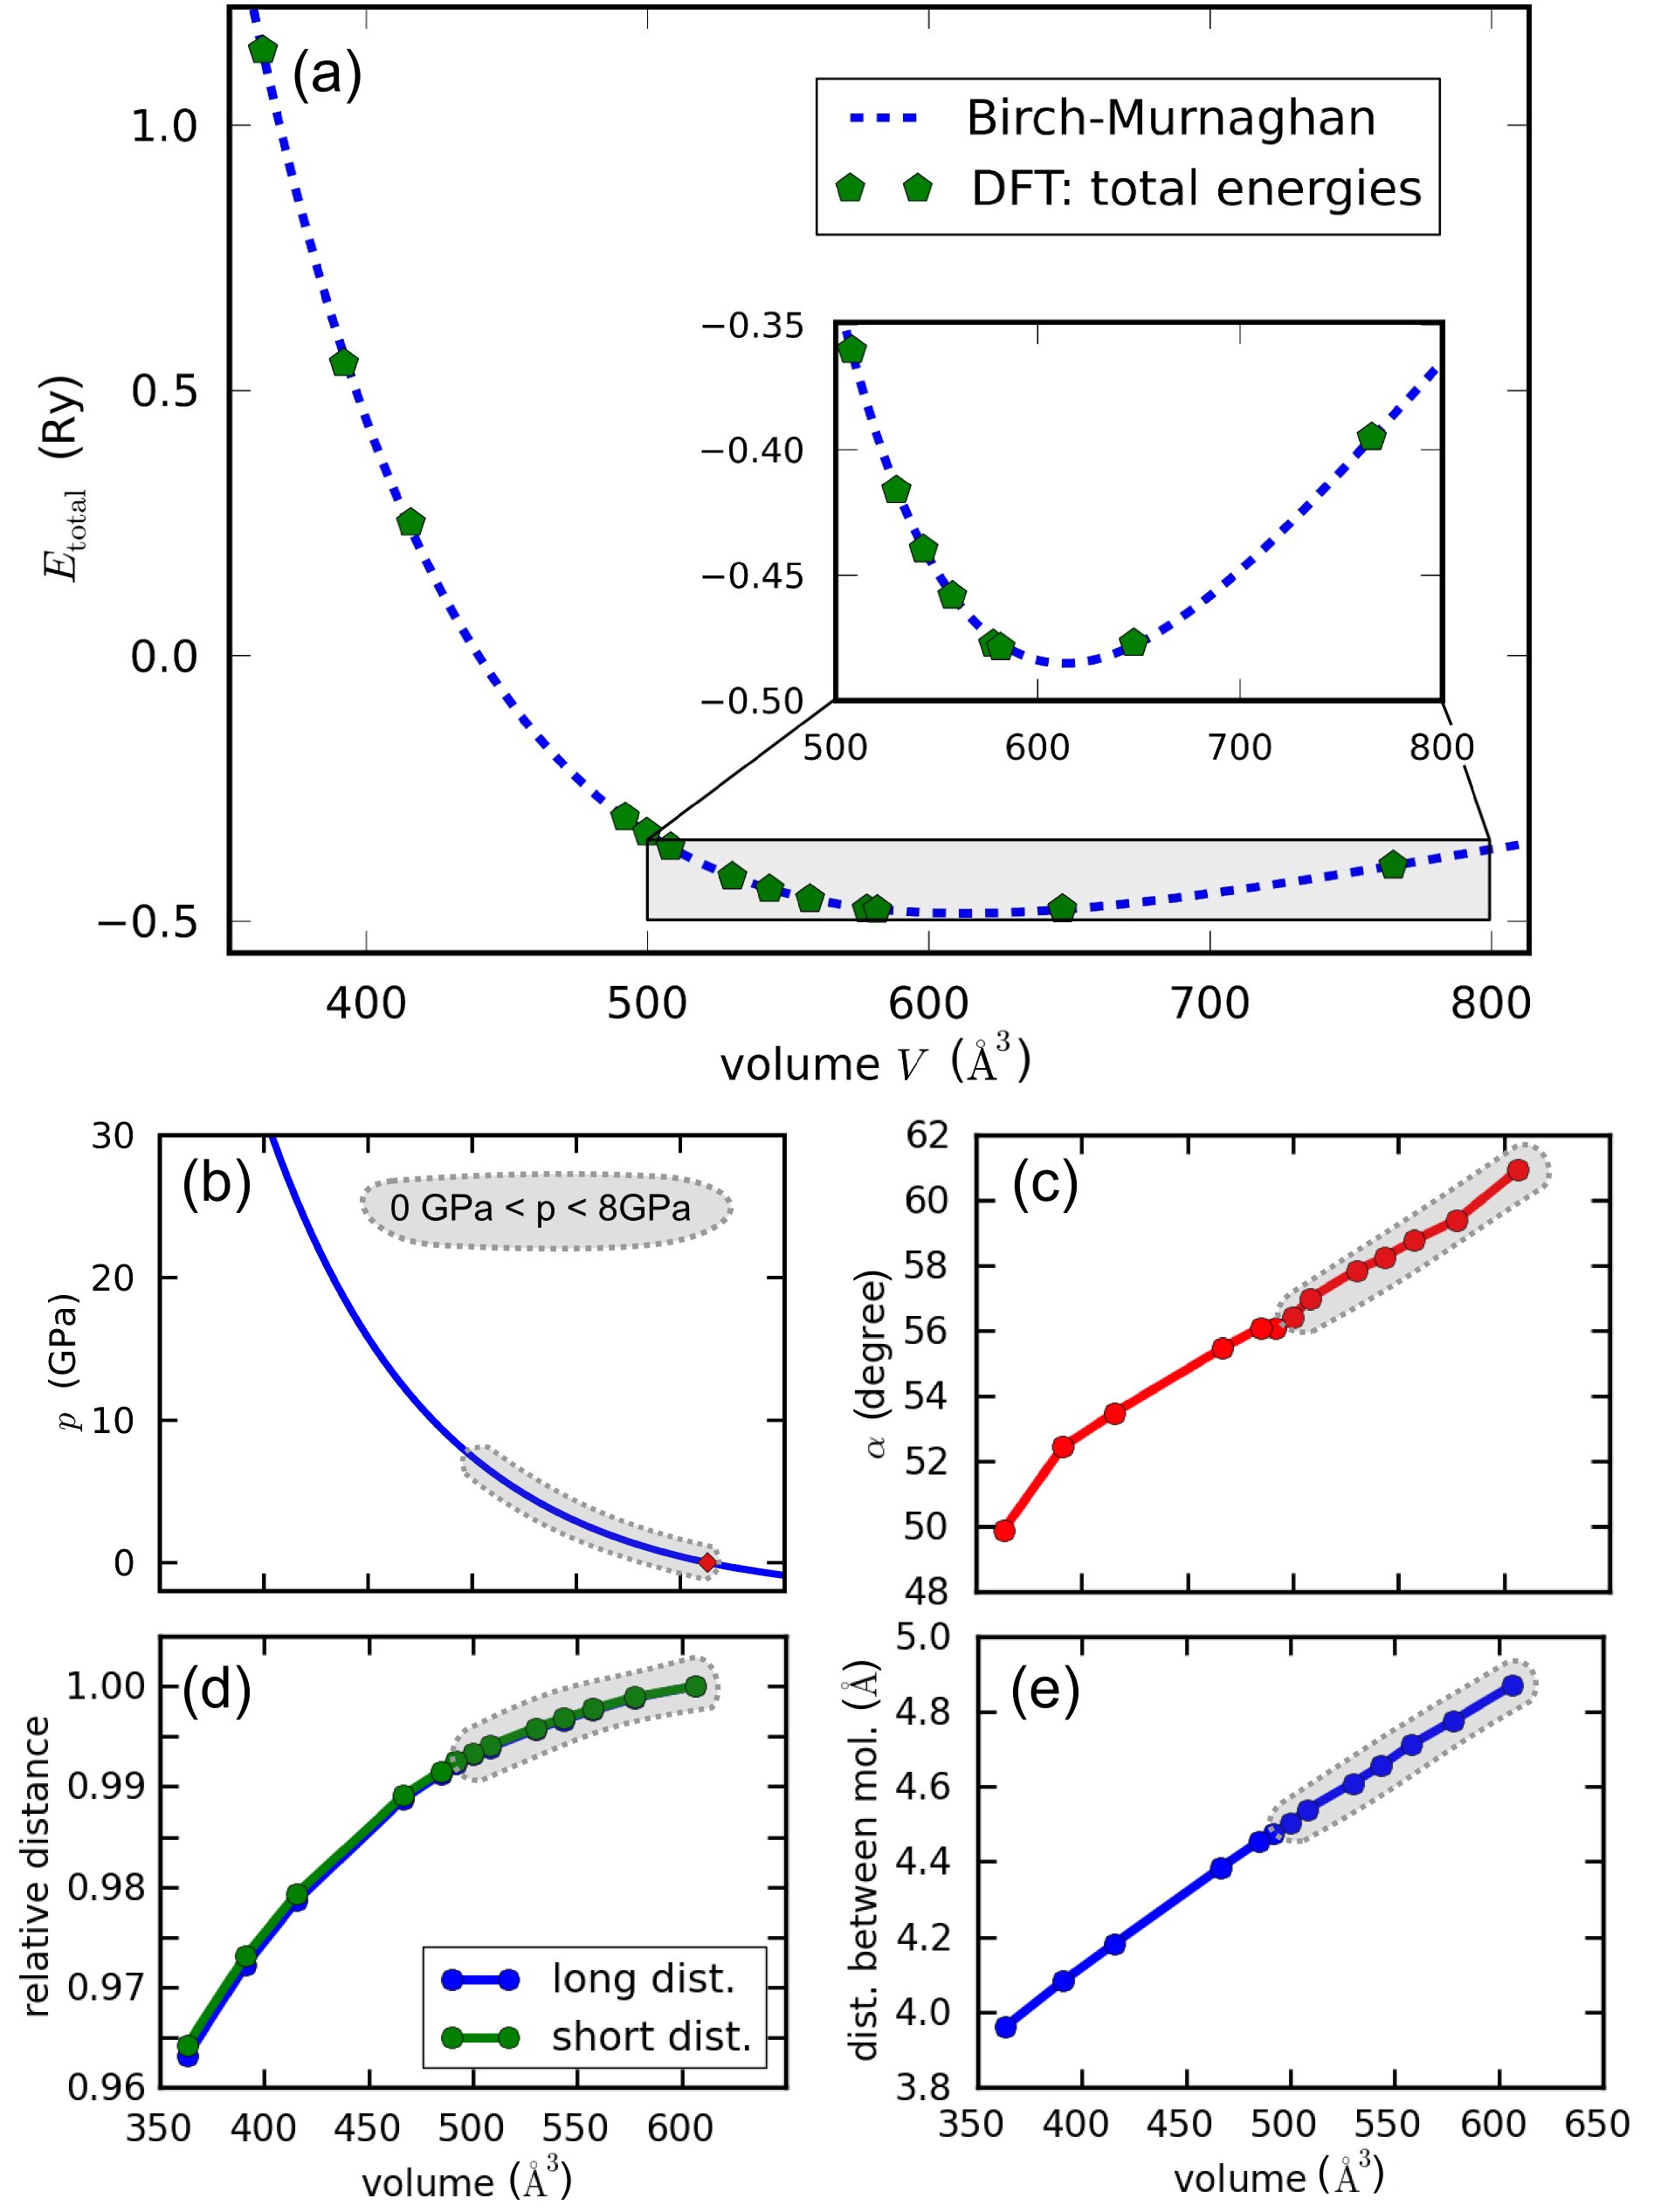
We obtained an equilibrium volume Å3, which is 13% smaller than the experimental valueKambe_2013 Å3, and a bulk modulus GPa with a derivative foot:vdw . The bulk modulus is the same order of magnitude as measured in a recent study for phenanthrene under pressure phena2013 . The authors also report a value anomalously small, roughly four times smaller than ours. The discrepancy may be due to the fact that the samples in Ref. [phena2013, ] show a coexistence of P2/m and Pmmm phases.
It is worth to notice that our calculated compressibility for crystalline picene is typical for a molecular system. Such a value naturally implies a large sensitivity of phonon modes with pressure, and indeed we find a remarkable hardening for all modes. The 8 GPa range accessible to our IR and Raman measurements corresponds to a 20 reduction of the unit-cell volume with respect to its equilibrium value. This range is shown as a grey-shaded area in Fig. 4 (a)-(e).
Besides a decrease of the unit cell volume, pressure also causes a change in the relative coordinates of the two molecules inside the unit cell. In particular, the angle between the molecules decreases monotonically, favouring a more parallel alignment – see Fig. 4 (c). As a consequence, the distance between the two geometrical centres shrinks – see Fig. 4 (e). However, the contraction of the C22H14 molecules themselves, measured by the two intramolecular distances and , is much smaller, i.e. less than 1 over 8 GPa – see Fig. 4 (d). We also observe a slight bending of the molecules, which increases with pressure. We do not observe any structural transition, in accordance with experiment (see Sect.II.1). Moreover, it has been observed that picene remains insulating at room temperature up to 25 GPa; Fanetti2013_HP in the same pressure range, present calculations show that the LDA band gap decreases from eV to eV.
III Discussion
The detailed comparison of experiments and calculations allows us to characterize the behaviour of crystalline picene under pressure. In particular, the comprehensive knowledge of the phonon eigenvectors in the DFPT calculations not only allowed us to track the evolution of individual modes under pressure, but also to follow the gradual increase in intermolecular interactions.
III.1 Phonon Modes under Pressure
In the crystalline form of picene intermolecular interactions modify the phonon spectrum with respect to that of the pure molecule. This effect increases with pressure and, although impossible to access experimentally, it can be easily quantified with the help of first-principles calculations, using projections on molecular eigenvectors, as described in Sect. IV.2.
In the spectrum, we can identify three types of modes:
-
•
Modes which have a definite molecular character at =0, and retain it up to high pressures (molecular modes).
-
•
Modes which have a definite molecular character at =0, but lose it with pressure (mixed modes).
-
•
Modes which already at =0 have no definite molecular character (crystalline modes).
We can distinguish between these modes introducing the maximum projection on a molecular eigenmode, defined as , where are the eigenvectors of the single molecule and are the corresponding eigenvectors in the solid (for a detailed description see Sect. IV.2). Using this quantity, molecular modes are defined as modes which have , and retain a at GPa. Crystalline modes are those which at zero pressure have ,and thus cannot be represented as a single product of molecular vibrations at any pressure. Notice that this classification, being based on a quantitative definition in terms of partial eigenvectors, is different from the usual one in terms of intra- and inter-molecular phonons. In particular, crystalline modes are not simply rigid translations of vibrations of the full molecule, and thus occur also at large frequencies.
Crystalline modes represent of the total number of modes at GPa; molecular modes represent only , and the rest is represented by mixed modes. However, molecular modes have generally a high intensity, according to their Raman and IR selection rules.
Fig. 5 illustrates the relative importance of molecular and crystalline modes on the IR and Raman spectra, using the DFT spectra. The total spectrum is shown in black, molecular and crystalline modes are plotted in red and blue respectively. We notice that high-intensity crystalline peaks appear at and cm-1 in the Raman spectra, at cm-1 in the IR, and several other peaks should be clearly resolvable in experiment.
On the figure, we also indicated the corresponding irreducible representation of the most intense molecular peaks. Where the assignment is problematic, because several almost degenerate peaks occur at the same energy, we use greek letters. The frequencies are then reported in table 2, which is a collection of purely molecular modes with a finite contribution to the IR/Raman spectrum. In the table, out-of-plane modes are indicated with a star (). We notice that there is no particular predominance of in- or out-of-plane character in the molecular modes.

The existence and relative weight of crystalline and mixed modes can be used to quantify the intermolecular interaction, as illustrated in the following.
| Irr. | opt. | |||
|---|---|---|---|---|
| (cm-1) | Rep. | act. | ||
| 269.8 | 0.91 | R | ||
| 415.1 | 0.98 | IR | ||
| 521.5 | 0.96 | IR | ||
| 587.9 | 0.99 | R | ||
| 649.0 | 0.99 | R | ||
| 677.3 | 0.98 | IR | ||
| 759.6 | 0.94 | IR | ||
| 801.3 | 0.96 | IR | ||
| 808.6 | 0.97 | IR | ||
| 830.8 | 0.91 | IR | ||
| 1216.4 | 0.96 | IR | ||
| 1223.8 | 0.92 | IR | ||
| 1294.8 | 0.99 | IR | ||
| 1297.0 | 0.98 | IR/R | ||
| 1367.0 | 0.99 | R | ||
| 1403.1 | 0.97 | IR/R | ||
| 1408.7 | 0.96 | IR | ||
| 1440.0 | 0.93 | IR/R | ||
| 1451.0 | 0.93 | IR | ||
| 1491.3 | 0.99 | IR | ||
| 1542.3 | 0.91 | R | ||
| 1549.9 | 0.93 | IR | ||
| 1599.0 | 0.98 | R | ||
| 1599.1 | 0.97 | R | ||
| 1607.8 | 0.95 | R | ||
| 1626.1 | 0.96 | R | ||
| 1626.1 | 0.96 | IR/R | ||
| 1647.8 | 0.97 | IR/R |
III.2 Intermolecular Interactions
In order to obtain a compact estimate of the loss of molecular character with pressure, we introduced two different quantities. These are plotted in Fig. 6.
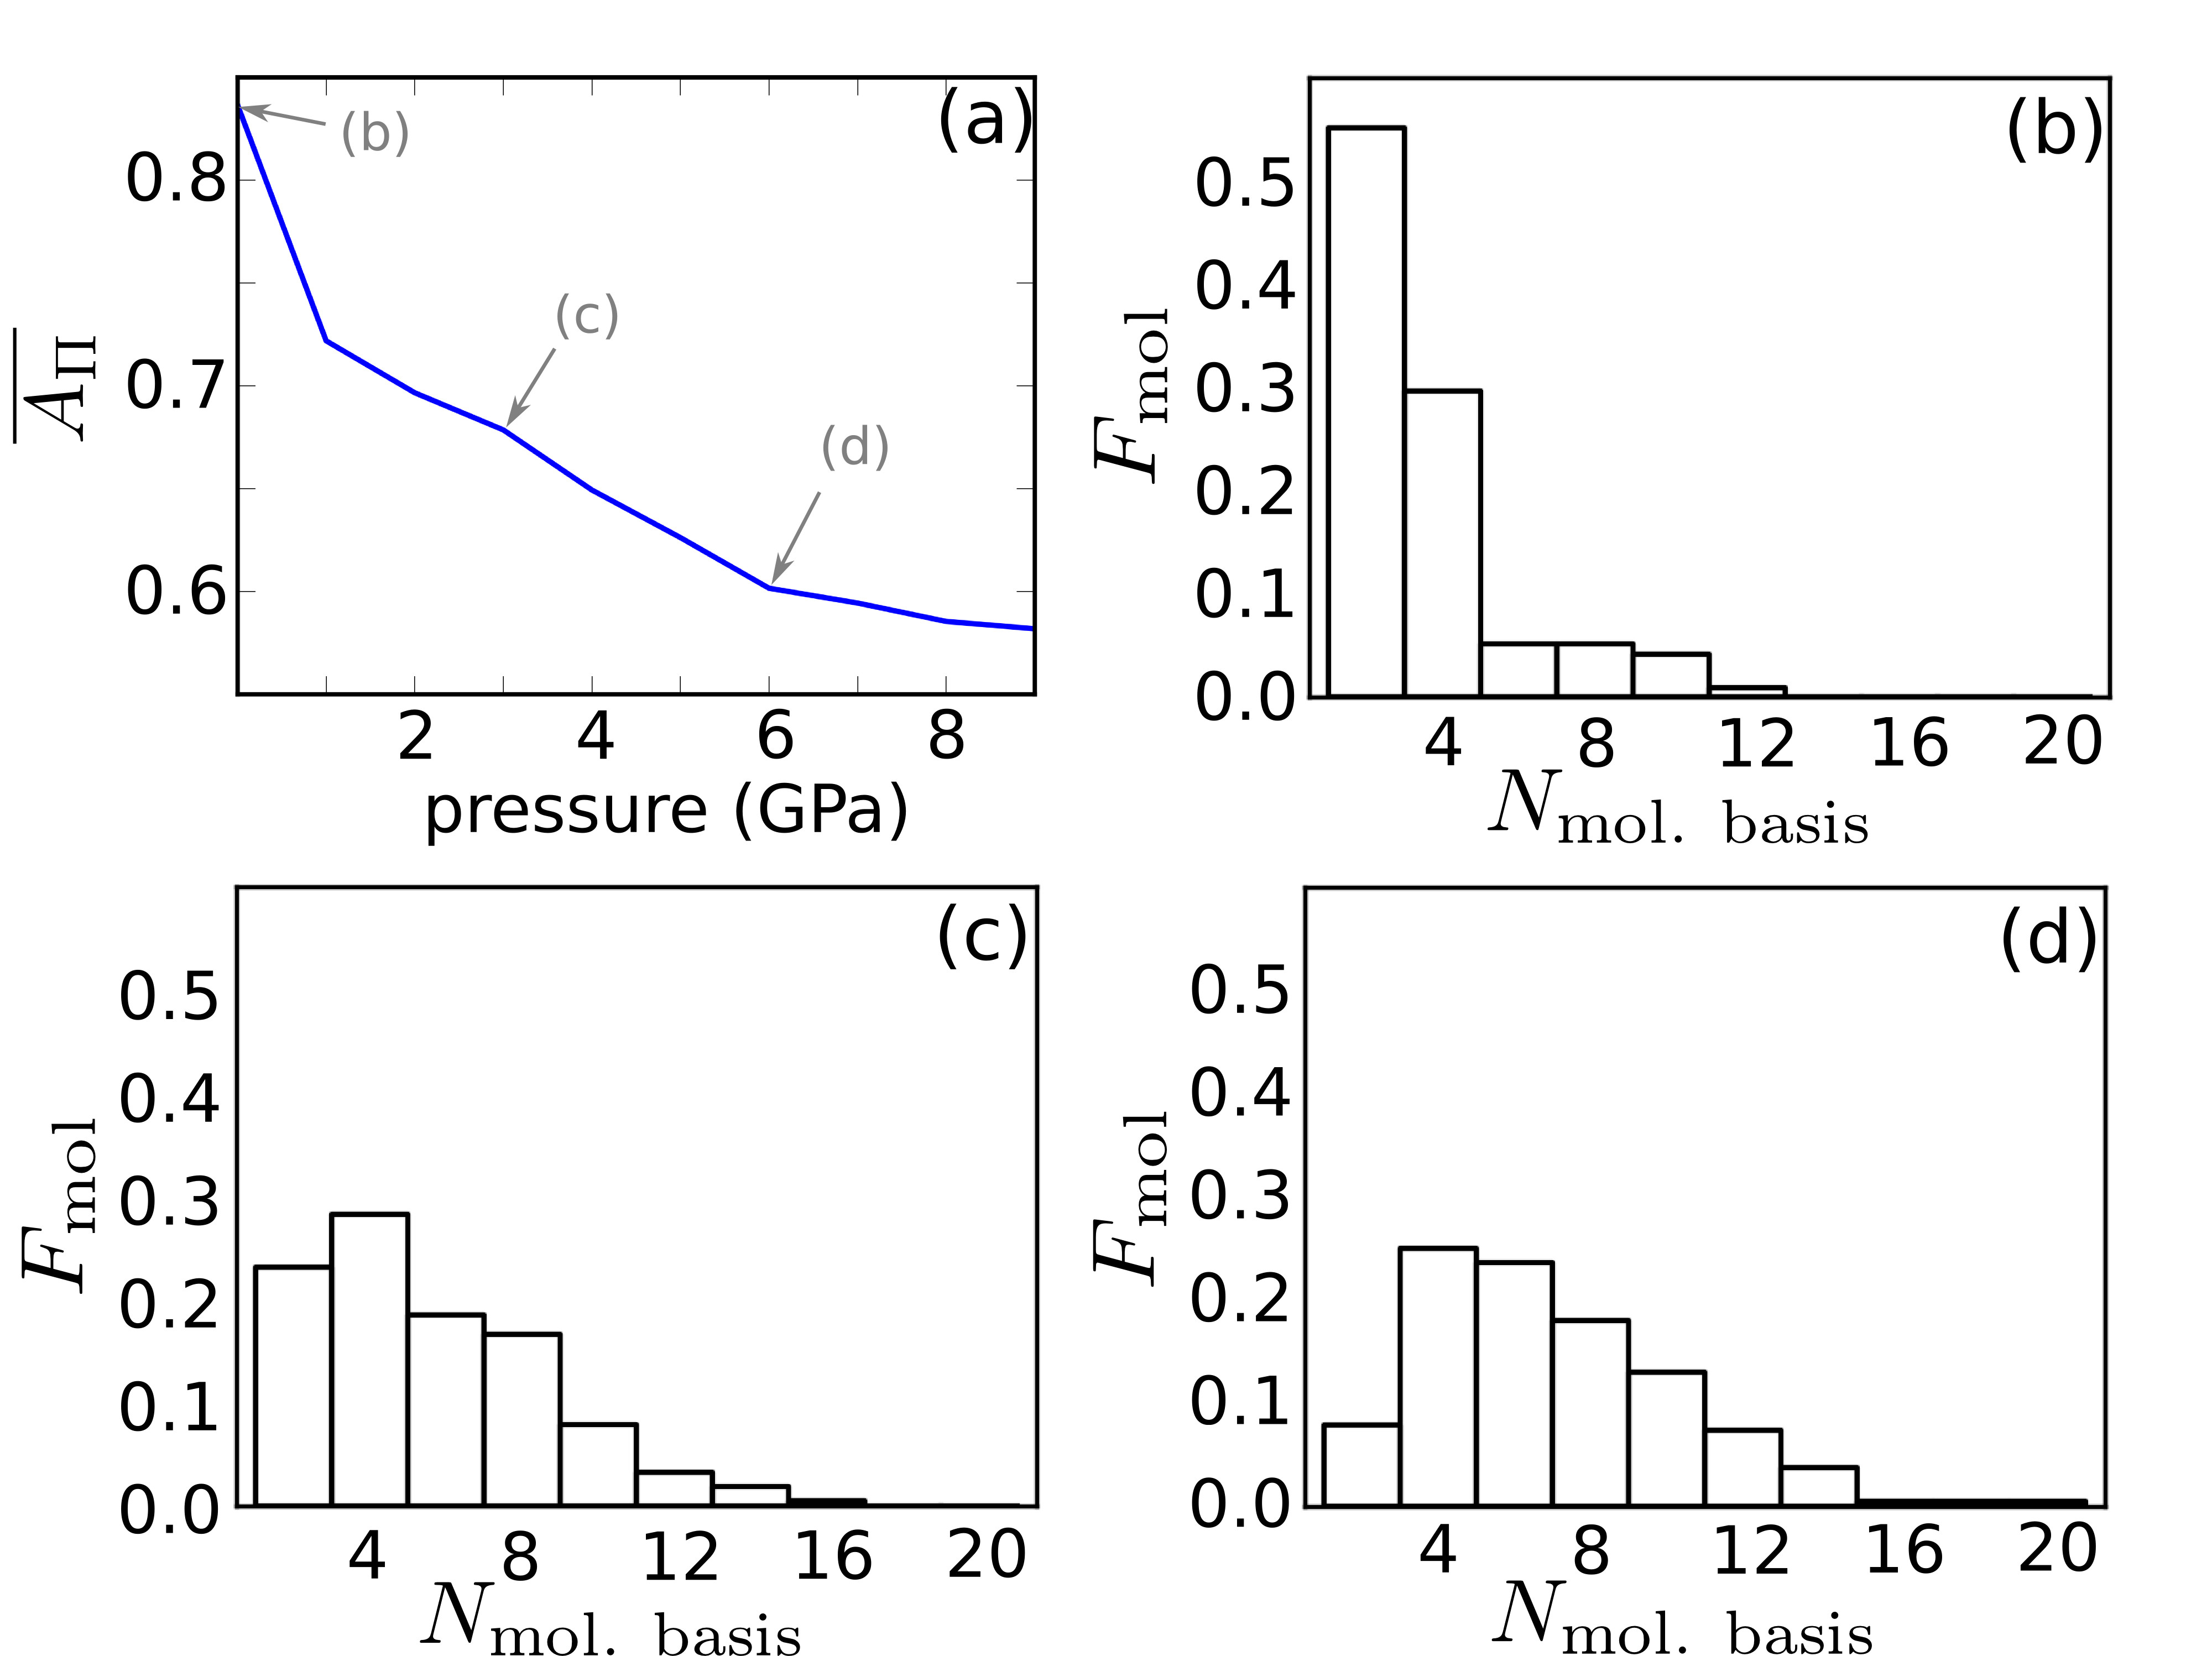
is the fraction of crystal phonon modes, whose eigenvectors can be represented as a superposition of molecular eigenstates with an accuracy of at least 90 . For a perfect molecular crystal, would comprise a single peak, with weight one, at . For GPa, the corresponding histograms are shown in the panels - of Fig. 6. For solid picene at zero pressure, =0.5 for , 0.3 for , and decays rapidly for increasing . Already at ambient conditions, only 50 of the crystal eigenmodes can be clearly assigned to a given simple product of molecular vibrations. This fraction rapidly decreases with pressure, whereas the weight of states with high increases.
A compact measure for the change of the character of phonons with pressure is given by , which is the average over the largest coefficients squared of the expansion of a single crystalline eigenmode in molecular vibrations (for a detailed definition see the Sect. IV.2). In case of a molecular crystal, this number is 1, i.e. all crystalline eigenmodes can be decomposed in a single product state of molecular vibration. In the crystalline limit, i.e. equally-distributed projections onto the molecular basis set, we would have in the case of picene: . For picene, vs. pressure is plotted in Fig. 6. At ambient pressure, it is still in the vicinity of a molecular crystal (). With increasing pressure, decreases, but at GPa it is still far from the crystalline limit (). In addition, we did a calculation at GPa, and found that even there, picene remains close to the molecular limit (). However, a simple picture of two largely independently vibrating molecules breaks down with increasing pressure. The loss of molecular character can invalidate simple vibrational models that are used to interpret phonon spectra and to evaluate the electron-phonon interaction in solid picene. Kato2011_ele-ph ; Sato2012_ele-ph Similar, but more pronounced effects have been discussed for K-doped solids. Casula2011_ele-ph
In the present case, even when there is no one-to-one correspondence to molecular eigenmodes, it is still possible to follow the evolution of crystalline modes with pressure, and define (generalised) Grüneisen parameters and Davydov splittings, as explained in Sect. IV.2. We have reported them in table 1.
III.3 The Raman peak at 1380 cm-1
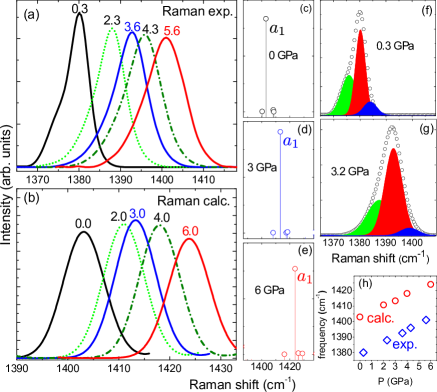
Here we discuss in detail the Raman peak with cm-1 (DFT frequency: 1403 cm-1) at ambient pressure. The peak frequency has been used in Refs. [5] and [21] as a marker for doping in . Moreover, according to Refs. [Casula2011_ele-ph, ; Subedi2011_ele-ph, ; Kato2011_ele-ph, ; Sato2012_ele-ph, ] this mode displays the highest coupling to electrons upon K intercalation.
Experimental and theoretical results, reported in Fig.7(a) and (b), clearly show that the spectral structure is dominated by the peak (see Fig.7(c)-(e)). The overall spectral shape, under compression, broadens but does not drastically change (see panels (f) and (g)). DFT calculations well reproduce this result (see Fig.7(b)) and also the pressure dependence of the peak frequency (see panel (h)). The most intense Raman line retains a well-defined molecular character () up to 6 GPa (the projection is 97 % at 0 GPa and 86 % at 5 GPa), and has a low-intensity Davydov partner (see Fig. 10).
Focusing on the remarkably strong frequency hardening of the central peak and exploiting both experimental and theoretical data, we find +23 cm-1 for a pressure variation of 5.2 GPa. The corresponding variation of the volume of the unit cell, from the DFT data in Fig. 3, is 100 Å3, which yields a Grüneisen parameter . This extremely low value is expected, due to the strongly harmonic character of this high frequency vibrational mode, and it is in good agreement with the values reported in the literature for similar modes in aromatic compoundsZhao_anthracene_1999 – Notice also the excellent agreement with the calculated value () reported in Table 1.
We can use the Grüneisen parameter to estimate the relative importance of structural and doping (charge transfer, electron-phonon coupling) effects in K-doped picene. Kambe et al. Kambe_2013 report for a negative shift of the frequency, with a 6 relative volume expansion – see Table 3 and section II for more details.
| Kambe_2013 | +6% | -5% | |
| picene at 5.2 GPa | -15% | +1.6% |
This corresponds to an effective Grüneisen parameter , which is much larger than the purely structural value . This is a strong indication that in K-doped samples factors other than structure, such as charge doping or electron-phonon coupling, determine the softening of the mode.
IV Details of Data Analysis
The analysis of the pressure evolution of the Raman and IR spectra of a system which comprises phonon modes, most of which are Raman and IR active, is a formidable task. Besides the obvious difficulty of assigning a large number of phonon peaks, which are often almost degenerate in energy, there is the additional complication that, with increasing pressure, the shape of the spectra changes not only because of the hardening or softening of the phonon modes, but also because of the changes in the relative optical cross sections, due to the rearrangement of the internal coordinates. When the number of optically active modes is large, these two effects are impossible to disentangle in the experimental spectra, and can lead to severe misinterpretation of the data. Therefore, using the information from the corresponding DFPT calculations, we can achieve a very detailed lineshape analysis of the measured spectra. We provide here one example of this analysis, relative to the IR spectra in the 400-480 cm-1 range. The appendix B contains additional examples of deconvolution of spectral structures, in particular Raman in the 570-790 cm-1 spectral range and IR in the 1390-1500 cm-1 range.
IV.1 Deconvolution of Complex Spectral Features
An example of deconvolution of complex spectral features is shown in Fig. 8, where the experimental IR spectra are compared with the linear response calculations over the 400-480 cm-1 frequency range.
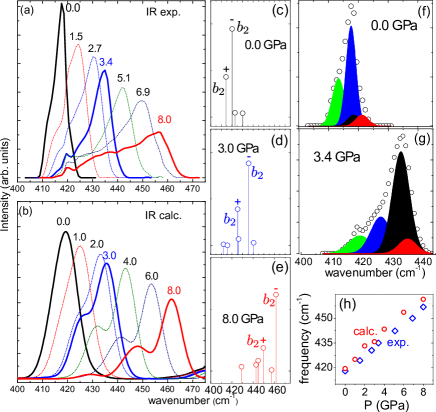
Experimental data are shown in panel (a); here, it appears that the band centered around 415 cm-1 at zero pressure evolves towards a broad and strongly asymmetric structure. The DFT calculations (see Fig. 8(b)) reproduce remarkably well the evolution of the experimental spectrum. At 0.0 GPa, the excellent agreement between calculated (Fig. 8(c)) and measured spectra (Fig. 8(f)) allowed us to resolve four different components, capturing both peak positions and intensities. At 3.4 GPa, a clear line broadening is observed (see Fig. 8(g)). Calculated spectra clearly show that the effect of pressure is to enhance a few peaks that have vanishingly small intensity at lower pressure. This is quite clear looking at Fig. 8(d) for GPa and even more in Fig. 8(e) for GPa. We can thus argue that the broadening of the spectra reflects the “appearance” of additional modes, which are hardly detectable at zero pressure. The pressure evolution of the most intense component, which has character at zero pressure, is shown in Fig. 8(h). The agreement between calculations and experiment is extremely good.
In Fig. 8(c) we can also notice that the two most intense peaks, indicated with and , form a Davydov pair. In general, the evolution of the splitting of the frequencies of a Davydov pair is a good measure for increasing intermolecular interactions in a crystal. Nevertheless, in this case, on increasing the pressure (see panels (d) and (e)) several modes acquire a finite spectral weight and cover the Davydov pair, thus making it impossible to disentagle the position of the Davydov pair without the information from ab-initio calculations. Possible alternative indicators of intermolecular interactions, which should be more suitable for large systems, have been discussed in the previous section.
IV.2 Symmetry Analysis of the Phonon Modes
At ambient pressure, the main features of the Raman and IR spectra of solid picene are captured by a simplified vibrational analysis. Kato2011_ele-ph ; Sato2012_ele-ph ; Girlando2012_IR_Ram_picene ; Kambe_2013 One essentially assumes that there is a one to two correspondence between the vibrational eigenvalues and eigenvectors ( and ; = ; =) of an isolated picene molecule, and the corresponding phonon frequencies and eigenvectors (, , =) in the solid. Each phonon in the crystal can be identified with one of the two modes, in which two molecules vibrate in or out-of-phase with each other, according to a given eigenvector . The small energy difference between the two modes (Davydov splitting) is often used as a measure for intermolecular interaction. Davydov
With increasing pressure, the vibrational picture breaks down, due to increased intermolecular interactions. Crystal eigenvectors do not project on a product of single molecular eigenvectors any more, but on a product of a linear combination of molecular eigenvectors:
In this formula, the molecular eigenvectors that form the basis set on each molecule are equal up to a rotation / translation: . The molecular limit corresponds to the choice: in Eq. (IV.2).
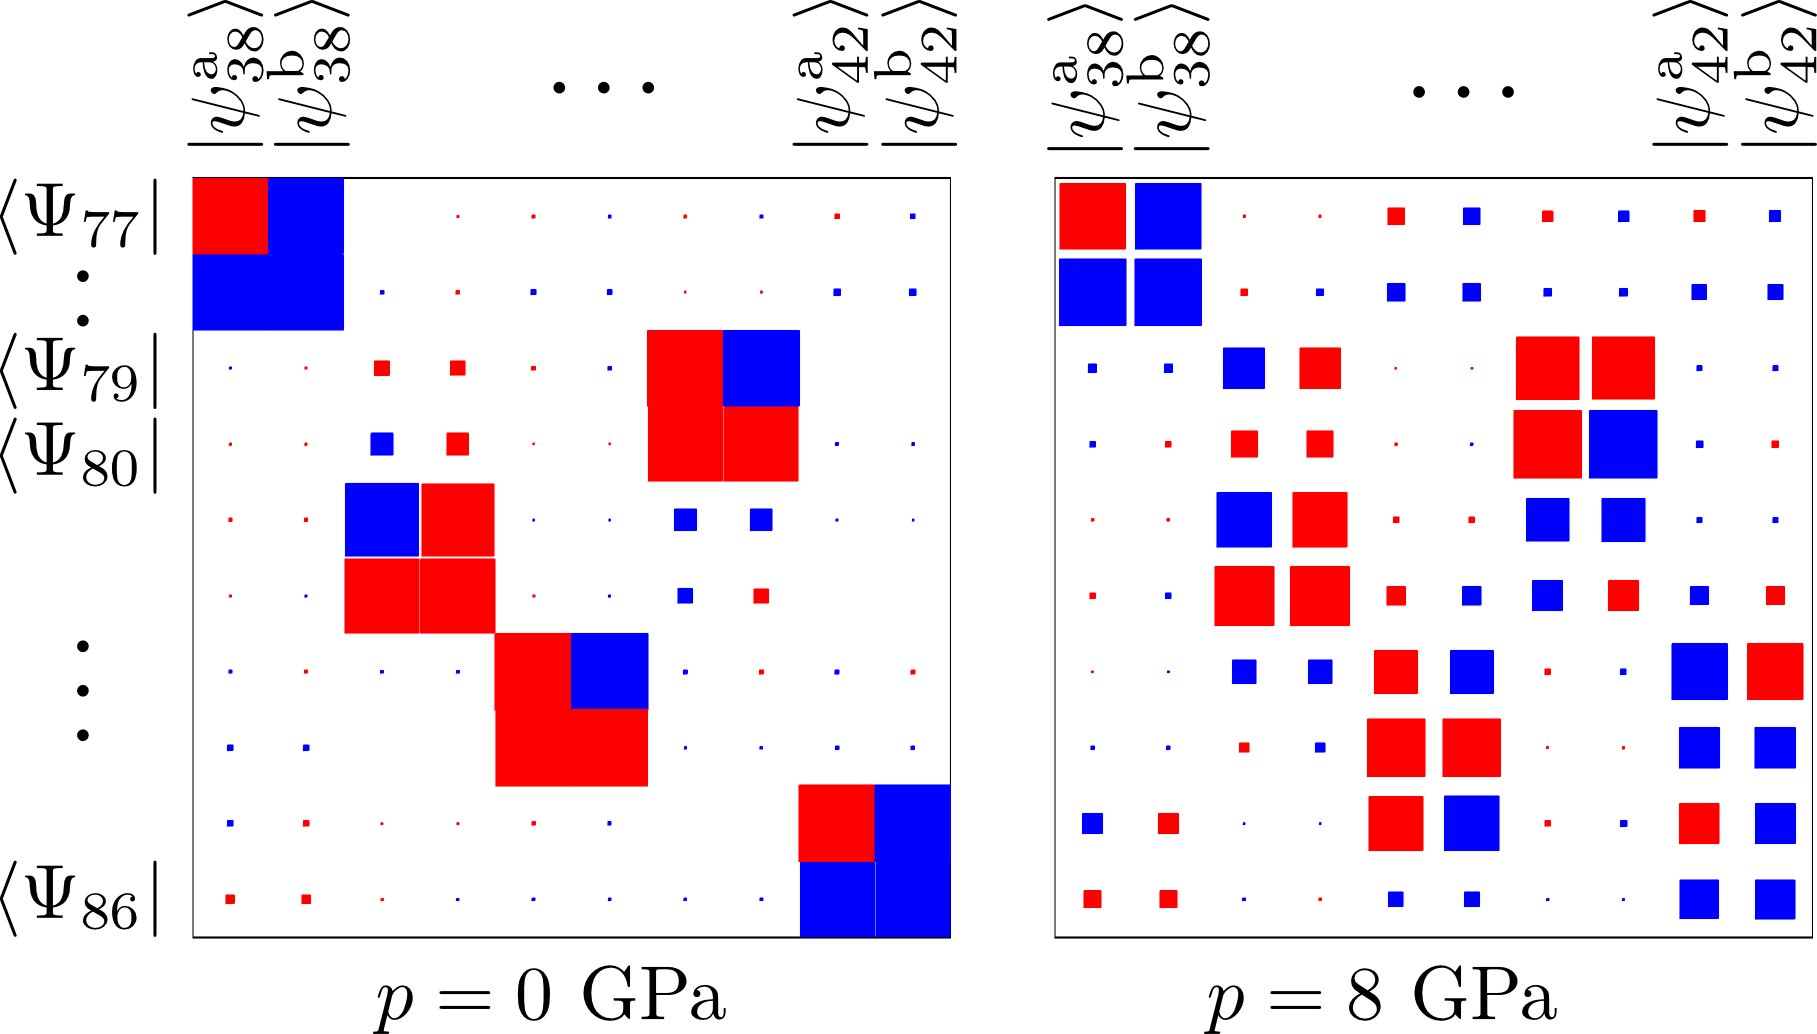
The loss of molecular character with pressure is illustrated in Fig. 9 using a Hinton diagram. The rows and columns of the matrix represent crystal and molecular eigenvectors – and . The size of the squares is proportional to the square of the scalar product between them: and . Red and blue indicate a positive or negative sign of the scalar product, respectively. At zero pressure, all the crystal modes in the figure can be associated to a single molecular vibration, in () or out-of-phase (). For example, the crystal mode is the vibration of two molecular vibrations, out-of-phase, while mode is the superposition of the same two eigenmodes, in-phase. The contribution of the other molecular eigenmodes is negligible. At GPa, the situation is not so clear-cut any more. is now a superposition of two molecular vibrations, with almost equal weight. This reflects a gradual loss of molecular character with pressure.
The average molecular projection that we used to quantify intermolecular interactions in Fig. 6, are defined in terms of these molecular projections :
The residual C2 symmetry enforces . Because we normalized all molecular vibrational states to 1, we get . This leads to the additional factor 1/2 in front of .
Being able to define the crystalline eigenvectors in terms of a finite number of molecular modes allows us to follow the evolution of specific modes under pressure. This information is used to define Grüneisen parameters and Davydov splittings. Since the molecular character decreases with pressure, this assignment depends very much on the size of the pressure interval between two DFT calculations, as well as on the threshold we choose to define two vectors similar.
In the following, two crystalline eigenstates , are considered as a Davydov pair (in and out-of-phase vibrations) if the absolute value of their projection onto the molecular eigenstates is similar (beyond a threshold ), and the sign of the projection over one of the two molecules is opposite for the two modes:
| (3) |
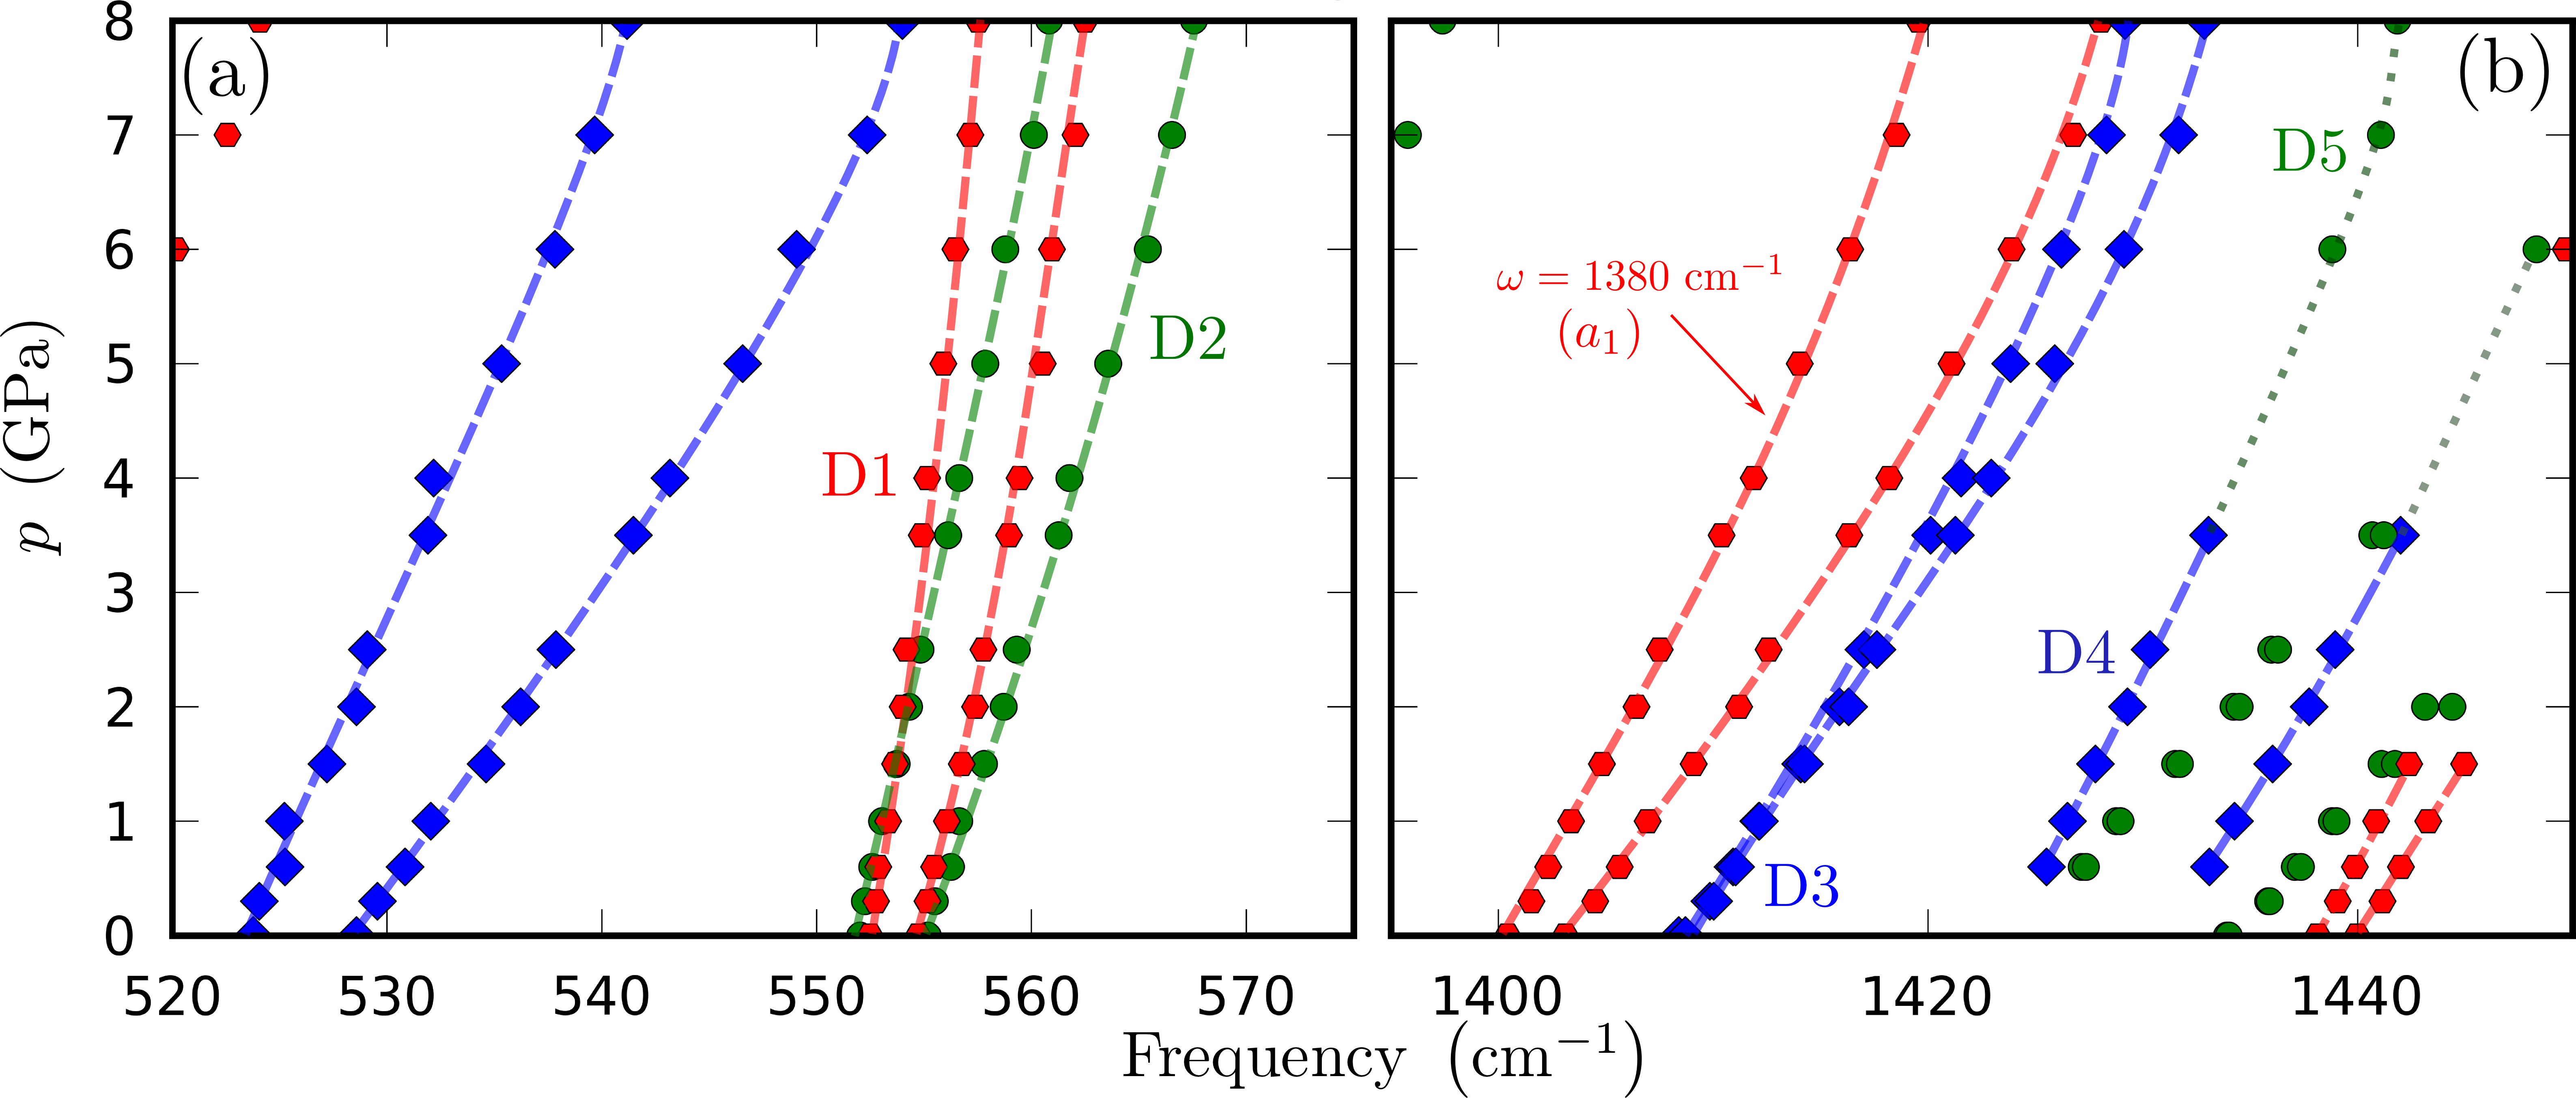
In the calculation, we fixed a threshold in eq. (3) and a threshold of 0.9 for the similarity between different pressures. Overall, we found approximately that 160/216 modes at zero pressure form a Davydov pair, indicating that the crystal has a substantial molecular character. In Fig. 10 we plot two different excerpts of the whole phonon spectrum over pressure. At zero pressure, the Davydov pair can be either degenerate (e.g. D3) or already split (e.g. D1). With pressure, the degenerate states split, and their energy differences increases. Some of the frequencies cross (e.g. D1 & D2), and some even change severely their character – in Fig. 10 () the pair D5 looks like the continuation for GPa of the pair labelled with D4.
V Conclusions
In conclusion, in this work we report a very detailed analysis of the vibrational spectra of crystalline picene (C22H14) under pressure, combining high-quality Raman and IR measurements and state-of-the-art first-principles calculations. In the pressure range we studied (0-8 GPa), DFT calculations reproduce remarkably well the experimental intensities and peak positions. This allowed us to disentangle even the finest details of the experimental spectra, in a system which has 216 phonon modes. This excellent agrement makes us confident to exploit also the structural results of DFT calculations. These show that in solid picene under pressure the two molecules in the monoclinic unit cell rotate, to reduce the intermolecular distances. Bending of the molecules and intramolecular compression are much smaller effects.
At zero pressure, most phonons of solid picene have a predominant molecular character; with pressure, due to the increasing intermolecular interaction, many of them acquire a more crystalline character, i.e. they project over more than one molecular eigenmode. This causes an increased complexity of the measured spectra, since more modes acquire a finite IR or Raman cross-section, due to the relaxation of selection rules. This evolution is smooth and, even at the highest pressure, picene is still far from the crystalline limit. Following the projections on molecular eigenmodes, it is therefore possible to trace the pressure evolution of individual phonons in the experimental spectra, and to resolve effects which would be otherwise impossible to observe, such as the Davydov splitting of the lines. We found that all phonons display a smooth hardening under pressure, with Grüneisen parameters of the order of 0.1.
The level of detail of our analysis is to our knowledge unprecedented so far, and can help to resolve several controversies on phonon spectra, electron-phonon coupling and structural effects in K doped picene. Casula2011_ele-ph ; Subedi2011_ele-ph ; Kato2011_ele-ph ; Sato2012_ele-ph ; Mitsuhash2010 ; Mitamura2011_perpestive-picene ; Kambe_2013
For example, on the basis of the calculated Grüneisen parameters, we exclude that K doping leads to a compression of the unit cell, as reported by Ref. [Mitamura2011_perpestive-picene, ], but rather to an expansion Kambe_2013 . The Grüneisen parameter of the Raman line at 1380 cm-1, used as a spectroscopic marker for electronic transfer in K doped picene, is =0.1 for pressure and =0.8 for K doping. Kambe_2013 . This large difference is a clear signature that doping and pressure have distinct effects on the frequency of this vibrational mode. Therefore, in K doped samples, the observed frequency softening cannot be ascribed just to structural effects, but most likely to a strong coupling to electronic degrees of freedom as well.
Appendix A Methods
Experimental methods
Solid picene was prepared by a new optimized synthesis route which permits us to obtain bulk quantities of pure polycrystalline picene powder. Malavasi2011_picene-prep Samples have been fully characterized by X-ray diffraction and ambient pressure Raman and IR spectroscopy in a previous paper. JPCM2012_IR_Ram_picene A screw clamped opposing-plate diamond-anvil cell (DAC) equipped with 700 m culet II-A diamonds was used to pressurize the samples. The gaskets were made of a 250 m thick molibdenum foil with a sample chamber of 150 m diameter and 40-60 m height under working conditions. For the IR measurements CsI was used as pressure transmitting medium. High pressure Raman measurements were carried out with and without pressure transmitting medium (NaCl) obtaining actually identical results. During both Raman and IR measurements, pressure was measured in-situ exploiting the standard ruby fluorescence technique. Mao1978_Ruby Further experimental details are reported in Ref. [43].
High-pressure IR transmittance data of the picene samples in the DAC were collected at room-temperature exploiting the high brilliance of SISSI beamline of the ELETTRA synchrotron (Trieste, Italy). Lupi2007_SISSI The incident (transmitted) radiation was focused (collected) by a cassegrain-based Hyperion 2000 IR microscope equipped with a mercury cadmium telluride (MCT) detector for the mid IR range and a He bolometer for the far IR range, both coupled to a Bruker Vertex 70v interferometer which allows us to explore the 400-6000 cm-1 spectral range. For the present study, we concentrate on the IR-vibrational modes in the 400-1700 cm-1 spectral range. A thin sample slab obtained by pressing finely milled sample powder between the diamond anvils has been placed on top of a presintered CsI pellet in the DAC gasket hole, thus allowing a clean sample-diamond interface. Sacchetti2006_DAC The slits of the microscope were carefully adjusted to collect only transmitted light from the picene pellet. Their configuration was fixed for all the experiment.
Two different instruments with different excitation lines have been used for Raman measurements owing to the presence of an unexpected strongly pressure dependent fluorescence emission. As a matter of fact, using the nm excitation line the fluorescence signal prevented the collection of data above 3 GPa. For this reason we repeated the Raman measurements using a different apparatus with a nm laser which allowed to measure a good Raman signal up to about 6 GPa. Preliminary experimental studies show that the large fluorescence signal of picene can be ascribed to a two photon process Citroni2013 ; Fanetti2013_HP and that its dependence upon volume compression can be associated to a pressure induced narrowing of the band gap. This is an important point and further experimental and theoretical investigations are in progress.
The two different confocal-microscope Raman spectrometers were a LabRam Infinity by Jobin Yvon at the Department of Physics of the Sapienza University of Rome and a Raman Senterra by Bruker Optics at Porto Conte Ricerche laboratory (Alghero, Italy). The former was equipped with a He-Ne laser ( nm) and a 1800 lines-mm-1 grating monochromator whereas the latter was equipped with a diode laser ( nm) and a 1200 lines-mm-1 grating monochromator. In both cases Raman measurements were carried out on powder samples in the backscattering geometry with a spectral resolution better than 3 cm-1. A notch filter was used to reject the elastic contribution and a charge-coupled-device (CCD) to collect the spectrum of the scattered radiaton. Using a few micron-sized laser spot on the sample, accurate Raman spectra were collected.
Computational methods
We calculated the Raman and IR spectra of picene in its crystalline form as a function of pressure using Density Functional Perturbation Theory (DFPT) Baroni2001_DFPT ; Lazzeri2003_Raman_DFT , as implemented in the quantum-espresso packageqe employing LDA norm-conserving pseudopotentials psps . The plane-wave cutoff energy was set to 100 Ry for all calculations. For the self-consistent calculations, a uniform grid was used for -space integration. We checked the choice of the cutoff by performing calculations under pressure keeping the number of plane waves constant by increasing/decreasing the cutoff according to .
For selected pressures, we calculated the Raman and IR spectra. These were then decomposed through a detailed symmetry analysis that employs projections of the phonon eigenvectors ( ) on the molecular ones (). As the lattice structure and the atomic positions are changing with applied pressure, we mapped the two C22H14 molecules of the crystal unit cell separately onto the molecular calculation using rotations and translations.
Appendix B Analysis and discussion of selected spectral ranges
To illustrate the line-shape analysis of our data, we have selected two spectral ranges (one for Raman and one for IR) where, exploiting theoretical information, it is possible to perform a deeper and accurate analysis of the spectral structures evolving under pressure. Note that we already presented in the main text the detailed analysis performed in two cases, namely the 1380 cm-1 Raman peak and the IR 400-480 cm-1 spectral range.
Raman: 570-790 cm-1 spectral range
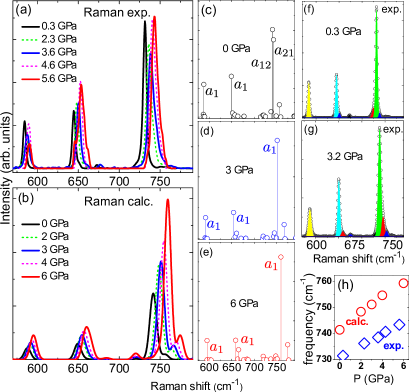
Experimental and theoretical Raman spectra within the 570-790 cm-1 frequency range are shown in Fig. 11 at selected pressures. The experimental data (panel (a)) and DFT calculations (panel (b)) show three well isolated spectral structures formed by several components. The spectrum in (b) is obtained from the DFT cross-sections (shown at three selected pressures in panels (c)-(e)) with a convolution of a Lorentzian function to mimic the experimental broadening. The experimental/theoretical comparison demonstrates the excellent level of the agreement: DFT not only captures the main features of the experimental spectra, but also reproduces the observed pressure evolution of the spectral shape, including several minor peaks. This can be better understood looking at the spectral lines around 650 and 730 cm-1, where only one component can be observed at ambient pressure (see panels (c) and (f) of Fig. 11). Exploiting the calculated spectra in Fig. 11(d) it is possible to assign pressure-induced lineshape modifications (see Fig. 11(g)) to low intesity peaks with a strong pressure dependence. These indeed cannot be resolved at low pressure, but on volume compression they clearly emerge as shoulders of the main peaks. We notice that the experimental pressure dependence of the central frequency of the most intense peak is in good agreement with the calculated one, apart from a constant offset of cm-1 (see Fig. 11(h)).
Infrared: 1390-1500 cm-1 spectral range
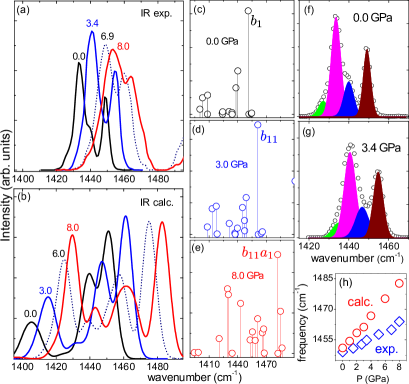
The pressure evolution of the IR band around 1440 cm-1 is shown in Fig. 12. A huge number of vibrational modes do contribute to the band and a one to one identification between observed and calculated lines is therefore quite difficult. Once again, the reliability of our DFT calculations allowed us to deconvolve the zero pressure spectrum with four main components (see Fig. 12(c) and (f)). The remarkable broadening observed on increasing pressure (see Fig. 12(g) for data at 3.4 GPa) can be ascribed to usual lattice compressione effects. However, present calculated data indicate that a significant contribution is also due to the pressure driven enhancement of several low intensity modes (compare panels (c), (d), and (e)). It is worth to notice that, even with the best available spectral resolution, it is impossible to resolve such a large number of almost degenerate modes, as can be seen in Fig. 12(d). A limit of the analisys is shown in Fig. 12(h), where a different pressure evolution of the frequency of the most intense calculated mode and the corresponding fourth component in the measured spectrum can be observed. This may indicate that, at variance with the other above mentioned cases, it is difficult to establish a one to one correspondence between calculated and measured peaks in this energy range.
References
- (1) R. Mitsuhashi, Y. Suzuki, Y. Yamanari, H. Mitamura, T. Kambe, N. Ikeda, H. Okamoto, A. Fujiwara, M. Yamaji, N. Kawasaki, Y. Maniwa, and Y. Kubozono, Nature (London) 464, 76 (2010).
- (2) X. F. Wang, R. H. Liu, Z. Gui, Y. L. Xie, Y. J. Yan, J. J. Ying, X. G. Luo, and X. H. Chen, Nat. Commun. 2, 507 (2011).
- (3) X. F. Wang, Y. J. Yan, Z. Gui, R. H. Liu, J. J. Ying, X. G. Luo, and X. H. Chen, Phys. Rev. B 84, 214523 (2011).
- (4) X. F. Wang, X. G. Luo, J. J. Ying, Z. J. Xiang, S. L. Zhang, R. R. Zhang, Y. H. Zhang, Y. J. Yan, A. F. Wang, P. Cheng, G. J. Ye, X. H. Chen, J. Phys.: Condens. Matter 24, 345701 (2012).
- (5) H. Mitamura, X. Lee, X. He, Y. Yamanari, Y. Takahashi, Y. Suzuki, Y. Kaji, R. Eguchi, K. Akaike, T. Kambe, et al., Phys. Chem. Chem. Phys. 13, 16476 (2011).
- (6) M. Xue, T. Cao, D. Wang, Y. Wu, H. Yang, X. Dong, J. He, F. Li, and G. F. Chen, Sci. Rep. 2, 389 (2012).
- (7) G. Giovannetti and M. Capone, Phys. Rev. B 83, 134508 (2011).
- (8) M. Kim, B. I. Min, G. Lee, H. J. Kwon, Y. M. Rhee, and J. H. Shim, Phys. Rev. B 83, 214510 (2011).
- (9) A. Ruff, Michael Sing, R. Claessen, H. Lee, M. Tomić, H. O. Jeschke, R. Valenti, Phys. Rev. Lett 110, 216403 (2013).
- (10) Y. Nomura, K. Nakamura, and R. Arita Phys. Rev. B 85, 155452 (2012).
- (11) M. Kim, B. I. Min, H. C. Choi, J. H. Shim, arXiv:1304.1613 [cond-mat.str-el] (unpublished).
- (12) A. Subedi and L. Boeri, Phys. Rev. B 84, 020508 (2011).
- (13) M. Casula, M. Calandra, G. Profeta, and F. Mauri, Phys. Rev. Lett. 107, 137006 (2011); M. Casula, M. Calandra, and F. Mauri, Phys. Rev. B 86, 075445 (2012).
- (14) T. Kato, T. Kambe, and Y. Kubozono, Phys. Rev. Lett. 107, 077001 (2011).
- (15) T. Sato, N. Iwahara, and K. Tanaka, Phys. Rev. B 85, 161102 (2012).
- (16) M. Capone, M. Fabrizio, C. Castellani, and E. Tosatti, Rev. Mod. Phys. 81, 943 (2009).
- (17) O. Gunnarsson, Alkali-Doped Fullerides (World Scientific, Singapore, 2004).
- (18) H. Okamoto, N. Kawasaki, Y. Kaji, Y. Kubozono, A. Fujiwara, and M. Yamaji, J. Am. Chem. Soc. 130, 10470 (2008).
- (19) B. Joseph, L. Boeri, L. Malavasi, F. Capitani, G. A. Artioli, S. Protti, M. Fagnoni, A. Albini, C. Marini, L. Baldassarre, A. Perucchi, S. Lupi, P. Postorino, P. Dore, J. Phys.: Condens. Matter 24, 252203 (2012).
- (20) A. Girlando, M. Masino, I. Bilotti, A. Brillante, R.G. Della Valle, and E. Venuti, Phys. Chem. Chem. Phys., 14, 1694 (2012).
- (21) T. Kambe, X. He, Y. Takahashi, Y. Yamanari, K. Teranishi, H. Mitamura, S. Shibasaki, K. Tomita, R. Eguchi, H. Goto, Y. Takabayashi, T. Kato, A. Fujiwara, T. Kariyado, H. Aoki and Y. Kubozono, Phys. Rev. B 86, 214507 (2012).
- (22) S. Fanetti, M. Citroni, R. Bini, L. Malavasi, G.A. Artioli and P. Postorino, J. Chem. Phys. 137, 224506 (2012).
- (23) S. Fanetti, M. Citroni, L. Malavasi, G.A. Artioli, P. Postorino and R. Bini, J. Phys. Chem. C 117, 5343 (2013).
- (24) P. Cudazzo, M. Gatti, F. Roth, B. Mahns, M. Knupfer, A. Rubio, Phys. Rev. B 84, 155118 (2011).
- (25) Q. Xin, S. Duhm, F. Bussolotti, K. Akaike, Y. Kubozono, H. Aoki, T. Kosugi, S. Kera, N. Ueno, Phys. Rev. Lett. 108, 226401 (2012).
- (26) S. Baroni, S. de Gironcoli, A. Dal Corso, and P. Giannozzi, Rev. Mod. Phys. 73, 515 (2001).
- (27) L. Malavasi (private communication).
- (28) S. Lupi, A. Nucara, A. Perucchi, P. Calvani, M. Ortolani, L. Quaroni, and M. Kiskinova, J. Opt. Soc. Am. B 24, 959 (2007).
- (29) M. Lazzeri and F. Mauri, Phys. Rev. Lett. 90, 036401 (2003).
- (30) All calculations are performed using the Quantum ESPRESSO code: P. Giannozzi et al., J. Phys.: Condens. Matter 21, 395502 (2009).
- (31) We used the pseudopotentials C.pz-vbc.UPF and H.pz-vbc.UPF from http://www.quantum-espresso.org.
- (32) http://www.webqc.org/printable-symmetrypointgroup-ct-c2v.html
- (33) The modes with at least 15% of the peak cross section and their Davydov partner, if it exists, have been taken.
- (34) A.S. Davydov, Theory of Molecular Excitons (McGraw-Hill, New York, 1962).
- (35) P. Postorino, A. Congeduti, E. Degiorgi, J.P. Itié, and P. Munsch, Phys. Rev. B 65, 224102 (2002).
- (36) Masayuki Hasegawa, Kazume Nishidate and Hiroshi Iyetomi, Phys. Rev. B 76, 115424 (2007)
- (37) F. Ortmann, F. Bechstedt and W. G. Schmidt, Phys. Rev. B 73, 205101 (2006)
- (38) N. Mounet and N. Marzari, Phys. Rev. B 71, 205214
- (39) Notice that although the equilibrium volume is considerably smaller than the experimental value, due to LDA overbinding, the values of the energy derivatives are much less affected by this approximation. The same is true for the phonon frequencies, which are typically off from experiment. To improve the equilibrium volume, one could correct the exchange and correlation potential in order to obtain the asymptotic behavior of the vdW potential (J. Antony and S. Grimme, Phys. Chem. Chem. Phys. Vol. 8 (45), 5287-5293 (2006); V. Barone et al., J. Comp. Chem. 30, 934 (2009)) – which is an effective long range correction. However, for typical interatomic distances, the LDA and the vdW corrected LDA potential have a similar shape, and thus LDA vibrational properties and elastic constants are close to their experimental values.
- (40) Q.W. Huang, J. Zhang, A. Berlie, Z.X. Qin, X.M. Zhao, J.B. Zhang, L.Y. Tang, J. Liu, C. Zhang, G.H. Zhong, H.Q. Lin, X.J. Chen, arXiv:1303.1572 [cond-mat.supr-con] (unpublished).
- (41) L. Zhao, B. J. Baer and E. L. Chronister, J. Phys. Chem. A 103, 1728 (1999).
- (42) H. K. Mao, P. M. Bell, J. W. Shaner and D. J. Steinberg, J. of Appl. Phys. 49, 3276 (1978).
- (43) C. Marini, D. Chermisi, M. Lavagnini, D. Di Castro, C. Petrillo, L. Degiorgi, S. Scandolo, and P. Postorino, Phys. Rev. B 86, 064103 (2012).
- (44) A. Sacchetti, M. Cestelli Guidi, E. Arcangeletti, A. Nucara, P. Calvani, M. Piccinini, A. Marcelli, and P. Postorino, Phys. Rev. Lett. 96, 035503 (2006).