Optimization for Mass Hierarchy
Abstract
The oscillation frequency for reactor neutrinos differs by 6.4% between normal and inverted mass hierarchy. This frequency difference accumulates to a phase difference over distance and time. The optimal distance is when the maximum phase difference between hierarchies occurs near the peak in the observable reactor neutrino spectrum.
Recent developments in neutrino mixing include measurement of DC ; DBRENO and refinement of parameters Minos . Outstanding questions include the mass hierarchy, the CP violating phase , sterile neutrinos,
the Majorana nature of neutrino mass and the overall neutrino mass scale. Experiments are underway to better understand these questions.

The measurement of has done a great deal to permit the field to expand quickly. Plans to measure the mass hierarchy frequently involve ambiguities with . Given the unexpectedly large value for it is worth reconsidering strategies to determine the mass hierarchy.
The transition probability to find a neutrino of type after a time when starting with a neutrino of type in vacuum is given by PDG2012 :
Where are elements of the complex PMNS matrix, the are the square of the masses of the ’th neutrino mass eigenstate and . disappearance experiments to measure the mass hierarchy have an advantage that the measurement is independent of CP violating phases so those ambiguities can be avoided.
In the case of an electron antineutrino disappearance experiment this can be written as Learned :
| (1) | |||
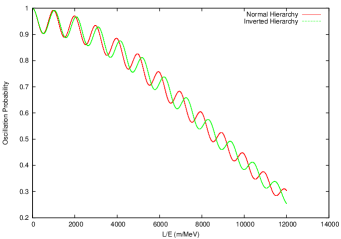
where . Since and the high frequency oscillation is dominated by . The L/E plot shows (figure 1) a low amplitude high frequency oscillation at added to a high amplitude low frequency oscillation at .
A popular method to determine the mass hierarchy Learned ; Wang is to position a large reactor antineutrino detector near the solar neutrino oscillation () minimum and to look at ripples in the spectrum caused by oscillations. The combination of large distances and the oscillation minimum leads to very low rates, resulting in the need for a very large detector and long exposure times. The oscillation frequency, the ripple spacing, also makes serious demands on the detector resolution, on the order of 3% to resolve the ripples in the spectrum.
The portion of the transition probability sensitive to the mass hierarchy can be isolated from equation 1.
Now so . This gives:
The mass hierarchy is the sign of . The only term in odd in is . The difference between normal and inverted hierarchy (figure 2) is:
The maximum size of this difference is . Since the oscillation is fairly slow this maximum difference can be found near . The smallest value maximizing it is . For eV2 this suggests an optimal L/E near 8200 m/MeV, figure 2.
The largest observable difference between the two mass hierarchies occurs when the two predictions are 180 degrees out of phase.
The two oscillation frequencies for the two possible mass hierarchies differ by about 6.4% so the optimal phase difference would first occur at about 7.8 oscillations.
Which gives =15.6, L/E=8200 m/MeV.
The extrema of are the solutions to the equation
A numerical search (figure 2) gives the L/E to the first global maximum at L/E=8418. The smallest L/E which is over 90% of this maximum separation is at L/E=5861.
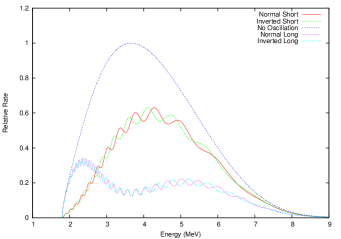
The flux times cross section for a typical DC2nd reactor neutrino spectrum peaks at about 3.66 MeV. A neutrino propagation length of about 30 km would provide optimal conditions in the vicinity of this peak. The actual shape of the spectrum is fuel dependent and depends on reactor burnup so precise optimization is not possible. But the broad nature of the peak means that operating near the peak should be sufficient. This paper uses the fuel mix and cross section of the Double Chooz publication DC2nd as typical.
Figure 3 illustrates the effect of oscillations on a reactor neutrino spectrum at two possible distances from the neutrino source. Both the normal and inverted hierarchy are shown for each distance. At the optimal distance the oscillation peaks and valleys are near the opposite feature for the other hierarchy.
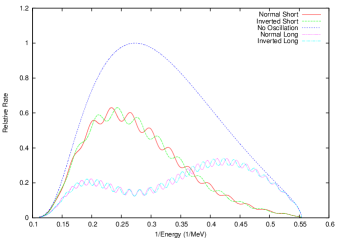
In addition to the much higher event rate occurring away from the oscillation minimum and closer to the source, a shorter distance relaxes constraints on the needed energy resolution. Ripples in the distribution occur with a frequency of MeV, where L is the source to detector distance. Smaller L gives better separation between the normal and inverted hierarchy peak positions. This is illustrated in figure 4.
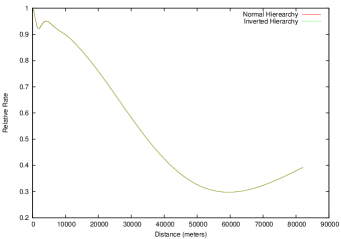
A shorter baseline for reactor neutrino experiments resolving the neutrino mass hierarchy problem provides higher event rates and better energy separation than running at the solar oscillation () minimum. In addition to the higher neutrino flux coming from the event rate is higher due to the smaller effect of the solar () oscillations, as illustrated in figure 5. The increase in rate due to oscillations is about a factor of 2.
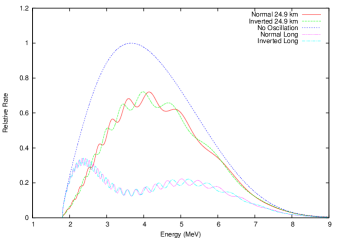
The reactor neutrino flux times cross section is about 90% of the peak value at about 3.04 MeV. A baseline of 24.9 km would give a 180 degree phase difference between the mass hierarchies at this energy. This is illustrated in figure 6. While not optimal such a baseline would still provide good separation between the two possible hypotheses. The oscillation enhancement is a factor of 2.3 at this location. Optimizing at 3.66 MeV gives a factor of 2 in energy between the threshold and the peak and a factor of 2.5 from the peak to the endpoint. The broad nature of the modulation (figure 2) indicates that most of the observable spectrum would be sensitive to the mass hierarchy.
Since the neutrino mass parameters are only approximately known the estimate given here is not precise. But given the factor of 5 in the accessible neutrino energy range the position optimization described here should be adequate to get the optimal L/E very near the peak in the spectrum. The value of in Fogli et al. Minos has been used for our value of . Fogli et al. has . Most measurements of come from muon neutrino disappearance experiments Minos2008 .
Systematic errors on may be problematic. Since the experiment can not measure the normal and inverted mass hierarchy and compare them, comparison must be made to distributions based on an assumed value of and a mass hierarchy.
I would like to thank Yifang Wang for useful discussions concerning the Daya Bay II experiment. I would like to thank Jamie Dawson and Didier Kryn for useful comments on the manuscript. This work was supported in part by the Commission franco-américaine.
After posting the first draft of this note I became aware of some recent work on this question Recent . I would like to thank J. Evslin for correspondence concerning the mass ambiguity.
References
- (1) Y. Abe et al. [Double Chooz Collaboration], “Indication for the disappearance of reactor electron antineutrinos in the Double Chooz experiment,” Phys. Rev. Lett. 108, 131801 (2012) [arXiv:1112.6353 [hep-ex]].
-
(2)
F. P. An et al. [Daya-Bay Collaboration],
“Observation of electron-antineutrino disappearance at Daya Bay,”
Phys. Rev. Lett. 108, 171803 (2012)
[arXiv:1203.1669 [hep-ex]].
J. K. Ahn et al. [RENO Collaboration], “Observation of Reactor Electron Antineutrino Disappearance in the RENO Experiment,” Phys. Rev. Lett. 108, 191802 (2012) [arXiv:1204.0626 [hep-ex]]. - (3) G.L. Fogli et al. Phys. Rev. D 86, 013012 (2012) “Global analysis of neutrino masses, mixings and phases: entering the era of leptonic CP violation searches” arXiv:1205.5254v3 (2012).
- (4) Particle Data Group, (J. Beringer et al.), Phys. Rev. D 86, 010001 (2012).
- (5) J. Learned, S. Dye, S. Pakvasa and R. Svoboda, Phys. Rev. D 78, 071302 (2008).
-
(6)
Yu-Feng Li, Jun Cao, Yifang Wang, Liang Zhan
“Unambiguous Determination of the Neutrino Mass Hierarchy Using Reactor Neutrinos”
[arXiv:1303.6733 [hep-ex]].
L. Zhan, Y. Wang, J. Cao and L. Wen, Phys. Rev. D 78, 111103 (2008).
L. Zhan, Y. Wang, J. Cao and L. Wen, Phys. Rev. D 79, 073007 (2009). - (7) Y. Abe et al. Phys. Rev. D, 86, 052008 (2012).
-
(8)
P. Adamson et al. “Measurement of neutrino oscillations with the MINOS
detectors in the NuMI beam” Phys. Rev. Lett. 101 131802 (2008)
arXiv:0806.2237.
P. Adamson et al. “Measurement of the neutrino mass splitting and flavor mixing by MINOS” Phys. Rev. Lett. 106 181801 (2011) arXiv:1103.0340.
This last reference has eV2 -
(9)
Emilio Ciuffoli, Jarah Evslin and Xinmin Zhang
arXiv:1208.1991 and arXiv:1305.5150
Shao-Feng Ge, Kaoru Hagiwara, Naotoshi Okamura and Yoshitaro Takaesu arXiv:1210.8141