Proposal for a scheme to generate 10 TW-level femtosecond x-ray pulses for imaging single protein molecules at the European XFEL
Abstract
Single biomolecular imaging using XFEL radiation is an emerging method for protein structure determination using the ”diffraction before destruction” method at near atomic resolution. Crucial parameters for such bio-imaging experiments are photon energy range, peak power, pulse duration, and transverse coherence. The largest diffraction signals are achieved at the longest wavelength that supports a given resolution, which should be better than nm. We propose a configuration which combines self-seeding and undulator tapering techniques with the emittance-spoiler method in order to increase the XFEL output peak power and to shorten the pulse duration up to a level sufficient for performing bio-imaging of single protein molecules at the optimal photon energy range, i.e. around 4 keV. Experiments at the LCLS confirmed the feasibility of these three new techniques. Based on start-to-end simulations we demonstrate that self-seeding, combined with undulator tapering, allows one to achieve up to a 100- fold increase in a peak-power. A slotted foil in the last bunch compressor is added for x-ray pulse duration control. Simulations indicate that one can achieve diffraction to the desired resolution with 50 mJ (corresponding to photons) per 10 fs pulse at 3.5 keV photon energy in a 100 nm focus. This result is exemplified using the photosystem I membrane protein as a case study.
DEUTSCHES ELEKTRONEN-SYNCHROTRON
Ein Forschungszentrum der Helmholtz-Gemeinschaft
DESY 13-101
June 2013
Proposal for a scheme to generate 10 TW-level femtosecond x-ray pulses for imaging single protein molecules at the European XFEL
Svitozar Serkeza, Vitali Kocharyana, Evgeni Saldina, Igor Zagorodnova, Gianluca Gelonib, and Oleksander Yefanovc
aDeutsches Elektronen-Synchrotron DESY, Hamburg
bEuropean XFEL GmbH, Hamburg
cCenter for Free-Electron Laser Science, Hamburg ISSN 0418-9833 NOTKESTRASSE 85 - 22607 HAMBURG
1 Introduction
Infrastructure of the European XFEL facility offer a unique opportunity to build, potentially, a 10 TW-level x-ray source optimized for single biomolecule imaging. Crucial parameters for this application are photon energy range, peak power, pulse duration, and transverse coherence HAJD -BERG . In fact, experimental requirements imply very demanding characteristics for the radiation pulse. In particular, the x-ray beam should be delivered in 10 fs-long pulses in the 10 TW-level, and within a photon energy range between 3 keV and 5 keV.
The baseline SASE undulator sources at the European XFEL will saturate at about GW ETDR . While this limit is very far from the 10 TW-level required for imaging of single biomolecules, there is a cost-effective way to improve the output power, when the FEL undulators are longer than the saturation length. All the requirements for single molecular imaging in terms of photon beam characteristics can be satisfied by a simple combination of self-seeding SELF -ASYM , emittance spoiler foil EMM1 -DING , and undulator tapering techniques TAP1 -LAST . Relying on these techniques we discuss a scheme of operation for a bio-imaging undulator source, which could be built at the European XFEL based on start-to-end-simulations for an electron beam with 1 nC charge S2ER . We demonstrate that it is possible to achieve up to a 100-fold increase in peak power of the x-ray pulses: the x-ray beam would be delivered in about 10 fs-long pulses with 50 mJ energy each at photon energies around 4 keV.
2 Setup description
In order to provide bio-imaging capabilities, x-ray pulses should be provided with a tunable duration between 3 fs and 30 fs. While proposals exist to tune photon pulses at the European XFEL in this range, they require installation of additional hardware in the undulator system BIO1 , BIO3 . Here we exploit a simpler method to reach the same results still assuming that the undulator system is long enough11140 undulator cells, but making only minimal changes in the undulator system222Only a single-chicane self-seeding setup with crystal monochromator is needed. A proposal EMM1 , EMM2 and an experimental verification DING have been made in order to generate femtosecond x-ray pulses at the LCLS by using a slotted spoiler foil located in the center of the last bunch compressor. The method takes advantages of the high sensitivity of the FEL gain process to the transverse emittance of the electron bunch. By spoiling the emittance of most of the beam while leaving a short unspoiled temporal slice, one can produce an x-ray FEL pulse much shorter than in the case when the original electron bunch is sent through the undulator.
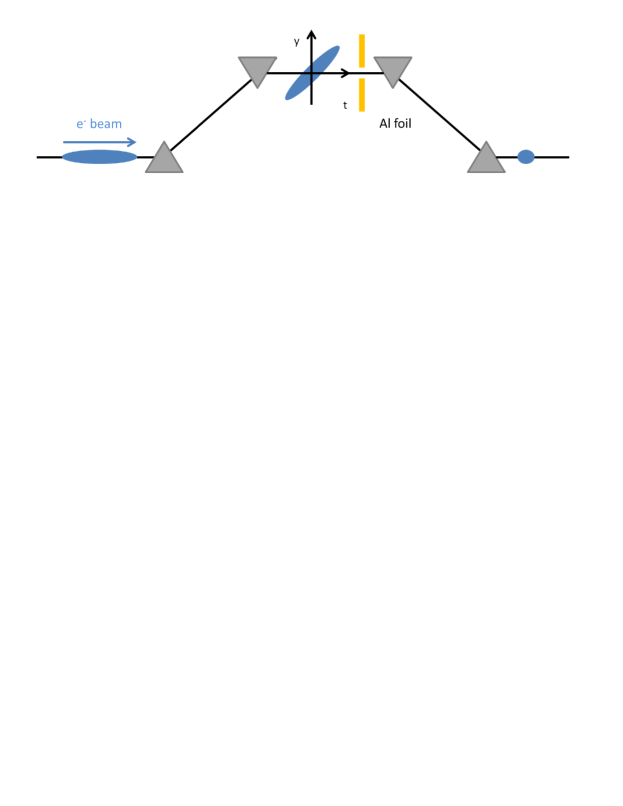
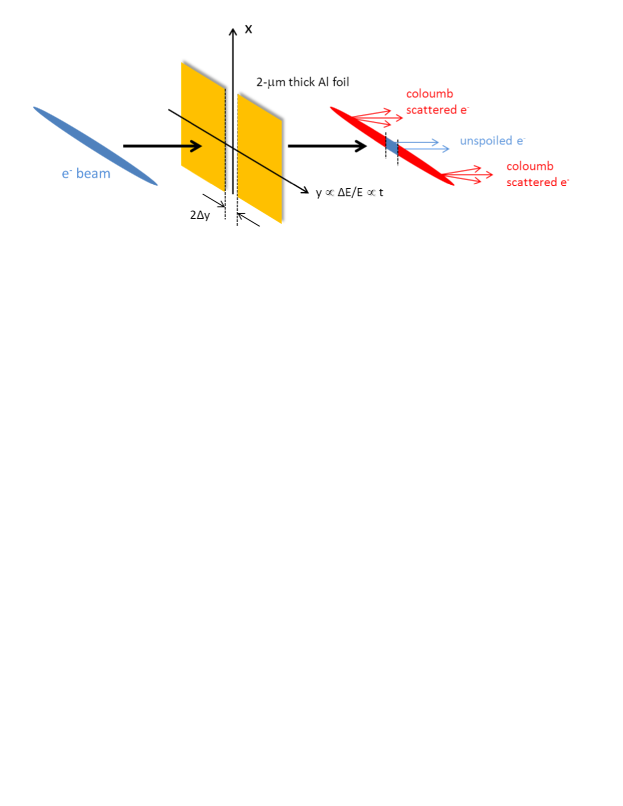
Fig. 1 shows a sketch of the slotted foil at the center of the third and last bunch compressor BC3 at the European XFEL. The last linac section before the third bunch compressor BC3 is set at an off-crest accelerating rf phase, so that the beam energy at the entrance of BC3 is correlated with time. Due to chromatic dispersion, this chirp transforms into in a bunch tilt in the chicane. At the center of BC3, i.e. at the point of maximum tilt, a thin foil is placed in the path of the beam. The foil has a narrow slot at its center, oriented as shown in Fig. 2. Coulomb scattering of the electrons passing through the foil increases the horizontal and vertical emittances of most of the beam, but leaves a thin unspoiled slice where the beam passes through the slit, Fig. 2.
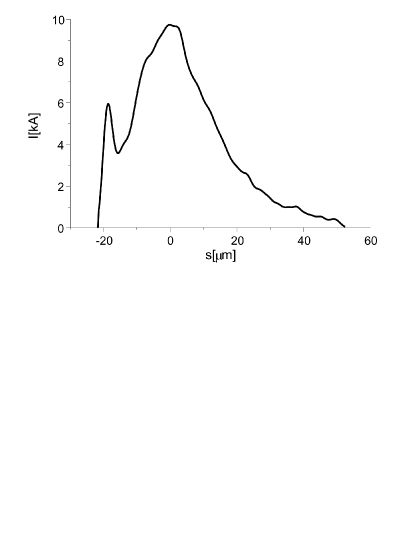
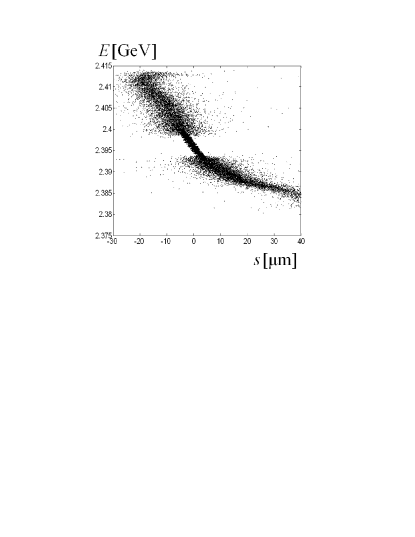
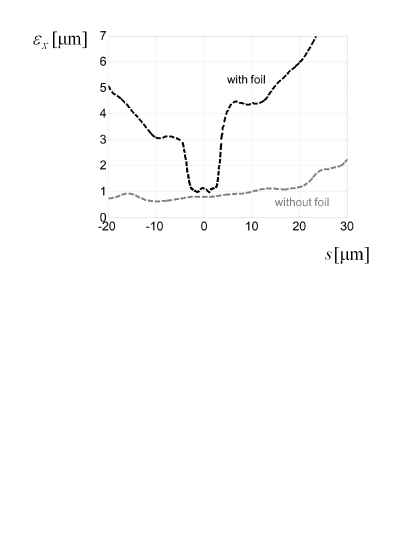
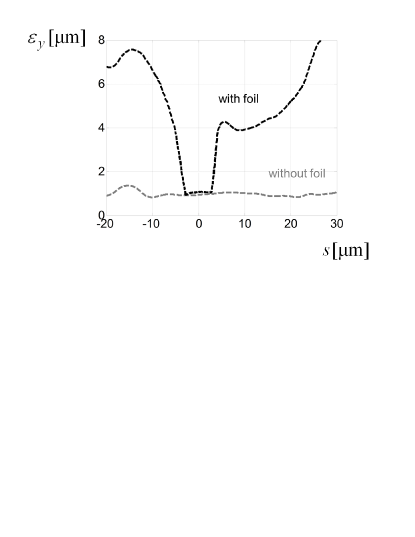
Spoiling the emittance of most of the beam by a factor strongly suppresses the FEL gain, while the short, unspoiled temporal slice produces an x-ray FEL pulse much shorter than the FWHM electron bunch duration, Fig. 3 (left plot). If a very narrow slit is used, uncorrelated energy spread and betatron beam size dominate the output slice length EMM1 , EMM2 , and one obtains a nonlinear growth of the x-ray pulse length versus the slot width. When the slit becomes larger, the growth becomes linear and the x-ray pulse length is mainly determined by the width of the slit DING . The minimum duration of the unspoiled slice of the electron bunch measured at the LCLS is about 3 fs DING . We use current profile, normalized emittance, energy spread profile, electron beam energy spread and wakefields from S2ER . The electron beam charge is 1 nC, and the peak current is 10 kA, Fig. 3 (left plot). Detailed computer simulations with macroparticles have been carried out to evaluate the performance of the slotted spoiler using the tracking code ELEGANT ELEG . They include multiple Coulomb scattering in a m thin aluminum foil. The longitudinal distribution of the particles just after the BC3 chicane is shown in Fig 3 (right plot). A slit full-width of mm selects a small fraction of electrons, about , and produces an unspoiled electron bunch slice after BC3, with a duration of about fs FWHM333As we will see, the FEL gain-narrowing allows an x-ray pulse duration of about fs, Fig. 4.
A design of a self-seeding setup based on the undulator system for the European XFEL is sketched in Fig. 5. The method for generating high power x-ray pulses exploits a combination of a self-seeding scheme with an undulator tapering technique. Tapering consists in a slow reduction of the field strength of the undulator in order to preserve the resonance wavelength, while the kinetic energy of the electrons decreases due to the FEL process. The undulator taper could be simply implemented at discrete steps from one undulator segment to the next, by changing the undulator gap. Highly monochromatic pulses generated with the self-seeding technique make the tapering much more efficient than in the SASE case.
Here we study a scheme for generating 10 TW-level x-ray pulses in a SASE3-type tapered undulator. However, a similar scheme can be implemented at SASE1 or SASE2. In the following we assume to have undulator segments at our disposal. We optimize our setup based on start-to-end simulations for a 17.5 GeV electron beam with 1 nC charge compressed up to 10 kA peak current. In this way, the output power of the SASE3 undulator could be increased from the value of 100 GW in the SASE regime444There is an increase in the SASE saturation power with respect to the nominal mode of operation, due to the increase in peak current from the nominal 5 kA to our case, where 10 kA are obtained with particular settings of the bunch formation system. to about 5 TW in the photon energy range around 4 keV.
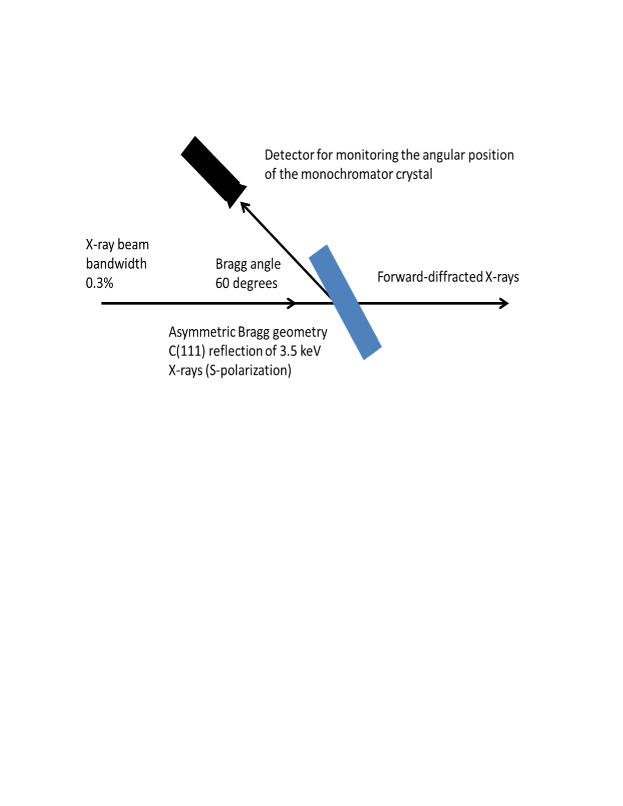
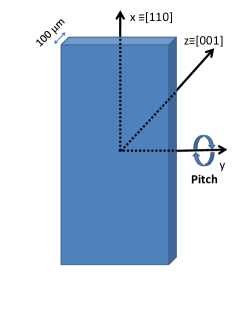
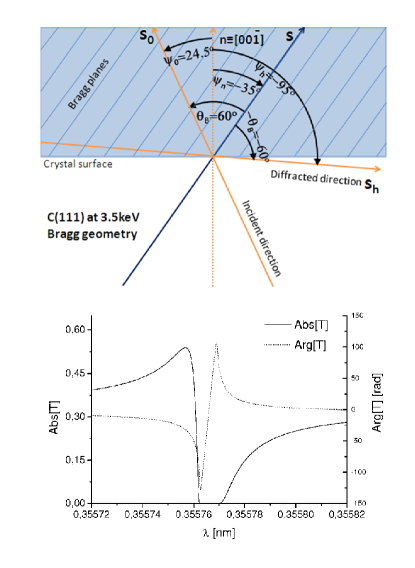
Our design adopts the simplest self-seeding scheme, which uses the transmitted x-ray beam from a single crystal to seed the same electron bunch, Fig. 6. In the following we will consider a m-thick diamond crystal. We define a Cartesian reference system [] linked with the crystal. The direction corresponds to the direction identified by the Miller indexes [0, 0, 1], while and are specified as in Fig. 7. The crystal can rotate freely around the axis (pitch angle) as indicated in figure. In this way we can exploit several symmetric and asymmetric reflections. By changing the pitch angle of the crystal in Fig. 7 we are able, in fact, to cover the entire energy range between 3 keV and 13 keV SHVI , ASYM . In the low energy range between 3 keV and 5 keV we use a C(111) asymmetric reflection (in Bragg and Laue geometry, depending on the energy). For self-seeding implementation, we are interested in the forward diffracted beam. From this viewpoint, the crystal can be characterized as a filter with given complex transmissivity. In Fig. 8 we show scattering geometry, amplitude and phase of the transmittance for the C(111) asymmetric Bragg reflection at 3.5 keV.
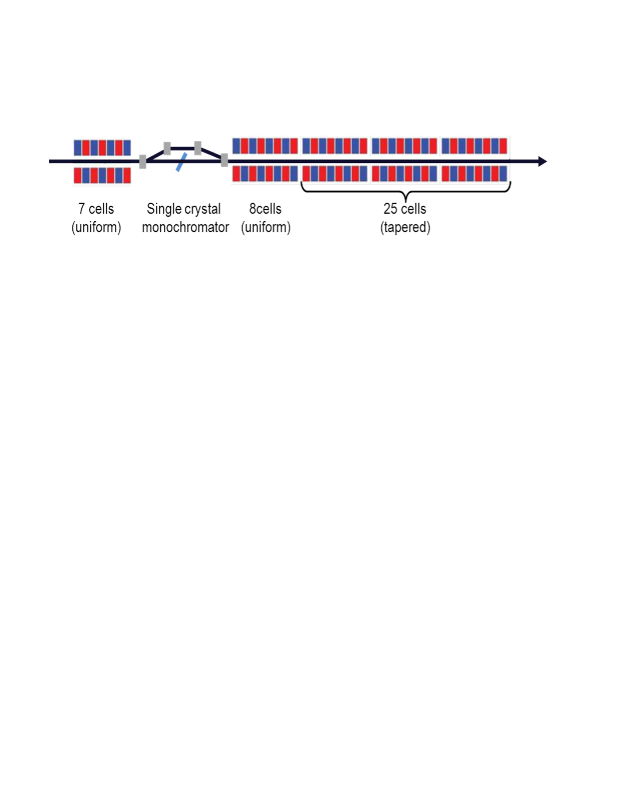
Summing up, the overall self-seeding setup proposed here consists of three parts: a SASE undulator, a self-seeding single crystal monochromator and an output undulator, in which the monochromatic seed signal is amplified up to the 10 TW-level, Fig. 5. Calculations show that, in order not to spoil the electron beam quality and to simultaneously reach signal dominance over shot noise, the number of cells in the first (SASE) undulator should be equal to 7. The output undulator consists of two sections. The first section is composed by an uniform undulator, the second section by a tapered undulator. The monochromatic seed signal is exponentially amplified passing through the first uniform part of the output undulator. This section is long enough, 8 cells, in order to reach saturation, which yields about 100 GW power. Finally, in the second part of the output undulator the monochromatic FEL output is enhanced up to 5 TW by taking advantage of the undulator magnetic field taper over the last 25 cells.


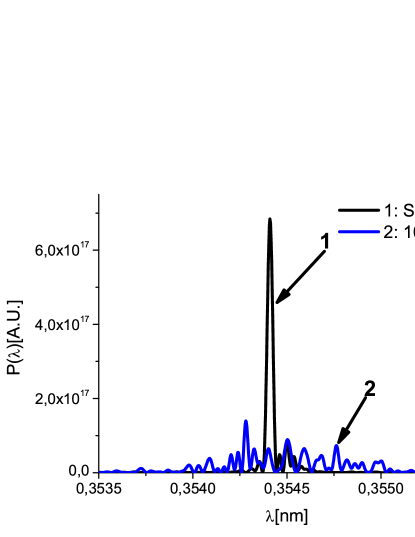

Simulations were performed with the help of the Genesis code GENE in the following way: first we calculated the 3D field distribution at the exit of the first undulator, and dumped the field file. Subsequently, we performed a temporal Fourier transform followed by filtering through the monochromator, by using the filter amplitude transfer function. The electron beam microbunching is washed out by the presence of a nonzero momentum compaction factor in the chicane. Therefore, for the second undulator we used a beam file with no initial microbunching, but with characteristics (mainly the energy spread) induced by the FEL amplification process in the first SASE undulator. The amplification process in the second undulator starts from the seed field file. Shot-noise initial condition were included. The output power and spectrum after the first SASE undulator tuned at 3.5 keV is shown in Fig. 9. The crystal acts as bandstop filter, and the output spectrum is plotted in Fig. 10 (right). The signal in the time domain exhibits a long monochromatic tail, which is used for seeding, Fig. 10 (left). The electron bunch is slightly delayed by proper tuning of the self-seeding magnetic chicane, in order to superimpose the unspoiled part of the electron bunch with the seed signal. After saturation the undulator is tapered, i.e. the undulator parameter is changed section by section, following the configuration in Fig. 11.
The output power and spectrum of the entire setup, that is after the second part of the output undulator is shown in Fig 12. In particular, the self seeded power is compared with the SASE power. The evolution of the output energy in the photon pulse is plotted in Fig. 13.
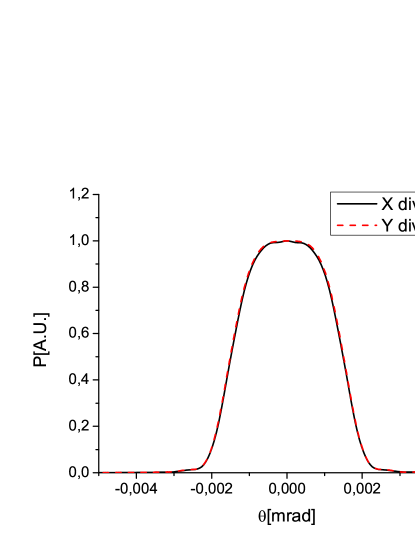
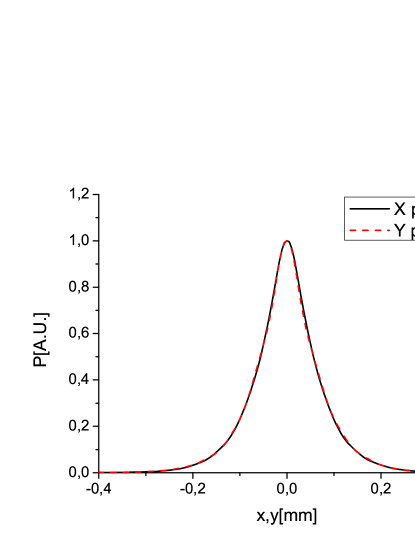
Finally, the distribution of the radiation pulse energy per unit surface and the angular distribution of the radiation pulse energy at the exit of output undulator are shown in Fig. 14.
3 Potential for biomolecular imaging with 10 TW-power level x-ray pulses
The most interesting novel properties of the source proposed in this article, which are most important for life science applications, are the extremely short pulse width (about fs) and the very high peak power (about TW). Imaging of single molecules at atomic resolution using radiation from the European XFEL facility would enable a significant advance in structural biology, because it would provide means to obtain structural information of large macromolecular assemblies that cannot crystallize, for example membrane proteins. The imaging method ”diffraction before destruction” HAJD -BERG requires pulses containing enough photons to produce measurable diffraction patterns and short enough to outrun radiation damage. The highest signals are achieved at the longest wavelength that supports a given resolution, which should be better than 0.3 nm. These considerations suggest that the ideal wavelength range for single biomolecule imaging spans between 3 keV and 5 keV BERG .
After interacting with a single XFEL pulse the sample is completely destroyed, so that one molecule can only yield a single measurement. In order to actually perform the single molecule imaging, several steps have to be taken. First, a series of single molecules with the same structure are injected into vacuum and exposed to ultrashort x-ray pulses. Many diffraction images of the molecule with unknown orientation are recorded before radiation-induced damage takes place. This process is repeated until a sufficient number of images are recorded. Next, the relative orientations of the different images are determined in order to assemble a 3D diffraction pattern in the reciprocal space HULD -IKED . Finally, the 3D electron density of the molecule is obtained by a phase retrieval method. The higher the intensity is, the stronger the diffraction signal, and the higher the resolution for each 2D diffraction pattern. It can be seen that structural determination of biomolecules of around 10 nm size require a pulse fluence of about photons/mm2, a resolution of 0.3 nm and a photon energy around 4 keV. Bio-imaging capabilities can be obtained by reducing the pulse duration to 10 fs or less, and simultaneously by increasing the number of photons per pulse to about . This yields the required fluence with a 100 nm focus555We are assuming that beamline and focusing efficiency are such, that all photons are transmitted into the focus..
The key figure for optimizing a photon source for single biomolecule imaging is the peak power. Ideally, the peak power should be of the order of 10 TW. In order to motivate this number with an example, we note that photons at 3.5 keV correspond to an energy of about mJ which yields, in 10 fs, a peak power of about TW. It is worthwhile to mention that 1 TW at 3 keV gives the same signal per Shannon pixel as 20 TW at 8 keV (assuming a fixed pulse duration).

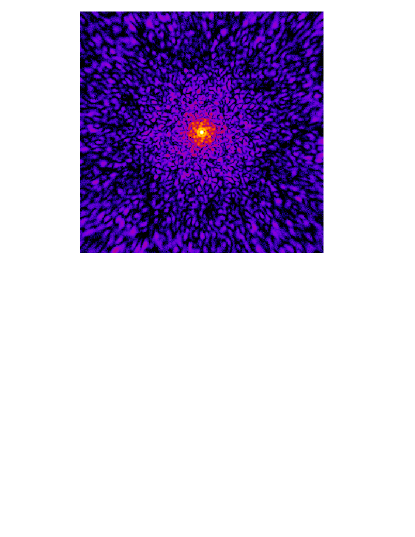
Simulations confirm that with photons in a fs pulse at a photon energy around 4 keV and with a 100 nm focus, one can achieve diffraction to the desired resolution of nm for a molecule of about 10 nm size. This fact is exemplified by using the photosystem-I membrane protein as a case study, Fig. 15 . The simulated diffraction pattern from the photosystem-I for a fluence of photons/mm2 is shown in Fig. 16. The simulation was performed neglecting radiation damage. While some controversy is present in the community concerning the upper limit to the fluence imposed by radiation damage issue, there are indications that the diffraction signal still improves up to about photons focused down to nm LORE .
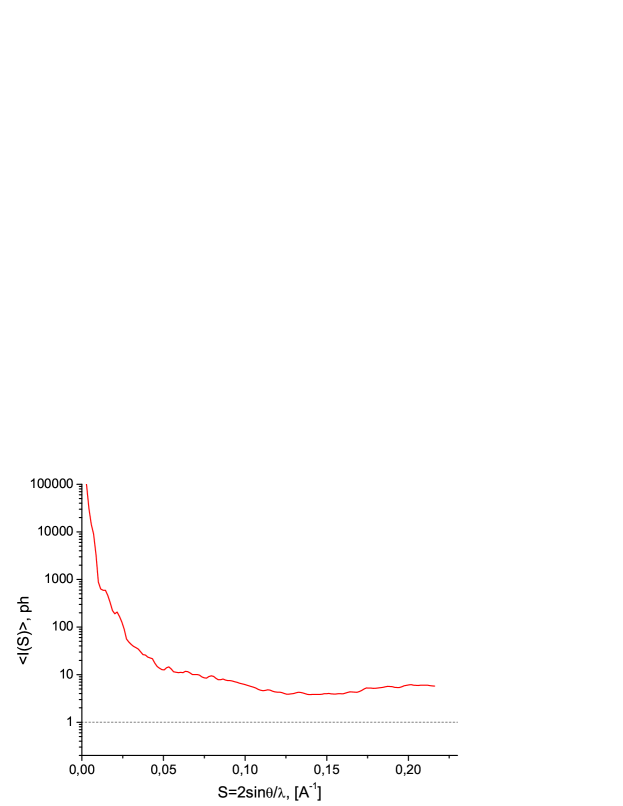
First, the diffraction patterns must be oriented with respect to each other in 3D Fourier space. The key figure here is the number of photons per Shannon pixel per single-shot diffraction pattern. Fig. 17 shows the radially-averaged scattered intensity as a function of the modulus of the scattering vector. One can see that most detector pixel values are considerably higher than one photon count, up to the edge of the detector. Studies have shown that a signal in the order of one photon per pixel would be sufficient to correlate diffraction images of identical molecules. A detector pixel value larger than 1 photon/pixel results in an increase in the number of classified images, up to the number of hits. For a molecule of 10 nm size one needs about 100 evenly spread 2D projections to get a geometrical resolution of 0.3 nm. Thus, at an average pixel value larger than 1 photon/pixel, a number of hits of about 100 is required to achieve full 3D information accounting only for the photon shot noise.
4 Conclusions
The main expectation and the main challenge emerging from applications of XFEL sources to life sciences, is the determination of 3D structures of biomolecules and their complexes from diffraction images of single particles. Only two facilities, European XFEL ETDR and the LCLS-II LCL2 will have the possibility to build a beamline suitable for single biomolecule imaging. In fact, in the next decade, no other XFEL source will have a driver with high-enough electron beam energy (13-17 GeV) and, at the same time, long enough undulators (250 m) to enable 10 TW mode of operation with about 10 fs-long x-ray pulses. In this work we proposed a cost-effective upgrade program for an undulator source at the European XFEL, which could result in a beamline optimized for single biomolecular imaging, with the potential to secure a world-leading position in the field of life sciences for the European XFEL.
5 Acknowledgements
We are grateful to Massimo Altarelli, Reinhard Brinkmann, Henry Chapman, Janos Hajdu, Viktor Lamzin, Serguei Molodtsov and Edgar Weckert for their support and their interest during the compilation of this work. We thank Y. Ding and Z. Huang for useful discussions about the emittance spoiler method, Edgar Weckert for providing the code MOLTRANS to one of us (O.Y.).
References
- [1] J. Hajdu, Curr. Opin. Struct. Biol. 10, 569 (2000).
- [2] R. Neutze et al., Nature 406, 752 (2000).
- [3] K. J. Gaffney and H. N. Chapman, Science 316, 1444 (2007).
- [4] M. M. Seibert et al., Nature 470 (7332) 78-81 (2011).
- [5] S. Baradaran et al., LCLS-II New Instruments Workshops Report, SLAC-R-993 (2012), see Section 4.3.2. by H. Chapman et al., and Section 4.3.3. by F. R. N. C. Maia et al.
- [6] M. Altarelli, et al. (Eds.) XFEL, The European X-ray Free-Electron Laser, Technical Design Report, DESY 2006-097, Hamburg (2006).
- [7] J. Feldhaus et al., Optics. Comm. 140, 341 (1997).
- [8] E. Saldin, E. Schneidmiller, Yu. Shvyd’ko and M. Yurkov, NIM A 475 357 (2001).
- [9] E. Saldin, E. Schneidmiller and M. Yurkov, NIM A 445 178 (2000).
- [10] R. Treusch, W. Brefeld, J. Feldhaus and U Hahn, Ann. report 2001 ”The seeding project for the FEL in TTF phase II” (2001).
- [11] A. Marinelli et al., Comparison of HGHG and Self Seeded Scheme for the Production of Narrow Bandwidth FEL Radiation, Proceedings of FEL 2008, MOPPH009, Gyeongju (2008).
- [12] G. Geloni, V. Kocharyan and E. Saldin, ”Scheme for generation of highly monochromatic X-rays from a baseline XFEL undulator”, DESY 10-033 (2010).
- [13] Y. Ding, Z. Huang and R. Ruth, Phys.Rev.ST Accel.Beams, vol. 13, p. 060703 (2010).
- [14] G. Geloni, V. Kocharyan and E. Saldin, ”A simple method for controlling the line width of SASE X-ray FELs”, DESY 10-053 (2010).
- [15] G. Geloni, V. Kocharyan and E. Saldin, ”A Cascade self-seeding scheme with wake monochromator for narrow-bandwidth X-ray FELs”, DESY 10-080 (2010).
- [16] Geloni, G., Kocharyan, V., and Saldin, E., ”Cost-effective way to enhance the capabilities of the LCLS baseline”, DESY 10-133 (2010).
- [17] J. Wu et al., ”Staged self-seeding scheme for narrow bandwidth , ultra-short X-ray harmonic generation free electron laser at LCLS”, proceedings of 2010 FEL conference, Malmo, Sweden, (2010).
- [18] Geloni, G., Kocharyan V., and Saldin, E., ”Generation of doublet spectral lines at self-seeded X-ray FELs”, DESY 10-199 (2010), and Optics Communications, 284, 13, 3348 (2011)
- [19] Geloni, G., Kocharyan, V., and Saldin, E., ”Production of transform-limited X-ray pulses through self-seeding at the European X-ray FEL”, DESY 11-165 (2011).
- [20] Geloni, G., Kocharyan V., and Saldin, E., ”A novel Self-seeding scheme for hard X-ray FELs”, Journal of Modern Optics, vol. 58, issue 16, pp. 1391-1403, DOI:10.1080/09500340.2011.586473 (2011)
- [21] J. Wu et al., Simulation of the Hard X-ray Self-seeding FEL at LCLS, MOPB09, FEL 2011 Conference proceedings, Shanghai, China (2011).
- [22] J. Amann et al., Nature Photonics, DOI: 10.1038/NPHOTON.2012.180 (2012).
- [23] R. R. Lindberg and Yu.V. Shvyd ko, Phys. Rev. ST Accel. Beams 15, 100702 (2012).
- [24] Y. Feng et al., ”System design for self-seeding the LCLS at soft X-ray energies”, Proceedings of the 24th International FEL Conference, Nara, Japan (2012).
- [25] S. Serkez, G. Geloni, V. Kocharyan and E. Saldin, ”Grating monochromator for soft X-ray self-seeding the European XFEL”, DESY 13-040, http://arxiv.org/abs/1303.1392 (2013).
- [26] G. Geloni, V. Kocharyan, E. Saldin, S. Serkez and M. Tolkiehn, ”Wake monochromator in asymmetric and symmetric Bragg and Laue geometry for self-seeding the European XFEL”, DESY 13-013 (2013).
- [27] P. Emma, K. Bane, M. Cornacchia, Z. Huang, H. Schlarb, G. Stupakov, and D. Walz, PRL 92, 074801-1 (2004).
- [28] P. Emma, M. Borland and Z. Huang, Proceedings of the FEL Conference 2004, TUBIS01, p.333 (2004).
- [29] Y. Ding , et al., PRL 109, 254802-1 (2012).
- [30] A. Lin and J.M. Dawson, Phys. Rev. Lett. 42 2172 (1986).
- [31] P. Sprangle, C.M. Tang and W.M. Manheimer, Phys. Rev. Lett. 43 1932 (1979).
- [32] N.M. Kroll, P. Morton and M.N. Rosenbluth, IEEE J. Quantum Electron., QE-17, 1436 (1981).
- [33] T.J. Orzechovski et al., Phys. Rev. Lett. 57, 2172 (1986).
- [34] W. Fawley et al., NIM A 483 p 537 (2002).
- [35] M. Cornacchia et al., J. Synchrotron rad. 11, 227-238 (2004).
- [36] X. Wang et al., PRL 103, 154801 (2009).
- [37] G. Geloni, V. Kocharyan and E. Saldin, ”Scheme for generation of fully coherent, TW power level hard x-ray pulses from baseline undulators at the European XFEL”, DESY 10-108 (2010).
- [38] W.M. Fawley et al., Toward TW-level LCLS radiation pulses, TUOA4, FEL 2011 Conference proceedings, Shanghai, China (2011).
- [39] Y. Jiao et al. Phys. Rev. ST Accel. Beams 15, 050704 (2012).
- [40] I. Zagorodnov, ”Beam Dynamics Simulations for XFEL”, http://www.desy.de/xfel-beam/s2e (2011), and ”Compression scenarios for the European XFEL”, http://www.desy.de/fel-beam/data/talks/files/ZagorodnovACC2012readynew.pptx, (2012).
- [41] G. Geloni, V. Kocharyan and E. Saldin, ”Conceptual design of an undulator system for a dedicated bio-imaging beamline at the European X-ray FEL”, DESY 12-082, http://arxiv.org/abs/1205.6345 (2012).
- [42] G. Geloni, V. Kocharyan and E. Saldin, ”Optimization of a dedicated bio-imaging beamline at the European X-ray FEL”, DESY 12-159, http://arxiv.org/abs/1209.5972 (2012).
- [43] M. Borland, Elegant, http://www.aps.anl.gov/Accelerator SystemsDivision/Accelerator OperationsPhysics/software.shtmlelegant
- [44] A. Authier, Dynamical Theory of X-Ray Diffraction (Oxford University, 2001).
- [45] S. Reiche et al., Nucl. Instr. and Meth. A 429, 243 (1999).
- [46] G. Huldt and A. Szoke and J. Hajdu, J. Struct. Biol., 144, 219 (2003)
- [47] G. Bortel and G. Faigel J. Struct. Biol. 158, p10 (2007).
- [48] R. Fung, V. Shneerson, D. Saldin and A. Ourmazd, Nature Physics 5, 64 (2009).
- [49] N. D. Loh et al., Phys. Rev. Lett. 104, 22, 2255051 (2010).
- [50] S. Ikeda and H. Kono, Optics Express 20 p3375 (2012).
- [51] Protein Data Bank, http://www.rcsb.org/pdb/101/motm.do?momID=22
- [52] Results were obtained using the code MOLTRANS, written by E. Weckert.
- [53] U. Lorenz, N. M. Kabachnik, E. Weckert and I. A. Vartanyants, Phys. Rev. E” 86, 051911 (2012).
- [54] The LCLS-II CDR, https://portal.slac.stanford.edu/sites/lclspublic/lcls ii/PublishedDocuments/CDR20Index.pdf (2011).