AGN outflows trigger starbursts in gas-rich galaxies
Abstract
Recent well resolved numerical simulations of AGN feedback have shown that its effects on the host galaxy may be not only negative but also positive. In the late gas poor phase, AGN feedback blows the gas away and terminates star formation. However, in the gas-rich phase(s), AGN outflows trigger star formation by over-compressing cold dense gas and thus provide positive feedback on their hosts. In this paper we study this AGN-triggered starburst effect. We show that star formation rate in the burst increases until the star formation feedback counteracts locally the AGN outflow compression. Globally, this predicts a strong nearly linear statistical correlation between the AGN and starburst bolometric luminosities in disc galaxies, . The correlation is statistical only because AGN activity may fluctuate on short time scales (as short as tens of years), and because AGN may turn off but its effects on the host may continue to last until the AGN-driven outflow leaves the host, which may be up to 10 times longer than the duration of the AGN activity. The coefficient in front of this relation depends on the clumpiness and morphology of the cold gas in the galaxy. A “maximum starburst” takes place in a azimuthally uniform gas disc, for which we derive an upper limit of times larger than for typical quasars. For more clumpy and/or compact cold gas distributions, the starburst luminosity decreases. We also suggest that similar AGN-triggerred starbursts are possible in hosts of all geometries, including during galaxy mergers, provided the AGN is activated. Finally, we note that due to the short duration of the AGN activity phase the accelerating influence of AGN on starbursts may be much more common than observations of simultaneous AGN and starbursts would suggest.
keywords:
accretion, accretion discs — quasars:general — black hole physics — galaxies:evolution — stars:formation1 Introduction
Supermassive black holes (SMBHs) are known to reside in the centres of most large galaxies. The masses of these SMBHs correlate with a range of properties of their host spheroids, including luminosity (e.g. Magorrian et al., 1998) and mass (e.g. Marconi & Hunt, 2003; Häring & Rix, 2004); and the gravitational binding energy of the bulge (e.g. Feoli & Mele, 2005; Aller & Richstone, 2007). Furthermore, the correlation between SMBH mass () and the velocity dispersion () of its host spheroid, referred to below as a “– relation”, has been studied by many authors. A power-law fit to the data, , yielded values of in the range of (cf. Ferrarese & Merritt, 2000; Gebhardt et al., 2000; Tremaine et al., 2002; Gültekin et al., 2009).
The most natural explanation for the observed correlations quoted above is that it is an imprint of the self-regulated growth of the SMBH. Winds, other types of outflows and radiation (e.g., Silk & Rees, 1998; Fabian, 1999; Ciotti & Ostriker, 2001) are expected to drive the gas out of the host’s potential, limiting the SMBH mass and establishing the observed SMBH-galaxy correlations (King, 2003, 2005).
Recently, fast ( km s-1) molecular outflows resolved on kpc scales were reported by a number of authors (e.g., Feruglio et al., 2010; Rupke & Veilleux, 2011; Sturm et al., 2011). These were interpreted by Zubovas & King (2012a) as being driven by the quasar outflow in the energy-driven regime where the shocked primary outflow does not cool rapidly enough (King, 2005; King et al., 2011; Faucher-Giguère & Quataert, 2012). In this scenario the SMBH inflates a huge hot bubble that sweeps up galactic gas into a shell that is driven out at velocities a few times that of the host’s escape velocity, e.g., comparable to what is observed.
Nayakshin & Zubovas (2012) numerically simulated the dynamics of the SMBH wind in three dimensions, and found that when the ambient shocked gas cools rapidly, the shocked gas is compressed into thin cold dense shells, filaments and clumps. Driving these high density features out is more difficult than analytical models predict. Importantly, quasars have another way of affecting the host in this regime – by triggering a massive star formation burst in the cold gas by over-pressurising it. Under these conditions SMBHs actually accelerate star formation in the host, having a positive rather than a negative effect on their host galaxies. Note that this does not take away the quasar’s negative feedback role traditionally appreciated in the literature: Nayakshin & Zubovas (2012) find that at later, gas-poor epochs, when the ambient gas does not cool rapidly, the quasar shock is very effective in driving the gas outward and thus curtailing further star formation in the host galaxy.
Here we attempt to quantify the properties of the starburst fuelled by the pressure of the quasar-driven bubble. Clearly the result of such a calculation should depend sensitively on the distribution (morphology, clumpiness, total mass, etc.) of the gas in the host galaxy. To demonstrate our main points, we make the simplest assumption that the gas resides in a large galactic disc with properties taken from the models of Mo et al. (1998). We also assume that the gas in the disc is smoothly distributed. This unrealistic assumption produces a situation where gas can turn into stars everywhere in the disc as soon as it is compressed, provided the cooling time is short. Unless the disc accretes material from the galactic halo, this situation yields an upper limit to the star formation rate and starburst luminosity within the framework of our model. We therefore call such a configuration a “maximum starburst”. A situation of significant accretion rate is highly unlikely, because the halo gas is being expelled by the AGN outflow and does not cool efficiently. A more realistic system, with cold gas concentrated in clumps and/or spiral arms, results in a smaller surface area of the disc that responds to an AGN outflow by increasing its star formation rate. We consider more general gas geometries in the Discussion section.
The paper is structured as follows. In Section 2 we briefly review the dynamics of large-scale energy-driven AGN outflows and derive the pressure inside the outflowing shell. Section 3 presents the expected correlation between starburst and AGN luminosity. We then use a numerical model, which we describe in Section 4, to calculate the properties of the triggered star formation in a galactic disc (Section 5). We discuss our results and their implications in Section 6 and summarise them in Section 7.
2 Pressure in an AGN outflow
2.1 Large-scale outflow dynamics
Pressure inside an accretion disc around an SMBH launches a wind, which is then accelerated by the Eddington-accreting AGN radiation pressure to a velocity (King, 2003, 2010). This wind shocks against the surrounding material and drives an outflow in the AGN host galaxy. The dynamics of the outflow depend on whether the shocked wind can cool faster than it expands adiabatically. Efficient cooling can only be achieved via inverse-Compton scattering on the photons of the AGN radiation field (Ciotti & Ostriker, 1997; King, 2003) and happens in the central parts of the galaxy. Simple estimates give the radius of transition between cooling and non-cooling regimes as
| (1) |
(King, 2003; Zubovas & King, 2012b); here, is the velocity dispersion of the host galaxy in units of km/s, is the SMBH mass in , is the Eddington luminosity ratio of the AGN, is the ratio of gas density to total density and is the cosmological value of . Faucher-Giguère & Quataert (2012) calculated the cooling radius in more detail, accounting for cooling of non-relativistic electrons, the nonzero electron-ion energy equilibration timescale and non-isothermal background potentials. They find that the cooling radius is likely to be even smaller than that given by eq. (1).
On large scales, then, the AGN wind gives up all of its energy to the outflow. This energy-driven outflow has a kinetic luminosity
| (2) |
and drives a forward shock into the ambient medium with a velocity
| (3) |
(Zubovas & King, 2012a), which clears the spheroidal component of the galaxy on a timescale much faster than dynamical; is the outward velocity of the contact discontinuity between the shocked wind and the outflow. The mass outflow rate is
| (4) |
easily able to remove a large fraction of a galaxy’s gas on short timescales. The momentum flow rate of an energy-driven outflow is also larger than in the wind, by a factor
| (5) |
where is the mass loading factor of the outflow. The extra momentum is created by the acceleration caused by the over-pressurised bubble of shocked wind interior to the ambient medium.
2.2 Outflow pressure on dense material
The outflow structure is composed of four regions. Moving radially outward from the centre, these are: free-streaming wind, shocked wind, shocked ambient medium and undisturbed ambient medium. The pressure in the first and last regions is not important for our investigation; the free-streaming wind pushes any material it encounters with at most the ram pressure, which is much lower than the thermal pressure inside the shocked wind bubble, while the undisturbed ambient medium is not yet affected by AGN feedback. The pressure in the two intermediate regions varies between values that can be calculated analytically for each of the three boundaries: the wind shock, the contact discontinuity and the outer shock.
The shock front of the wind (the inner shock) is moving backwards with respect to the contact discontinuity with a velocity . Using the adiabatic shock conditions, we have, in the frame of the shock,
| (6) |
From this, we find
| (7) |
where we used the fact that in most reasonable cases. The shock front thus quickly reaches from the outside. It cannot move closer in, because in that region the shock wind cools and loses its energy very quickly. We thus have a standing shock at . The pressure at that radius is then
| (8) |
We have used equation (1) to find the numerical value. This pressure does not vary with time, unless the cooling radius itself varies.
The pressure at the contact discontinuity can be derived from the energy-driven equation of motion (cf. King, 2005):
| (9) |
This pressure depends on the radius of the contact discontinuity as , provided that is constant with radius. This is the case for an isothermal potential but is not strictly true in NFW and other more complicated halos. Numerically, in the case of an isothermal potential,
| (10) |
Finally, at the outer shock, the pressure is
| (11) |
This pressure varies similarly to the pressure at the contact discontinuity.
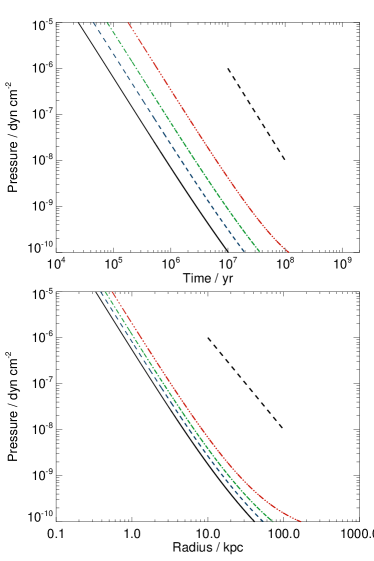
We show the time variation of pressure at the contact discontinuity (equation 9) in Figure 1. The precise values of pressure depend on the assumed background potential; here we consider an NFW profile with km/s, concentration , scale radius kpc and gas fractions of , , and for the black solid, blue dashed, green dot-dashed and red dot-triple-dashed lines, respectively. The top panel shows pressure dependence on the time since the start of an AGN activity episode, while the bottom panel shows the pressure as function of the radius of the contact discontinuity. For ease of comparison, we draw lines of and (thick dashed lines in the two plots). The pressure evolution is similar to, but slightly differs from, this simple estimate, due to the fact that is not constant in an NFW profile.
Any structure in a galaxy that is too dense to be blown away by the outflow is compressed by this external pressure once the outer shock moves past it. For a galaxy disc, this compression acts perpendicular to the disc plane from both sides, while in more spherical structures (such as molecular clouds) the pressure acts from all directions. At any given radius , the evolution of the external pressure profile can be characterised by three phases. Initially, before the outflow reaches , the external pressure is small. Once the outer shock passes , the pressure suddenly increases to the value given by equation (11) and soon after to the value in equation (9). Then, as the outflow bubble expands, the pressure decreases approximately as
| (12) |
as seen in Figure 1, where is measured from the start of the AGN activity episode. This phase continues until either the AGN switches off or until the outflow breaks out past the virial radius of the galaxy and its velocity starts increasing significantly. In the first case, the pressure drops more rapidly due to a decrease in outflow velocity . In the second case, as can be seen at the bottom of the plots in 1, the pressure decrease slows down as starts to rise.
2.3 Star formation in compressed gas
Star formation in a galaxy disc takes place when the Toomre (1964) Q parameter drops below . However, feedback from star formation is expected to release significant amounts of radiation, mechanical energy and momentum, heating the disc up. This energy release should increase the Toomre’s parameter, which would then terminate star formation. Therefore, it is believed that star formation in a galactic disc self-regulates to maintain the Q-parameter close to unity (Thompson et al., 2005). Here we show that in the presence of a powerful AGN outflow, this self-regulation is significantly modified, resulting in a much higher star formation rate in the disc.
Qualitatively, we envision the following scenario. A galaxy disc is composed of cold gas clouds embedded in warm and hot phases of the ISM. The AGN outflow cannot push the disc away radially (Nayakshin et al., 2012), but moves around it through the halo. The isotropic pressure in the shocked halo ISM compresses the hot gas in the disc. This overpressurized gas exerts approximately isotropic pressure upon the cold clouds and drives shockwaves into them, leading to an increase in density in the post-shock region (Jog & Solomon, 1992). Gas that was already self-gravitating and on the verge of collapsing continues to do so more rapidly, while some gas that was unbound becomes self-gravitating due to this density increase. Therefore, external pressure can in principle both enhance and trigger gravitational collapse in cold gas clouds.
Next, we move on to quantitative estimates. Combining equations (4) and (6) in Thompson et al. (2005), we derive the midplane pressure of the self-regulated disc:
| (13) |
where is the ratio of disc gas mass to total dynamical mass and is the sound speed in the disc. Comparing this with the outflow pressure at the outer shock (eq. 11), we obtain the ratio
| (14) |
where we assume . We see, therefore, that the AGN outflow pressure is one or two orders of magnitude higher than the internal pressure of the disc, independently of radius, and thus the disc is significantly compressed.
The response of the galactic disc to this compression can be estimated as follows. External pressure on the disc compresses the disc and star-forming clouds within it. The disc gas cools rapidly (Thompson et al., 2005, Appendix B) and contracts, increasing gas density and the star formation rate. The disc SFR thus increases until the turbulent pressure created by stellar feedback counteracts not only the disc self-gravity, but the external pressure as well. As a result, the SFR increases above the values calculated in Thompson et al. (2005) until it saturates at
| (15) |
where is the efficiency of mass-to-radiation conversion by massive stars (Leitherer et al., 1992). This approach assumes a quasi-steady state in which massive stars end their life cycle in supernova explosions at the same rate as new massive stars are born.
Clearly, the steady-state situation assumed by equation 15 sets in only after Myr, the lifetime of the most massive stars. One may therefore think that at earlier times the star formation rate density could actually significantly exceed this limit since supernova explosions from massive stars have not yet occured. However, winds from massive stars provide radiation pressure support against collapse as well. McLaughlin et al. (2006) showed that young stellar clusters produce feedback with a thrust , where is the Eddington luminosity for the cluster mass. Using the definition of Eddington luminosity and the fact that , where is the area, we find that
| (16) |
an extra factor of two comes from the fact that external pressure acts on both sides of the disc. This equation shows that the initial burst of rapid star formation terminates when the surface mass density of the young stellar population builds up above kpc-2. As massive stars die, their stellar wind feedback decreases, and thus new stars must be born to maintain the pressure balance. This brings us back to the steady-state limit given by equation 15.
To show that the initial pre-supernova star burst does not exceed the steady-state star formation rate significantly, we assume an average massive star lifetime of Myr, and write an approximate maximum star formation rate density
| (17) |
a value very similar to that obtained in equation (15).
3 Relation between AGN and starburst luminosity
This burst of star formation, proceeding at a rate given by eq. (15), creates a young stellar population, producing a radiation flux
| (18) |
here, is the (time dependent) efficiency of mass-to-radiation conversion by the whole stellar population. On timescales longer than Myr, , since we can approximate the radiation flux to be just that of the young stars, provided that the starburst is still progressing. On shorter timescales, the precise equality does not hold, because we must account for the death of massive stars as well. Therefore a statistical correlation between AGN activity and starburst luminosity is established in yr.
We now express the star formation flux in terms of the AGN luminosity. In an isothermal background potential for an SMBH with (King, 2010) radiating at times the Eddington limit, we find
| (19) |
We substitute this expression into eq. (18) to find
| (20) |
where erg/s and we dropped the factor . The relation between and is similar for other density profiles, such as NFW, although there refers to the maximum value of the formal velocity dispersion .
In a realistic galaxy, this flux is a local quantity which applies only to star forming regions. In areas where the cold gas density is initially very low, the AGN outflow may not be able to trigger star formation at all. Observationally, this means that if the star forming regions in the galaxy are not resolved, the observed star formation flux is lower than given in eq. (20). Therefore, we introduce a factor
| (21) |
to account, in a crude fashion, for the clumpiness of the cold gas distribution. In the “maximum starburst” model that we consider for simplicity, .
The total luminosity of the starburst is found by integrating the flux and allowing for cold gas clumpiness:
| (22) |
If we take the outer radius of the starburst to be kpc (this radius is of the same order as scale radii of typical galaxy discs), the luminosity becomes
| (23) |
for typical parameters in the “maximum starburst” model. In this model, the starburst luminosity can surpass that of the AGN by an order of magnitude or more. The galaxy undergoing such a starburst would appear as a ULIRG.
In a more realistic setting the starburst luminosity may be reduced due to clumpiness of the cold gas distribution. If does not vary by huge factors between different galaxies, we expect the AGN and starburst luminosities to be comparable:
| (24) |
We compare this result with observations in Section 6.2.3.
The integrated star formation rate in the galaxy,
| (25) |
is as large as in the most vigorous starbursts known (Chapman et al., 2004).
We now investigate the galactic disc response in more detail, using a numerical model. Structures with different geometry would respond in slightly different ways, but we do not consider these complications, concentrating on the properties of the AGN event and how it is reflected in the star formation within the disc.
4 Numerical model
The numerical model we use is based on a semi-analytical integrator routine that follows the dynamics of a spherically symmetric outflow. We combine this calculation with a 1D grid where we calculate the response of the disc to the external pressure, including the star formation rate and the luminosity produced by the starburst and the young stars.
The outflow propagation is calculated using the analytical expressions from King (2005) and Zubovas & King (2012b), which are then integrated numerically for an arbitrary choice of an (analytical) background potential, black hole mass and luminosity and mean gas fraction in the bulge and halo of the galaxy. We have previously used this integrator in King et al. (2011) and Zubovas & King (2012b) and have now updated the time-stepping in order to better track outflow propagation at early times. The numerical results agree perfectly with the analytical solutions (where these are possible King et al., 2011).
At each timestep, the pressure of the outflow is calculated using the analytical expressions from Section 2.2 on a logarithmically spaced grid with 200 bins spanning a radial range from to kpc. We assume that the pressure between the contact discontinuity and the outer shock varies linearly. The pressure just outside the cooling radius, however, drops exponentially toward the value of (eq. 9), with a scale radius . This value is plausible to within an order of magnitude based on pressure balance, and the precise numbers are not important to the end result. If the outflow reaches a maximum radius and begins to collapse, we do not allow pressure to increase, as this is not physical (a real outflow would fragment and dissipate rather than collapse spherically). Rather, we let all pressures drop linearly with time after the maximum radius is reached, to mimic this dissipation and radiative cooling of the outflowing material.
The star formation rate density is calculated separately in each bin using equation (15). Then we calculate the star formation rate
| (26) |
where is the radius of the given bin and is its width. We then update the total mass formed in that bin since the start of the simulation and compare this mass with the total gas mass expected to be available in the pristine disc at that radius; for the latter, we use the analytical expression for disc gas distribution from Mo et al. (1998). If , we set and in that annulus.
Once we know the correct star formation rate, the mass of newly formed stars and the stellar surface density, we calculate their emitted flux and luminosity . To do this, we split the stellar population into two sub-populations: low-mass stars and massive stars. For a Salpeter IMF, the fraction of mass contained in stars with is . The low-mass stars are assumed to radiate with a constant luminosity, and we assign their sub-population a mass-to-light ratio . Most massive stars radiate at a good fraction of their Eddington luminosity; we take that fraction to be , which corresponds to a mass-to-light ratio , but their mass decreases exponentially on a timescale of Myr, simulating their short lifetimes. The flux of both populations is therefore proportional to their surface densities; the low-mass star surface density can only grow as new stars are formed, but the massive stars can both be created and die.
With this setup, we explore a small part of the vast parameter space by considering five cases of varying outflow and disc properties. In all the cases, we use the same background NFW potential, described in Section 2. In the ‘Base’ run, we set the initial SMBH mass equal to the theoretical value and allow it to grow and radiate at the Eddington limit for an unlimited time. In the ‘Low-tq’ run, we turn the AGN off (i.e. set the luminosity and the mass growth of the SMBH to zero) after Myr to see what an effect a short burst has. In the ‘Low-SFR’ run, we reduce by a factor to allow for gas clumpiness (see Section 3) and other processes that can reduce the SFR. In the ‘Low-M0’ run, the initial SMBH mass is set to to find out what happens if a black hole slightly under the formal mass limit drives a large-scale outflow. Finally, the ‘Channel’ case represents a situation where the outflow is effectively channelled away from the plane of the galaxy, only affecting the disc within kpc of the centre. We emphasise that we do not intend to cover all possible situations and configurations with these cases, but merely attempt to show the variations that can be expected within this model.
5 Results
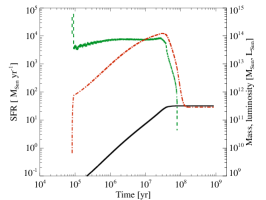
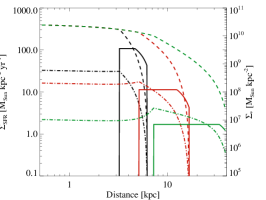
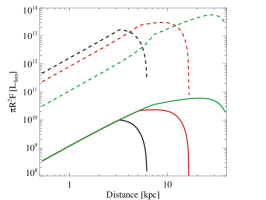

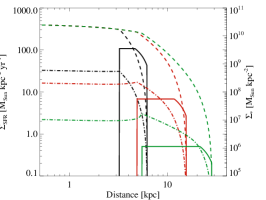
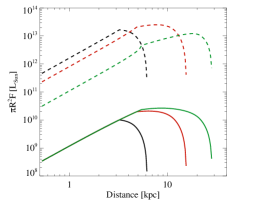
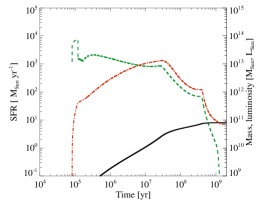
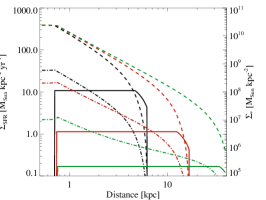
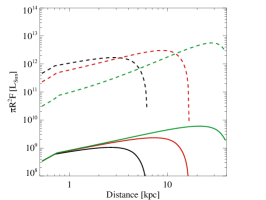
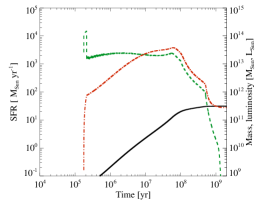
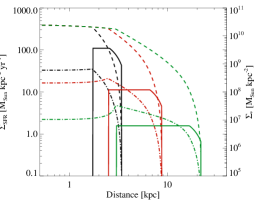
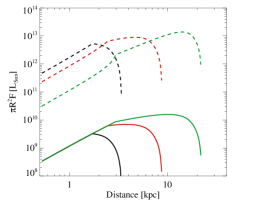
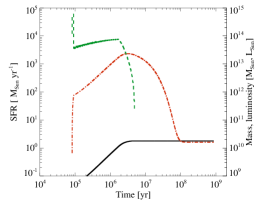
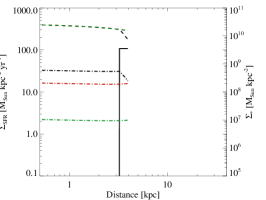
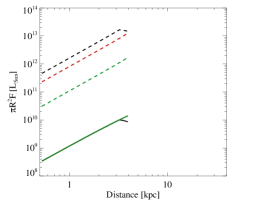
For each run, we present the results (Figures 2 to 6) in three plots. The first plot (left panel) shows the time dependence of star formation rate (green dashed line, scale on the left; the jitter is caused by numerical effects), total mass of gas converted into stars (black solid line, scale on the right) and the total luminosity of the starburst (red dot-dashed line, scale on the right). The two other plots show radial profiles of various quantities at 3, 10 and 30 Myr (black, red and green lines, respectively). In the middle panels, the solid lines show the star formation rate density (scale on the left), the dashed and dot-dashed lines show the surface density of low-mass and massive stars, respectively. In the right-hand-side panels, the quantity is shown for low-mass and massive stars (solid and dashed lines, respectively).
5.1 Base run
The physical processes occurring as the outflow washes past the disc are the same as described analytically. Once the outflow moves past the cooling radius, the disc is strongly compressed and begins forming stars; this happens at around yr after the start of the AGN episode. The initial burst of star formation is very strong, reaching almost yr-1, due to the high pressure just outside the cooling radius. Gas at this annulus is rapidly consumed, however, and an approximately constant star formation rate of yr-1 persists for Myr. During this time, all of the disc gas () is converted into stars. The stellar luminosity, dominated by the massive stars, increases with the converted mass, reaching a maximum of just over at Myr and the drops as the massive stars die out. After yr, the luminosity settles at generated by the long-lived low-mass stars.
Although the total gas content is consumed in Myr, the consumption timescale decreases for smaller radii. Looking at the middle panel of Figure 2, we see that at any given time, star formation is occurring in a ring, bounded on the inside by the radius within which all of the gas has already been consumed by star formation (we call this the depletion radius ) and on the outside by radius which the AGN outflow has reached. The decreasing star formation density in the outer part of this ring corresponds to the decreasing pressure in the shell of shocked ambient material outside the contact discontinuity.
The density of low-mass stars, as well as their flux, follows the shape of the original gas surface density in the disc within and decreases to zero through the width of the star-forming ring. This, of course, does not mean that there could not have been stars in the disc before the outflow. Rather, the dashed lines represent the surface density of young low-mass stars. The density of massive stars, on the other hand, decreases with time as the stars die out. The radial profile of this density shows that, especially at later times, a well-pronounced ring of young massive stars develops around , with few stars remaining well inside it and few stars having been born well outside.
5.2 Short AGN activity
When the AGN switches off after Myr of activity (Figure 3), its outflow begins to stall, eventually reaches some maximum radius and subsequently collapses back on the galaxy. The pressure inside the outflow, as well as the star formation rate, start decreasing immediately and fall by an order of magnitude in Myr. The peak luminosity is reached earlier, at Myr, and is a factor lower than in the ‘Base’ run. Also, some disc gas is never converted into stars - the total converted mass is only at yr, a time beyond which our calculation is no longer a fair representation of the physical processes occurring as the outflow bubble collapses.
Radial plots of SF properties (middle and right panels) show that the remaining disc gas is located on the outskirts. The central regions are still efficiently converted into stars. The situation at Myr is, of course, identical to the ‘Base’ run, and even at Myr, there is very little difference between the two cases. Only at Myr the difference becomes significant, with both the inner and the outer edges of the star-forming ring being much closer to the centre than in the ‘Base’ run. The corresponding stellar densities and fluxes are also lower.
5.3 Lower star formation rate
Reducing the star formation rate by a factor of (Figure 4) has the expected effect: the star formation rate and the total luminosity of young stars drop by a similar factor. The peak of luminosity occurs at the same time as in the ‘Base’ run. However, the decline after the peak is slower, owing to the larger amount of gas remaining throughout the disc. The sudden drop of both these quantities at yr correspond to the point where the outflow velocity formally reaches and becomes fixed at that value, leading to a drop in pressure.
The total mass of gas converted into stars is of the initial disc gas mass. Gas is consumed very slowly throughout the disc; the middle panel shows that between and Myr, only a ring pc wide is fully consumed. Even at yr after the start of AGN activity, gas is completely converted into stars only within pc, with the fractional conversion as low as at kpc. The stellar density and luminosity plots follow the same trend and have significantly lower values than in the ‘Base’ run.
5.4 Low initial SMBH mass
When the black hole mass is 10 times lower than the value, i.e. , the evolution of the star formation rate is surprisingly similar to the ‘Base’ run (Figure 5). The star formation rate is approximately proportional to the outflow pressure which is, in turn, approximately proportional to . Hence the star formation rate and the associated luminosity of young stars are both approximately 5 times lower than in the ‘Base’ run. The radial profile plots reveal that the star formation rate at a given time is roughly the same in both cases, but the star-forming ring is approximately twice closer to the SMBH than in the ‘Base’ run; this is again expected, as . The width of each ring is almost identical in either case in logarithmic space. The fraction of gas converted into stars is almost , however, because the starburst lasts longer.
5.5 Channelled outflow
Finally, we confine the effects of the AGN outflow to a region kpc of the disc. As might be expected, the evolution of the starburst follows the ‘Base’ run precisely until Myr, when the outer shock of the outflow reaches the confinement radius. Then the star formation rate declines very rapidly, as gas in the central parts of the disc is consumed within Myr. The stellar luminosity decrease is slightly slower, but by yr, all the massive stars have died out and only the low-mass stars remain (see the red dot-dashed curve in the left panel of Figure 6).
5.6 Result summary
Our semi-analytical model shows that the induced star formation in a galaxy disc can be surprisingly varied, depending on just a few initial parameters. Nevertheless, a common trend emerges that the disc can be strongly affected and the starburst can consume a large fraction of the gas. This implies that even though such powerful galactic outflows are rare in spiral galaxies, they can have a lasting impact on the stellar population of the host galaxy. We discuss the implications of these results in the next section.
6 Discussion
The current paradigm of AGN connection to their host galaxies is based on negative feedback, i.e. AGN activity is considered as the agent quenching star formation in its host, by expelling the gas on short timescales. Our results indicate that this is not the full picture. While it is true that an energy-driven (i.e. non-cooling) AGN outflow clears diffuse gas out of the bulge and halo of its host galaxy, the effect on the galaxy disc and any dense structures is opposite. Soon after the AGN switches on and begins driving a large-scale outflow, the pressure in the outflowing gas initiates a starburst in the disc (see discussion in Section 6.1). Therefore we expect that bright AGN in spiral galaxies, capable of driving energy-driven outflows out to large distances in their hosts, are accompanied by starbursts in the galaxy discs. We predict a sub-linear scaling between starburst and AGN luminosities (Section 6.2.3) and a number of morphological properties of the starburst (Section 6.2.1) that are consistent with current observations (Section 6.4). We review these points in detail below.
In general, one may expect a correlation between AGN and starbursts simply because both are fed by gas within the galaxy and so more gas-rich galaxies are more likely to have both starbursts and AGN. However, such a correlation cannot be very tight, because AGN must be fed by small angular momentum gas (Hobbs et al., 2011), whereas star formation can easily take place in gas with very large angular momentum, e.g., in the galactic disc with length scale kpc. More specifically, Nayakshin et al. (2012) argued that AGN cannot be fed very efficiently via galaxy discs in which case AGN accretion and star formation in the disc are completely decoupled. They based their argument on the observations of pseudo-bulge galaxies that show under-weight blackholes (Hu, 2008; Graham, 2008) which poorly correlate with their host’s properties (Kormendy et al., 2011). Nayakshin et al. (2012) suggest that galaxy discs in the systems with under-weight SMBH are turned into stars much more rapidly than their SMBH could grow. This exemplifies how AGN activity and star formation could be decoupled.
We comment on the importance of various starburst properties and how they can help distinguish between ‘coincidental’ and triggered starbursts below.
6.1 Observational evidence of triggered star formation
A major component of our model is the connection between external pressure in an AGN outflow and enhanced star formation in the galaxy disc. Observations of many star-forming regions show that the fraction of gas converted into stars per dynamical time is a few percent in ‘normal’ (i.e. average density) environments, but rises in regions of galaxy discs where the gas surface density pc-2 (Bigiel et al., 2008). There have been two conflicting interpretations of this phenomenon. One argument is that at this density, diffuse gas pressure upon molecular clouds starts to dominate over the turbulent pressure of the clouds themselves, leading to cloud confinement and enhanced star formation (Krumholz et al., 2009). This model is based on the fact that external pressure affects two of the three main parameters governing the star formation rate: molecular hydrogen fraction and free-fall timescale in the clouds (Krumholz et al., 2009). Higher external pressure compresses the gas to higher density, which enhances cooling and thus formation of molecules, and shortens the gas free-fall time. Other models claim that simple self-regulation of star formation by the interplay of turbulence and self-gravity explains the increased SF efficiency without requiring external pressure (Faucher-Giguere et al., 2013). Importantly, however, the latter model assumes that the diffuse ISM pressure upon clouds is negligible. In our model, the external pressure always dominates above the cloud turbulent pressure ( dyn cm-2), so the model of Krumholz et al. (2009) may still be applicable.
On the other hand, extensive observations of star forming clouds in M82 (Keto et al., 2005) revealed that star formation happens only in clouds or even sections of clouds that are compressed by the diffuse ISM, while uncompressed clouds or sections of clouds do not show star formation. The inward motions of compressed clouds are highly supersonic and hence consistent with shock waves driven by external pressure but inconsistent with pure gravitational contraction. This dichotomy between compressed star-forming and uncompressed quiescent clouds is independent of cloud density either, further revealing that cloud self gravity is not the dominant trigger of star formation.
Molecular clouds have been observed that are both affected by radiation pressure and ionization (Sugitani et al., 1989; Sugitani et al., 1991; Sugitani & Ogura, 1994) or shocks from nearby supernova explosions (Preibisch & Zinnecker, 1999) and have higher star formation efficiency than their unaffected counterparts. Stars formed due to such triggering also have more uniform ages (Preibisch & Zinnecker, 1999) than typical young star clusters.
Effects of nearby external sources, such as supernova shocks and/or radiation from massive stars, on the star formation process have been investigated in great detail (Klein et al., 1980; Bertoldi, 1989; Kessel-Deynet & Burkert, 2003; Dale et al., 2007; Bisbas et al., 2011). It is now well known that both blast waves from supernova explosions and ionizing radiation from massive stars can compress gas in molecular clouds, enhancing its density and making collapse more likely. Although some details of this radiation-driven implosion of molecular clouds are different from our model, the central tenet that increased external pressure leads to increased star formation rates is well supported by observations.
6.2 Observational appearance of an AGN-triggered starburst
6.2.1 Starburst morphology
The morphology of the outflow and the resulting starburst depends on the distribution of cold gas in the galaxy itself. In the simplest model of an axially symmetric spiral galaxy, the outflow is also axially symmetric and propagates radially outward from the galaxy’s centre. Assuming that all the cold gas in the galaxy resides in a disc, young stars are born in a disc as well, with a ring of ongoing star formation surrounding its outskirts. As the starburst proceeds, massive stars in the central regions begin to die out and the luminosity decreases there. Eventually, the luminosity of the disc edges becomes higher than in the middle, although this effect is weak and depends strongly on the underlying cold gas density, so would be difficult to detect (see the dot-dashed lines in the middle panels of all result plots).
Real galaxies, however, are not completely axisymmetric, and the finer detail of galactic disc structure may be imprinted in the starburst shape. Molecular gas is concentrated in large cloud complexes in spiral arms (Reuter et al., 1996; Brouillet et al., 1998), so most of the star formation happens in these clumps. Nevertheless, the AGN outflow propagates through the halo rather than the disc, and so the outflow properties are independent of disc morphology. As a result, the outflow moves with approximate axial symmetry, so the starburst is still confined to clumps within a circular region centred on the AGN.
Depending on relative densities and masses of the molecular cloud regions, gas consumption (and, hence, star formation) timescales may vary strongly between them, so that the details of starburst morphology become irregular. In this case, the regions of ongoing star formation and clusters of young stars may be distributed asymmetrically throughout the starburst region.
6.2.2 Star formation efficiency
In our models, the fraction of gas converted into stars is typically very large, . In the ‘Base’ model, all of the gas is converted in a few times yr, less than a dynamical time in the galaxy ( yr). ‘Low-M0’ converts all the gas in approximately one dynamical time. We see that AGN-triggered star formation can be very efficient.
There are several possible complications to this simple picture. First of all, AGN activity episodes only last a few to Myr (Rawlings & Saunders, 1991). We consider the effect of a short activity episode in the ‘Low-tq’ model. There, we find that of the gas is converted into stars after one dynamical time. Thus even a short burst of AGN activity can significantly affect the disc of its host galaxy.
A further complication arises due to the small-scale effects, such as turbulence, magnetic fields, non-uniform feedback from massive stars and the multiphase nature of the disc gas, affecting the star formation rate in any given region. We estimate their importance in the model ‘Low-SFR’, where star formation rate is reduced by a factor 10. Even there, of the gas is converted into stars after one dynamical time, much more than the few per cent typical of “standard” star formation regions.
While the uncertainties involved in the calculation of the actual star formation efficiency prevent us from making definitive quantitative statements regarding the star formation efficiency, we believe that a significant increase in SFE above that of undisturbed star formation regions is a robust conclusion.
6.2.3 Starburst luminosity
The ratio of starburst and AGN luminosities determines, to a large extent, the appearance of the galaxy in different wavebands. The analytically predicted ratio (eq. 24), and the results of numerical calculations (, to be compared with the Eddington luminosity for an SMBH on the relation) agree well with with the observed AGN contribution to total ULIRG luminosity, which is (Genzel et al., 1998).
The sub-linear scaling of starburst luminosity with AGN luminosity (, see Section 3) can be understood in terms of AGN outflow propagation. Lower mass (and lower luminosity) SMBHs take longer to develop host-sweeping outflows since the outflow energy production rate is proportional to . However, outflows then linger in the host for longer, since their velocity is proportional to . Therefore small or low luminosity AGN remain relatively more effective in triggering starbursts than could be naively expected.
6.2.4 Stellar ages
An energy-driven AGN outflow moves with a velocity km/s and passes through the galaxy disc in several tens of Myr. Significant amounts of gas are consumed within the affected parts of the disc on a similar timescale. Even if the AGN switches off, the outflow persists for more than an order of magnitude longer than the driving phase (King et al., 2011, see also Figure 3) and gas is consumed efficiently. Therefore the ages of stars formed during the starburst differ by Myr. Such a uniform-age stellar population throughout the galaxy is a potentially strong indicator of an AGN-induced starburst in the past. Recent observations of the star cluster population in M82 (Lim et al., 2013) reveal a large number of clusters with a mean age of Myr found everywhere in the galaxy disc. Our model predicts that these cluster were created during and just after an AGN activity episode Myr ago. M82 is known to have interacted tidally with a companion galaxy M81 Myr ago (de Grijs et al., 2001); this interaction may have caused a rapid gas inflow into the central regions of M82, triggering an AGN episode.
This simple picture can be complicated by several effects. First of all, AGN activity episodes may recur every Myr and produce a new starburst. These starbursts should be weaker, however, since the gas density in the spheroidal components of the galaxy decreases significantly after the first outflow clears it, therefore subsequent outflows have lower pressure. Nevertheless, the star formation history of a galaxy would show several peaks with spreads that may be comparable to the duration between them, blurring the stellar age profiles. In addition to this, subsequent activity episodes may be triggered by the same gas that was once removed from the galaxy cooling and recollapsing; in that case, the outflow has a similar gas density to the previous one, further obscuring the bursty star formation history of the galaxy.
6.3 Comparison with merger-triggered starbursts
It is well-known that galaxy mergers can also fuel starbursts by mixing gas, creating turbulence and shocks and altering the gravitational potential of the merging system. These processes create a complex and irregular morphology of the galaxy and the starburst, without any easily identified structure. Careful analysis of morphological differences should help distinguish between merger-induced and AGN-triggered starbursts (see Section 6.2.1).
First of all, the morphology of the whole galaxy may indicate the origin of the starburst. In our model, the starburst happens in a galaxy disc or dense structures engulfed by the outflow. Major galaxy mergers usually leave elliptical remnants. However, Springel & Hernquist (2005) showed that mergers of extremely gas-rich spirals preserve galactic discs. Therefore a galaxy with a disc undergoing a starburst was not necessarily induced by an AGN. Minor mergers do not destroy galaxy discs either, but cause compact starbursts and/or fuel the AGN. These starbursts, however, are likely to be asymmetric due to the asymmetric interaction between the galaxy and its satellite, and therefore they should be distinguishable for AGN-triggered starbursts.
If the minor merger triggers AGN activity, the resulting outflow passes through disturbed material and the AGN-triggered starburst can be as irregular in the central parts of the galaxy as the one triggered directly by the merger. The tell-tale sign of AGN-induced star formation activity in this case may be outward velocities of young stars in regions directly exposed to AGN feedback, as shown in Nayakshin & Zubovas (2012) and Zubovas et al. (2013). In those papers, we studied the impact of the AGN outflow ram pressure on the outflowing gas, finding that the outer outflowing shell itself can fragment and produce stars. In an irregularly shaped galaxy, the outflowing gas encounters many dense clumps, which can be accelerated and even ejected from the galaxy. In principle, isotropic ejection of stars, as opposed to tidal tails from merging galaxies, could be used to distinguish between the two starburst causes, but in practice this would require very detailed observations and identification of stellar orbits, which is not currently feasible.
Finally, in the cases where a galaxy merger triggers both a starburst and an AGN, the latter usually follows the former with a delay of yr (Schawinski et al., 2007). In our model, the opposite is true - the starburst begins a few Myr after the AGN turns on. While it is difficult to measure the ages of AGN, in principle this difference could be used to distinguish between the two regimes. A recent discovery of a high-redshift QSO with a nearby cluster of young stars (Rauch et al., 2013) shows that AGN triggering of star formation may be detected.
6.4 Observational evidence for AGN-triggered star formation
Direct observational evidence of starbursts triggered by AGN activity is difficult to find due to briefness of AGN phases, uncertainty of the age of any given AGN and the confusion between AGN and starburst contributions to total galaxy luminosity.
Many Ultra-luminous IR galaxies (ULIRGs) and Narrow-line Seyferts (NLSs) show both starburst and AGN activity (Genzel et al., 1998; Farrah et al., 2003; Sani et al., 2010) and starbursts typically have ages between and yr in the nuclear regions (Genzel et al., 1998), which is consistent with typical AGN activity durations (Rawlings & Saunders, 1991; Martini & Weinberg, 2001; Hopkins et al., 2005). However, this only shows that AGN and starbursts are coincident, but does not reveal which one causes, or even precedes, the other (Lutz et al., 1998).
Some galaxies hosting both starbursts and AGN are at least consistent with our model. For example, the starburst luminosity in Seyfert galaxies increases with SMBH mass and luminosity (Sani et al., 2010); we predict the same (see Section 6.2.3). In fact, our predicted relation is very similar to observed correlations: (Sani et al., 2010) and (Netzer, 2009). The same observations also show starburst luminosity increasing with increasing Eddington ratio of the AGN: . Although our model (eq. 23) predicts the opposite (if weak) trend, this happens because , and the black hole mass are not independent variables. When the relation is recast in terms of and (as was done by Sani et al., 2010), we find .
Recently, LaMassa et al. (2013) investigated a large sample of active galaxies at various redshifts and found that star formation in the central few kpc is positively, but sub-linearly, correlated with AGN luminosity. This is consistent with our picture of a strong starburst due to high outflow pressure close to the SMBH, decreasing in strength as the outflow moves further out. On the other hand, central starbursts can easily be interpreted as fuelling the AGN rather than being triggered by the central source (Thompson et al., 2005).
Another piece of evidence comes from observations of radio-selected AGN that also have starburst activity. Karouzos et al. (2013) show that in a sample of more than a hundred radio AGN, the more luminous ones show more star formation than would be expected from standard models based on galaxy properties (Elbaz et al., 2011). Also, galaxies with lower radio loudness (i.e. more likely to be accreting in the ‘quasar-mode’) also show higher star formation rates than would be expected from empirical models of galaxy evolution. Finally, in the same sample, AGN contribution to the total bolometric luminosity of the sources is typically , with a slight increase toward brighter AGN. All together, these properties are consistent with our predictions in much the same way as observations of Seyfert galaxies are.
Finally, there is some evidence that ULIRGs have more compact H II regions than other types of star-forming galaxies (Lutz et al., 1998); this could happen if gas in these galaxies is strongly compressed.
We conclude from this section that observational evidence of AGN triggering star formation in spiral galaxies is inconclusive, but generally consistent with the predictions of our model.
6.5 Fermi Bubbles – an outflow in a gas-poor galaxy
The model described in this paper is mainly applicable to outflows in gas-rich spiral galaxies. Once such an outflow passes, however, the galaxy is left gas-poor: bulge and halo gas has been expelled, while disc gas has been turned into stars (see Section 6.2.2, above). Our Milky Way is an example of such a gas-poor spiral galaxy. An energy-driven AGN outflow may still occur in these galaxies; it moves much faster, and in the Milky Way may have been the cause of the Fermi bubbles (Zubovas et al., 2011; Zubovas & Nayakshin, 2012). This outflow did not cause a large-scale starburst in the galaxy disc, because both the density in the outflowing material was much lower than envisioned here, and the AGN luminosity powering it was low enough (due to the low mass of Sgr A∗) to make the pressure too low to cause a noticeable effect. The gas fraction was and the velocity was km/s, creating a pressure 2 orders of magnitude lower than in the disc of a typical gas-rich galaxy that we considered in this paper. This pressure becomes comparable to the typical ISM pressure once the outflow gets out to a few kpc, so any effect it may have is confined to the central regions of the galaxy. Indeed, in our simulations of the Fermi bubbles (Zubovas & Nayakshin, 2012), we find that the -pc-wide Central Molecular Zone of the Galaxy is perturbed, leading to gravitational fragmentation and possible star formation. Other gas-poor galaxies would show similar effects after AGN outflows; their presence may be used to infer past AGN activity even when the more direct evidence is gone.
6.6 Comparison to other work
Positive effects of AGN feedback on the host galaxy’s stellar content have been investigated several times in the past few years. Silk (2005), Silk & Norman (2009, both analytical investigations) and Gaibler et al. (2012, numerical simulations) consider a jet-driven outflow from an active SMBH, which pressurises the ISM and increases its turbulence, leading to a burst of star formation. Depending on the parameters of the ISM, the jet can either produce a starburst along a narrow beam or a more wide-spread one, encompassing most of the galaxy. Numerical simulations give jet-induced star formation rates of a few hundred yr-1 distributed in an expanding ring and limited by diffuse gas removal from the galaxy by the jet. Silk (2005) does not provide estimates for star formation rate, but considers a spherical geometry, so that model is appropriate for starbursts in elliptical galaxies.
Ciotti & Ostriker (2007) use high-resolution numerical simulations to investigate AGN feedback effect on ISM thermodynamics, with effects on star formation being a secondary result. They find that radiative AGN feedback can trigger repeated nuclear starbursts, again with star formation rates of several hundred yr-1, but not necessarily related to large-scale outflows. The starbursts in our model are larger in both physical extent and SFR, so a direct comparison is not warranted.
Ishibashi et al. (2013) consider a model where a momentum-driven AGN outflow shell expands and simultaneously forms stars at some efficiency. They use this prescription to explain the inside-out growth of galaxies since , as these shells deposit stars preferentially at large radii. However, since the model is very simplistic and does not deal with dense structures compressed by the outflow, we do not compare our results to theirs directly.
7 Summary and conclusion
We have shown, using analytical arguments and a semi-analytical model, that powerful AGN outflows in spiral galaxies may have a strong positive effect on the galaxy disc. The disc gas is compressed by the outflow as the latter passes on either side of the disc. This leads to an enhancement in star formation rates and causes most of the gas in the disc to be turned into stars. The starburst continues for several to several tens of Myr even after the AGN switches off, provided there is enough gas left in the disc.
Observationally, such a galaxy would appear as a ULIRG with an almost flat central young star luminosity density, with this disc surrounded by a ring of ongoing star formation. The AGN component might exist, but would be subdominant to the total luminosity of the starburst. These properties are consistent with some observations of ULIRGs, however it is very difficult to disentangle the causal connection between a starburst and an AGN and as such, it may be some time before strong evidence in support of this model is found.
It is interesting to consider our results in the broader context of the effect of AGN activity on star formation in the host galaxy. The difference between positive and negative feedback is rather clear in the spheroids of quiescent galaxies: gas-rich outflows cool and fragment, forming stars (Nayakshin & Zubovas, 2012), while gas-poor outflows simply clear the remaining gas from the galaxy (Zubovas & King, 2012a). This picture gets somewhat more complicated in mergers, where the outflow would propagate in a disturbed medium, compressing gas and trigerring fragmentation in some directions while blowing gas away in others. The current results show that whichever way feedback affects gas in the galaxy bulge and halo, the disc gets compressed and undergoes a starburst. The star formation rate, yr-1, is comparable to the mass outflow rate in the spherical energy-driven outflow, yr-1 (Zubovas & King, 2012a). Therefore it appears that the net effect of an energy-driven AGN outflow is a quickening of galaxy evolution, rather than a strictly negative or strictly positive feedback.
Acknowledgments
Theoretical astrophysics research in Leicester is supported by an STFC Rolling Grant. KZ thanks the UK STFC for support successively in the form of a studentship and a postdoctoral research associate position. MIW acknowledges the Royal Society for financial support.
References
- Aller & Richstone (2007) Aller M. C., Richstone D. O., 2007, ApJ, 665, 120
- Bertoldi (1989) Bertoldi F., 1989, ApJ, 346, 735
- Bigiel et al. (2008) Bigiel F., Leroy A., Walter F., Brinks E., de Blok W. J. G., Madore B., Thornley M. D., 2008, AJ, 136, 2846
- Bisbas et al. (2011) Bisbas T. G., Wünsch R., Whitworth A. P., Hubber D. A., Walch S., 2011, ApJ, 736, 142
- Brouillet et al. (1998) Brouillet N., Kaufman M., Combes F., Baudry A., Bash F., 1998, A&A, 333, 92
- Chapman et al. (2004) Chapman S. C., Smail I., Windhorst R., Muxlow T., Ivison R. J., 2004, ApJ, 611, 732
- Ciotti & Ostriker (1997) Ciotti L., Ostriker J. P., 1997, ApJL, 487, L105+
- Ciotti & Ostriker (2001) Ciotti L., Ostriker J. P., 2001, ApJ, 551, 131
- Ciotti & Ostriker (2007) Ciotti L., Ostriker J. P., 2007, ApJ, 665, 1038
- Dale et al. (2007) Dale J. E., Clark P. C., Bonnell I. A., 2007, MNRAS, 377, 535
- de Grijs et al. (2001) de Grijs R., O’Connell R. W., Gallagher III J. S., 2001, AJ, 121, 768
- Elbaz et al. (2011) Elbaz D., Dickinson M., Hwang H. S., Díaz-Santos T., Magdis G., Magnelli B., Le Borgne D., Galliano F., Pannella M., Chanial P., Armus L., Charmandaris V., Daddi E., et al. 2011, A&A, 533, A119
- Fabian (1999) Fabian A. C., 1999, MNRAS, 308, L39
- Farrah et al. (2003) Farrah D., Afonso J., Efstathiou A., Rowan-Robinson M., Fox M., Clements D., 2003, MNRAS, 343, 585
- Faucher-Giguère & Quataert (2012) Faucher-Giguère C.-A., Quataert E., 2012, MNRAS, 425, 605
- Faucher-Giguere et al. (2013) Faucher-Giguere C.-A., Quataert E., Hopkins P. F., 2013, ArXiv e-prints
- Feoli & Mele (2005) Feoli A., Mele D., 2005, International Journal of Modern Physics D, 14, 1861
- Ferrarese & Merritt (2000) Ferrarese L., Merritt D., 2000, ApJL, 539, L9
- Feruglio et al. (2010) Feruglio C., Maiolino R., Piconcelli E., Menci N., Aussel H., Lamastra A., Fiore F., 2010, A&A, 518, L155+
- Gaibler et al. (2012) Gaibler V., Khochfar S., Krause M., Silk J., 2012, MNRAS, 425, 438
- Gebhardt et al. (2000) Gebhardt K., Bender R., Bower G., Dressler A., Faber S. M., Filippenko A. V., Green R., Grillmair C., Ho L. C., Kormendy J., Lauer T. R., Magorrian J., Pinkney J., Richstone D., Tremaine S., 2000, ApJL, 539, L13
- Genzel et al. (1998) Genzel R., Lutz D., Sturm E., Egami E., Kunze D., Moorwood A. F. M., Rigopoulou D., Spoon H. W. W., Sternberg A., Tacconi-Garman L. E., Tacconi L., Thatte N., 1998, ApJ, 498, 579
- Graham (2008) Graham A. W., 2008, ApJ, 680, 143
- Gültekin et al. (2009) Gültekin K., Richstone D. O., Gebhardt K., Lauer T. R., Tremaine S., Aller M. C., Bender R., Dressler A., Faber S. M., Filippenko A. V., Green R., Ho L. C., Kormendy J., Magorrian J., Pinkney J., Siopis C., 2009, ApJ, 698, 198
- Häring & Rix (2004) Häring N., Rix H.-W., 2004, ApJL, 604, L89
- Hobbs et al. (2011) Hobbs A., Nayakshin S., Power C., King A., 2011, MNRAS, 413, 2633
- Hopkins et al. (2005) Hopkins P. F., Hernquist L., Martini P., Cox T. J., Robertson B., Di Matteo T., Springel V., 2005, ApJL, 625, L71
- Hu (2008) Hu J., 2008, MNRAS, 386, 2242
- Ishibashi et al. (2013) Ishibashi W., Fabian A. C., Canning R. E. A., 2013, MNRAS, 431, 2350
- Jog & Solomon (1992) Jog C. J., Solomon P. M., 1992, ApJ, 387, 152
- Karouzos et al. (2013) Karouzos M., Trichas M., Im M., Malkan M., the AKARI-NEP team 2013, ArXiv e-prints
- Kessel-Deynet & Burkert (2003) Kessel-Deynet O., Burkert A., 2003, MNRAS, 338, 545
- Keto et al. (2005) Keto E., Ho L. C., Lo K.-Y., 2005, ApJ, 635, 1062
- King (2003) King A., 2003, ApJL, 596, L27
- King (2005) King A., 2005, ApJL, 635, L121
- King (2010) King A. R., 2010, MNRAS, 402, 1516
- King et al. (2011) King A. R., Zubovas K., Power C., 2011, MNRAS, pp L263+
- Klein et al. (1980) Klein R. I., Sandford II M. T., Whitaker R. W., 1980, Sp.Sci.Rev., 27, 275
- Kormendy et al. (2011) Kormendy J., Bender R., Cornell M. E., 2011, Nature, 469, 374
- Krumholz et al. (2009) Krumholz M. R., McKee C. F., Tumlinson J., 2009, ApJ, 699, 850
- LaMassa et al. (2013) LaMassa S. M., Heckman T. M., Ptak A., Urry C. M., 2013, ApJ, 765, 33
- Leitherer et al. (1992) Leitherer C., Robert C., Drissen L., 1992, ApJ, 401, 596
- Lim et al. (2013) Lim S., Hwang N., Lee M. G., 2013, ApJ, 766, 20
- Lutz et al. (1998) Lutz D., Spoon H. W. W., Rigopoulou D., Moorwood A. F. M., Genzel R., 1998, ApJL, 505, L103
- Magorrian et al. (1998) Magorrian J., Tremaine S., Richstone D., Bender R., Bower G., Dressler A., Faber S. M., Gebhardt K., Green R., Grillmair C., Kormendy J., Lauer T., 1998, AJ, 115, 2285
- Marconi & Hunt (2003) Marconi A., Hunt L. K., 2003, ApJL, 589, L21
- Martini & Weinberg (2001) Martini P., Weinberg D. H., 2001, ApJ, 547, 12
- McLaughlin et al. (2006) McLaughlin D. E., King A. R., Nayakshin S., 2006, ApJL, 650, L37
- Mo et al. (1998) Mo H. J., Mao S., White S. D. M., 1998, MNRAS, 295, 319
- Nayakshin et al. (2012) Nayakshin S., Power C., King A. R., 2012, ApJ, 753, 15
- Nayakshin & Zubovas (2012) Nayakshin S., Zubovas K., 2012, MNRAS, 427, 372
- Netzer (2009) Netzer H., 2009, MNRAS, 399, 1907
- Preibisch & Zinnecker (1999) Preibisch T., Zinnecker H., 1999, AJ, 117, 2381
- Rauch et al. (2013) Rauch M., Becker G. D., Haehnelt M. G., Carswell R. F., Gauthier J.-R., 2013, MNRAS, 431, 68
- Rawlings & Saunders (1991) Rawlings S., Saunders R., 1991, Nature, 349, 138
- Reuter et al. (1996) Reuter H.-P., Sievers A. W., Pohl M., Lesch H., Wielebinski R., 1996, A&A, 306, 721
- Robitaille & Whitney (2010) Robitaille T. P., Whitney B. A., 2010, ApJL, 710, L11
- Rupke & Veilleux (2011) Rupke D. S. N., Veilleux S., 2011, ApJL, 729, L27+
- Sani et al. (2010) Sani E., Lutz D., Risaliti G., Netzer H., Gallo L. C., Trakhtenbrot B., Sturm E., Boller T., 2010, MNRAS, 403, 1246
- Schawinski et al. (2007) Schawinski K., Thomas D., Sarzi M., Maraston C., Kaviraj S., Joo S.-J., Yi S. K., Silk J., 2007, MNRAS, 382, 1415
- Silk (2005) Silk J., 2005, MNRAS, 364, 1337
- Silk & Norman (2009) Silk J., Norman C., 2009, ApJ, 700, 262
- Silk & Rees (1998) Silk J., Rees M. J., 1998, A&A, 331, L1
- Springel & Hernquist (2005) Springel V., Hernquist L., 2005, ApJL, 622, L9
- Sturm et al. (2011) Sturm E., González-Alfonso E., Veilleux S., Fischer J., Graciá-Carpio J., Hailey-Dunsheath S., Contursi A., Poglitsch A., et al. 2011, ApJL, 733, L16+
- Sugitani et al. (1989) Sugitani K., Fukui Y., Mizuni A., Ohashi N., 1989, ApJL, 342, L87
- Sugitani et al. (1991) Sugitani K., Fukui Y., Ogura K., 1991, ApJS, 77, 59
- Sugitani & Ogura (1994) Sugitani K., Ogura K., 1994, ApJS, 92, 163
- Thompson et al. (2005) Thompson T. A., Quataert E., Murray N., 2005, ApJ, 630, 167
- Toomre (1964) Toomre A., 1964, ApJ, 139, 1217
- Tremaine et al. (2002) Tremaine S., Gebhardt K., Bender R., Bower G., Dressler A., Faber S. M., Filippenko A. V., Green R., Grillmair C., Ho L. C., Kormendy J., Lauer T. R., Magorrian J., Pinkney J., Richstone D., 2002, ApJ, 574, 740
- Zubovas & King (2012a) Zubovas K., King A., 2012a, ApJL, 745, L34
- Zubovas & King (2012b) Zubovas K., King A. R., 2012b, MNRAS, 426, 2751
- Zubovas et al. (2011) Zubovas K., King A. R., Nayakshin S., 2011, MNRAS, 415, L21
- Zubovas & Nayakshin (2012) Zubovas K., Nayakshin S., 2012, MNRAS, 424, 666
- Zubovas et al. (2013) Zubovas K., Nayakshin S., Sazonov S., Sunyaev R., 2013, MNRAS, 431, 793