Low-velocity shocks traced by extended SiO emission along the W43 ridges: witnessing the formation of young massive clusters
Abstract
The formation of high-mass stars is tightly linked to that of their parental clouds. We here focus on the high-density parts of W43, a molecular cloud undergoing an efficient event of star formation. Using a column density image derived from Herschel111 Herschel is an ESA space observatory with science instruments provided by European-led Principal Investigator consortia and with important participation from NASA. submm continuum maps, we identify two high-density filamentary clouds, named the W43-MM1 and W43-MM2 ridges. Both have gas masses 2 above 10 and within areas of 6 and 14 pc2, respectively. The W43-MM1 and W43-MM2 ridges are structures coherent in velocity and gravitationally bound despite the large velocity dispersion as shown by the N2H+ (1–0) lines of the W43-HERO IRAM222The W43-HERO (W43 Hera/EmiR Observation) project is an IRAM 30m Large Program, named “Origins of molecular clouds and star formation in W43”, led by Frédérique Motte and Peter Schilke. The project description and data can be accessed here: http://www.astro.uni-koeln.de/projects/schilke/IRAMLargeProject/MainPage. IRAM is supported by INSU/CNRS (France), MPG (Germany) and IGN (Spain) Large Program. Another intriguing result is that these ridges harbour wide-spread (10 pc2) bright SiO (2–1) emission which we interpret as arising from low-velocity shocks (10 km s-1). We measure a steep relation between the SiO (2–1) luminosity and velocity extent and propose it to distinguish our observations from the high-velocity shocks associated with outflows. We use state-of-the-art shock models to demonstrate that low-velocity shocks with a small amount (10%) of Si atoms initially in gas phase or in grain mantles can explain the observed SiO column density in the W43 ridges. The spatial and velocity overlaps between the ridges high-density gas and the shocked SiO gas suggest that ridges could be forming via colliding flows driven by gravity and accompanied by low-velocity shocks. This mechanism may be the initial conditions for the formation of young massive clusters.
Subject headings:
stars: formation, stars: protostars, ISM: clouds, ISM: structure,ISM: HII regions, ISM: molecules1. Introduction
Though being an important entity in the energy budget and the cloud structure of galaxies, the origin of high-mass stars (OB-type, 8 ) are uncertain. An essential question is how they can gain such relatively large masses within their short protostellar lifetime (105-106 yr). Two main theoretical explanations were proposed to answer this question. In the quasi-static view, a high degree of turbulence allows the formation of a massive dense core inside which a powerful accretion develops to build up the stellar mass (e.g. Krumholz et al. 2009; Hosokawa & Omukai 2009). In the dynamical picture, competitive accretion and/or cloud formation generate colliding flows which then funnel gas to a large potential well (e.g. Bonnell & Bate 2006; Heitsch & Hartmann 2008; Inoue & Inutsuka 2009; Hartmann et al. 2012). Dynamical signatures such as gravitational streamers and shearing motions at molecular-cloud scales (10–100 pc; Nguyen Luong et al. 2011b), filamentary scales (1–10 pc; Schneider et al. 2010a; Hennemann et al. 2012) and protostellar core scales ( pc; Csengeri et al. 2011a, b), have been observed. All of these studies convey the idea that the formation of high-mass stars is tightly linked to the density, kinematics, and formation of their parental cloud.
HOBYS333The Herschel imaging survey of OB Young Stellar objects (HOBYS) is a Herschel key program. See http://hobys-herschel.cea.fr, a key mapping survey with Herschel is dedicated to the formation of OB-type stars within molecular complexes (Motte et al., 2010, 2012). It has shown that molecular clouds are dominated by networks of filaments and that clusters of high-mass protostars are forming in “cloud ridges” (Hill et al., 2011; Nguyen Luong et al., 2011a; Hennemann et al., 2012). These “ridges” are high-density (equivalent ), elongated cloud structures, which dominate and shape their surroundings. Clusters of massive stars are forming within these ridges, making them excellent candidate sites to host mini-starbursts, i.e. miniature and instant model of intense star formation activity (Hill et al., 2011; Nguyen Luong et al., 2011a). Schneider et al. (2012) also showed that intermediate-mass stellar clusters generally form at the junction of filaments. The density structure and star formation efficiency of ridges suggest that they have formed through dynamical processes such as colliding flows and/or filaments merging. In the converging flows theory, ridges can be the result of these large-scale processes that sweep up and accumulate gas mass (Ballesteros-Paredes et al., 1999; Hartmann et al., 2001; Inoue & Inutsuka, 2009). Alternatively, they could be formed by the gravitational focusing of gas toward large potential wells (Hartmann & Burkert, 2007). The massive dense cores are then formed within shock-compressed ridges, which were created by shock waves from cloud-cloud collision (Inoue & Fukui, 2013).
The W43 complex lies at 6 kpc from the Sun, at the meeting point of the Scutum-Centaurus (or Scutum-Crux) Galactic arm and the bar, a dynamically complex region where high-velocity streams could easily collide (Nguyen Luong et al., 2011b). The peculiar properties of W43 has been confirmed by the high-angular resolution observations of the CO (2–1) and C18O (2–1) lines of the W43-HERO IRAM Large Program (W43 Hera/EmiR Observations) (see Carlhoff et al. submitted). Close to its center, W43-Main is undergoing a remarkably efficient episode of star formation and qualifies as a mini-starburst (SFE , yr-1kpc-2; Motte et al. 2003). According to the criteria of Bressert et al. (2012), the W43-MM1 and W43-MM2 clouds are indeed good candidates to form the future young massive clusters (see Ginsburg et al. 2012). Among the 15 dense cores of W43-Main (0.2 pc FWHM size and 5 density) potentially forming high-mass stars are the three extremely massive, dense cores W43-MM1 ( ), W43-MM2 ( ), and W43-MM3 ( ) (Motte et al. 2003, confirmed by Bally et al. 2010). Adjacent to W43-Main is a giant H II region, illuminated by a cluster of Wolf-Rayet (WR) and OB stars, emitting Lyman continuum photons per second and a far-infrared continuum luminosity of (Smith et al., 1978; Blum et al., 1999; Bik et al., 2005). It is not yet clear what is the impact of this starburst cluster on the W43-Main cloud located 2–10 pc away (Motte et al., 2003; Bally et al., 2010). With its special characteristics, W43 represent for a type of molecular cloud complex which host high luminosity embedded clusters. Other examples can be found, such as W49 (Galván-Madrid in prep.) or W51 (Bieging et al., 2010).
Theoretically, a series of shocks are expected to emerge at the swept-up edges of turbulent colliding flows as a consequence of compression and shears of material (Koyama & Inutsuka, 2000; Heitsch et al., 2008). Detecting these shocks observationally will generate the firmest evidence for the collision and merging of several gas flows. Classically, SiO is the diagnostic of high-velocity shocks () in protostellar outflows (Schilke et al., 1997; Gueth et al., 1998; Gusdorf et al., 2008b). It has also been proven to trace medium- to high-velocity irradiated shocks ( to ) from hot cores/hot corinos (Hatchell et al., 2001; Jørgensen et al., 2011), and photon dominated regions (e.g. Schilke et al., 2001), or very high velocity shocks () in the Central Molecular Zone of our Galaxy (e.g. Martin-Pintado et al., 1997; Jones et al., 2012). SiO emission is also detected in the locations where protostellar outflows interact with local gas condensations (Lefloch et al., 1998). Most of the surveys performed toward high-mass protostars interpreted the SiO emission as solely tracing high-velocity protostellar outflows (e.g. Beuther & Sridharan, 2007; López-Sepulcre et al., 2011). When analyzing the SiO spectra of the Cygnus X massive dense cores, Motte et al. (2007) however felt the necessity to decompose the line in two shocked gas components: a broad one tracing the protostellar outflow and a narrow one interpreted as arising from the hot core. More recently, Duarte-Cabral et al. (2013, in prep) revisited the question of the SiO line profiles in Cygnus X and proposed that the narrow component is most probably associated with the shocks expected at the locations of the velocity shears observed by Csengeri et al. (2011a, b) at the scale of massive dense cores (0.1 pc). Jiménez-Serra et al. (2010) have also proposed that part of the extended SiO emission observed along IRDC G035.39–00.33 is associated with low-velocity shocks from colliding flows (see also Henshaw et al., 2013). This statement was confirmed, at one location of the filament, by the lack of intermediate- to high-mass protostars that could explain the SiO emission by shocks from a protostellar outflow or a hot core (see Nguyen Luong et al., 2011a).
In the present paper, we report the discovery of bright and wide-spread SiO emission along the W43-MM1 and W43-MM2 ridges, whose physical properties are constrained through Herschel maps, N2H+ (1–0) and SiO (2–1) spectral cubes. The paper is organized such that Sect. 2 describes the data employed, Sect. 3 characterizes the W43-MM1 and W43-MM2 cloud ridges, and Sect. 4 characterize their SiO emission. In Sect. 5, we showthat state-of-the-art models can create strong SiO emission with low-velocity shocks, and we propose that this is the origin of SiO emission we observe in W43 ridges. We also propose in Sect. 5 that the extended SiO emission directly relates to the formation of ridges and we discuss the implications for the subsequent high-mass star formation. We conclude and summarize our findings in Sect. 6.
2. Observations
To study the connection between the density and the velocity structures of W43-Main and the shock properties within this region, we used both continuum data from Herschel and SiO, N2H+ emission lines from the IRAM 30 m telescope.
2.1. Dust continuum imaging with Herschel
We used the Herschel images obtained from the Hi-GAL survey (Herschel Infrared Galactic Plane Survey, OBSIDs:1342186275 and 1342186276; Molinari et al. 2010) at with PACS (Poglitsch et al., 2010) and at with SPIRE (Griffin et al., 2010). We complemented the Hi-GAL nominal-mode dataset with SPIRE bright-mode observations from the HOBYS key program (OBSIDs: 1342239977 and 1342239978; Motte et al. 2010). The Hi-GAL data were taken in parallel mode with a fast scanning speed of 60 and the HOBYS data in SPIRE-only mode with a 30 scanning speed. The raw (level-0) data of each individual scan from both PACS and SPIRE were calibrated and deglitched using HIPE444HIPE is a joint development software by the Herschel Science Ground Segment Consortium, consisting of ESA, the NASA Herschel Science Center, and the HIFI, PACS, and SPIRE consortia. version 10.0. The SPIRE and PACS level-1 data were then fed to version 18 of the Scanamorphos software package555http://www2.iap.fr/users/roussel/herschel/ (Roussel, 2012), which subtracts brightness drifts by exploiting the redundancy of observed points on the sky, masks remaining glitches, and produces maps. The observational parameters of the Herschel images as well as the conversion factor from the original intensity units to MJy/sr are listed in Table 1.
| (µm) | HPBW | fa | 1 rms (MJy/sr) | Pixel | |
|---|---|---|---|---|---|
| /Camera | (″) | - | Hi-GAL | HOBYS | size (″) |
| 70/PACS | 5.8 | 21706 | 0.02 | - | 1.40 |
| 160/PACS | 11.4 | 5237 | 0.08 | - | 2.85 |
| 250/SPIRE | 18.1 | 115 | 1.00 | 0.1 | 4.50 |
| 350/SPIRE | 25.2 | 60 | 1.10 | 0.2 | 6.25 |
| 500/SPIRE | 36.9 | 27 | 1.20 | 0.4 | 9.00 |
Note: a Conversion factor from original units, Jy/pixel for PACS data and Jy/beam for SPIRE data, to MJy/sr.
The Hi-GAL dataset covers the entire W43 molecular complex but saturation occurs around the bright (200 Jy/beam) structures in the 250 and SPIRE images. The Hi-GAL saturated areas were corrected by the bright-mode HOBYS dataset. For each wavelength, we used the same grid for the HOBYS and Hi-GAL maps built by Scanamorphos. The pixels of the Hi-GAL 250 and maps with 150 Jy/beam are then replaced by those of the HOBYS map, after the addition of offsets measured by cross-correlating unsaturated Hi-GAL and HOBYS pixels (see Appendix B). The resulting three-color (RGB=//) image is presented in Figs. 1 and 8.
2.2. SiO and N2H+ mappings with the IRAM 30 m
We extracted the SiO (2–1) and N2H+ (1–0) emission lines from a 160 mapping survey of the W43-Main mini-starburst region made at 3 mm (85–93 GHz). These observations were performed as part of the W43-HERO IRAM 30 m Large Program666see http://www.astro.uni-koeln.de/projects/schilke/IRAMLargeProject/MainPage. Its first results are jointly presented in present paper and in Carlhoff et al. (submitted). SiO (2–1) and N2H+ (1–0) emission lines were observed with two different frequency setups of the Eight MIxer Receiver (EMIR) in December 2010, January 2011, and March 2011. We used the low spectral resolution (0.67 km s-1) but large bandwidth (8 GHz) Fast Fourier Transform Spectrometer (FTS) backend for SiO lines and the high spectral resolution (0.13 km s-1) but narrow bandwidth (80 MHz) Versatile SPectrometer Array (VESPA) for N2H+ (1–0) lines. The observational parameters of the SiO and N2H+ mappings are summarized in Table 2.
| Parameter | Unit | SiO (2–1) | N2H+ (1–0) |
|---|---|---|---|
| Frequency | (GHz) | 86.846 | 93.173 |
| Angular HPBW | (″) | 31 | 28 |
| Linear HPBW | (pc) | 0.90 | 0.81 |
| V | ( km s-1) | 0.67 | 0.13 |
| 3 rms | (K km s-1) | 0.05 | 0.01 |
| - | 0.81 | 0.81 | |
| - | 0.95 | 0.95 |
The maps were done using the on-the-fly mode in two perpendicular scanning directions (RA and Dec) and a full sampling which provides the best angular resolutions (see Table 2). Pointing, focus, and calibration observations were repeated frequently. Pointing error is less than 3″ and calibration accuracy is within 10%. The basic data reduction steps such as pointing correction, focus correction, and flux calibration were done using MIRA which is part of the GILDAS package777GILDAS (Grenoble Image and Line Data Analysis Software) is a software package mainly developed and maintained by IRAM to reduce and analyze data obtained with the 30 m telescope and Plateau de Bure interferometer. See www.iram.fr/IRAMFR/GILDAS. We removed a baseline from each spectrum by masking the main velocity range of W43-Main (80–100 km s-1) and fitting a first-order polynomial to the spectrum observed over the remaining velocity ranges. We converted the units of the data cubes from antenna temperature, , to main beam temperature, , following the usual conversion: with main beam and forward efficiencies given in Table 2. In the remaining of the paper, we used as the intensity unit. Finally, we combined the reduced spectra into gridded data cubes with a Gaussian kernel, leading to a slightly degraded resolution (see Table 2).
| Cloud structure | ||||||||||||
| (pc2) | (pc) | (pc) | (pc3) | (K) | () | () | ( cm-3 ) | ( pc-2) | () | - | (K km s-1 | |
| (1) | (2) | (3) | (4) | (5) | (6) | (7) | (8) | (9) | (10) | (11) | (12) | kpc2)(13) |
| The ridges ( 10) | ||||||||||||
| W43-MM1 ridge | 6 | 4.3 | 0.7 | 6.6 | 1.9 | 21000 | 6.0 | 3500 | 3700 | 5.5 | 1.0 | |
| W43-MM2 ridge | 14 | 8.8 | 0.8 | 17.6 | 1.2 | 35000 | 3.4 | 2300 | 11000 | 2.9 | 1.0 | |
| DR21d ridge | 2.3 | 4.0 | 0.3 | 1.1 | 2.3 | 9800 | 1.7 | 4300 | - | - | ||
| The ridge and its immediate surrounding ( 4) | ||||||||||||
| W43-MM1 sur | 43 | 11.9 | 1.8 | 121.5 | 4.4 | 32000 | 5.5 | 830 | 58000 | 0.6 | 2.0 | |
| W43-MM2 sur | 62 | 13.5 | 2.3 | 223.9 | 4.6 | 53000 | 4.5 | 900 | 120000 | 0.5 | 2.0 | |
| DR21d sur | 6.0 | 5.8 | 0.5 | 4.6 | 1.1 | 12200 | 5.1 | 2000 | - | - | - | |
a The radii and thus volumes are not deconvolved from the beam ( in W43 and in DR21). The resulting volume number densities quoted here may be underestimated by a factor up to 2: e.g. instead of for the W43-MM1 ridge and instead of for the W43-MM2 ridge .
b Properties measured after subtracting the common surrounding column density background of .
c Mass estimated from Col. 2 and the median velocity dispersion of N2H+ (1–0) lines given in Table 4.
d All properties of the DR21 ridge are drawn from Hennemann et al. (2012). The temperature range given for DR21 excludes the area toward DR21 itself due to saturation, and where we expect higher dust temperatures.
3. PROPERTIES of Cloud ridges
In this section, we present the properties of the W43-MM1 and W43-MM2 ridges using column density and temperature images derived from Herschel maps (Sect. 3.1), and the velocity structure traced by N2H+ emission lines (Sect. 3.2).
3.1. Density structure
Using three of the four longest wavelengths of Herschel (160–350 µm), we derived the total (gas+dust) column density () and average dust temperature maps of W43-Main with an angular resolution of , which is that of the map. Following the procedure fully described in Hill et al. (2011, 2012), we fitted pixel-by-pixel spectral energy distributions (SEDs) with modified blackbody models. We used a dust opacity law similar to that of Hildebrand (1983) but with instead of and assumed a gas-to-dust ratio of 100: cm2 g-1. Given the high quality of the Herschel data, a robust fit can be done even when dropping the 500 µm data point. The column density values are only changed by a factor of less than 10% in region with (see Hill et al., 2012). Changing from to would globally lower the column density values by 20%. Carlhoff et al. (subm.) made a detailed comparison of Herschel versus CO column density maps and showed that they do agree with each other to within a factor of for intermediate-density clouds.
The column density and temperature maps of W43-Main and the entire W43 molecular complex are plotted in Fig. 2 and 9. The noise level, estimated over areas with minimum intensity variations, are and 1.5 K. The average column density and temperature found toward W43-Main are 2.5 (AV 25 mag) and . The dominating structure of Fig. 2 is the cold and dense Z-shaped filament discussed in Motte et al. (2003), which reaches column densities up to 6.6 and temperatures down to 19 K. It contains two clouds with , i.e. above the column density requirement of ridges as defined by Hill et al. (2011). They host the W43-MM1 and W43-MM2 massive dense cores (Motte et al., 2003) and are hereafter denoted as the W43-MM1 and W43-MM2 ridges. These ridges stand out from their environment at a column density level of 4 , inside which we defined their immediate surroundings (see Fig. 2a). Between these ridges lies a region with higher temperature () and lower column density (see Fig. 2). This hot bubble of gas is produced by the strong UV radiation from the massive stars within the WR/OB cluster associated with W43-Main (star symbol on Fig. 2).
We used the and contours of Fig. 2a to measure the areas, , and estimate the rough lengths, , of the W43-MM1 and W43-MM2 ridges and their immediate surroundings. We assumed they are well represented by a cylindrical geometry to calculate their radii, , and volumes, . We used the value as background emission in measuring the column density averaged over the W43-MM1 and W43-MM2 ridges, and their immediate surroundings. The mean column density after background subtraction, , translates into mass, volume number density, and mass surface density (, , ) by the relations:
| (1) | |||||
| (2) | |||||
| (3) |
where is the mean molecular weight and is the hydrogen mass. Table 3 lists all the characteristics derived from the Herschel column density and temperature images. We also list the properties of the DR21 ridge, drawn from Hennemann et al. (2012) with the same background subtractions, to allow a comparison with this prototypical ridge of the HOBYS survey.
Both the W43-MM1 and W43-MM2 ridges have higher temperatures than the DR21 ridge, due to their proximity to the WR/OB cluster and a higher background of low-density, high-temperature cloud impacting the SED fits. The mean column densities of the W43-MM1 and W43-MM2 ridges are similar and are also similar to that of the DR21. For both the cloud ridges and their immediate surroundings, the masses measured for W43-MM1 and W43-MM2 are 2-4 times higher than the corresponding ones of DR21. This is a natural consequence of the mass being integrated over a larger area since the W43-MM1 and W43-MM2 ridges and surroundings are a few times larger than the DR21 ridge. This also explains the lower values of volume number density and mass surface density, by factors of 3–10 and 1–2, measured in the W43-MM1 and the W43-MM2 ridges when compared with the DR21 ridge (see Table 3). One should however remember that DR21 is characterized with three times higher linear spatial resolution than W43 (0.25 pc vs. 0.7 pc). With a similar resolution, the value measured for W43-MM1 would increase and the cloud volume would decrease, thus increasing by a factor of a few the estimated volume number density (see Table 3 for a tentative deconvolution of ).
| Position/ | N2H+ (1–0) | SiO (2–1) | ||||||||
| Name | a | d | a | b | d | c | ||||
| (K) | (km/s) | (km/s) | (km/s) | (K km/s) | (km/s) | (km/s) | (km/s) | (km/s) | ||
| (1) | (2) | (3) | (4) | (5) | (6) | (7) | (8) | (9) | (10) | (11) |
| W43-MM1 Ridge | ||||||||||
| W43-MM24 | 0.300.01 | 97.10.03 | 5.80.05 | 2.50.02 | 0.100.01 | 2.040.15 | 98.40.44 | 12.21.08 | -1.30.44 | |
| W43-MM33 | 0.450.01 | 96.60.11 | 5.10.18 | 2.10.08 | 0.100.01 | 3.370.10 | 97.90.09 | 6.80.22 | -1.30.14 | |
| W43-MM1 | 0.580.01 | 96.60.08 | 5.50.18 | 2.30.08 | 0.100.03 | 7.000.05 | 98.30.08 | 7.80.22 | -1.70.11 | |
| W43-MM9 | 0.620.01 | 94.60.01 | 3.40.01 | 1.40.01 | 0.100.01 | 1.200.11 | 94.00.29 | 5.90.83 | 0.60.29 | |
| W43-MM16 | 0.310.01 | 93.90.03 | 4.30.05 | 1.80.02 | 0.100.01 | 0.770.08 | 94.10.27 | 6.50.85 | -0.20.3 | |
| W43-MM1 ridge | 0.450.01 | 96.60.08 | 5.10.18 | 2.20.08 | 0.100.01 | 2.040.15 | 97.90.09 | 6.80.22 | 2.90.09 | -1.30.20 |
| W43-MM2 Ridge | ||||||||||
| W43-MM7 | 0.530.01 | 95.00.02 | 5.30.04 | 2.30.02 | 0.260.01 | 1.830.19 | 93.80.49 | 12.31.24 | 1.20.50 | |
| W43-MM17 | 0.600.67 | 90.60.10 | 2.50.17 | 1.10.07 | 0.210.32 | 1.210.12 | 90.90.25 | 6.80.62 | -0.30.27 | |
| W43-MM3 | 0.550.01 | 93.70.01 | 4.50.02 | 1.90.01 | 0.140.01 | 3.000.13 | 93.20.12 | 6.90.29 | 0.50.12 | |
| W43-MM2 | 0.780.01 | 90.70.01 | 4.50.02 | 1.90.01 | 0.110.01 | 4.250.18 | 91.00.12 | 8.00.35 | -0.30.12 | |
| W43-MM22 | 0.460.01 | 88.50.05 | 4.10.09 | 1.70.04 | 0.100.01 | 1.690.19 | 88.30.26 | 6.50.73 | 0.20.27 | |
| W43-MM2 ridge | 0.550.01 | 90.70.01 | 4.50.02 | 1.90.01 | 0.140.01 | 1.830.19 | 91.00.12 | 6.90.29 | 2.90.12 | -0.30.12 |
a Results of the Gaussian hyperfine fits to the N2H+ (1–0) multiplet. (Col. 2) is the line temperature and (Col. 5) the optical depth of the strongest N2H+ (1–0) multiplet, related by the equation .
b Results of the Gaussian fits to the SiO (2–1) lines.
c The shift between the peak velocities of the N2H+ (1–0) and SiO (2–1) lines is measured as .
d The 1D velocity dispersion is calculated as , using Col. 4 for Col. 10 for SiO.
The values of the ridges are the mean values of all pixels contained in each ridge.
3.2. Velocity structure
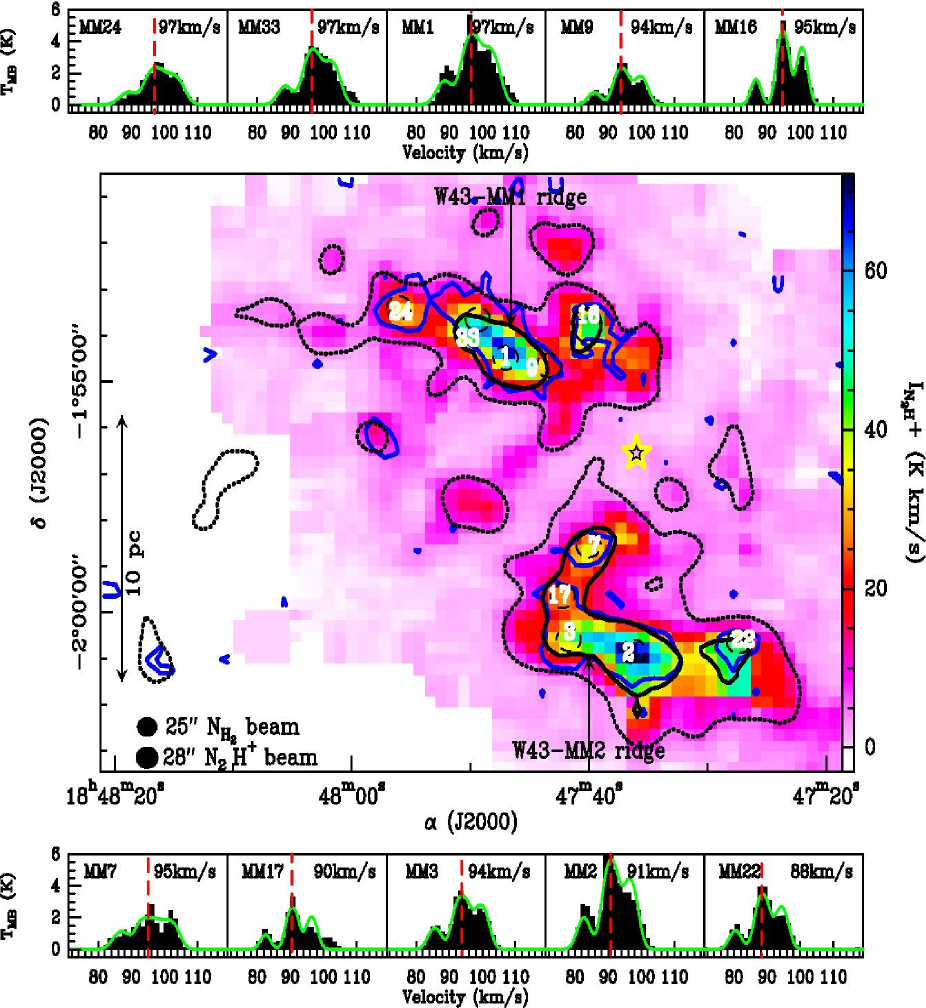
The integrated intensity map of the N2H+ (1–0) emission observed toward the W43-Main mini-starburst as well as spectra at a few selected locations are shown in Fig. 3. The N2H+ (1–0) lines are integrated from 80 to 110 km s-1, which is the velocity range of W43-Main as defined in Nguyen Luong et al. (2011b). The selected positions are paving the W43-MM1 and W43-MM2 ridges and have clear SiO peaks (see Fig. 5). They are coincident or close to massive dense cores identified by Motte et al. (2003) and whose names are used here for discussion (see Figs. 3, 5 and Table 4). With a critical density of 4, N2H+ (1–0) is a good tracer of the cold dense gas in the W43-MM1 and W43-MM2 ridges as well as their massive dense cores.
The N2H+ (1–0) line splits into seven hyperfine structure components. We thus fitted the observed N2H+ (1–0) spectra by seven Gaussians, whose frequency spacings and relative line strengths are theoretically determined and cataloged in splatalogue888The splatalogue is a catalog of spectroscopic information of astronomical spectral lines which can be accessed from www.splatalogue.net (see Fig. 3 and Table 4). Considering the noise level in the spectra and the high probability for 0.9 pc beams to contain several cloud components, the multiple hyperfine structure component fits to the N2H+ (1–0) spectra are acceptable at all locations. The derived optical depths range from 0.1 to 0.26, meaning that N2H+ (1–0) emission is optically thin and traces all material along the line of sight. The W43-MM1 and W43-MM2 ridges have their spanning ranges of and , respectively. At the ten locations except W43-MM1, the N2H+ are only 1 km s-1 different from the values determined for H13CO+ 3–2 lines (Motte et al., 2003), it is 2 km s-1 higher for the W43-MM1 dense core.
We used the volume of the W43-MM1 and W43-MM2 ridges and the median velocity dispersion of their N2H+ lines, , given in Tables 3-4 to calculate their virial mass, , according to:
| (4) |
where is the gravitational constant and the total (thermal + nonthermal) velocity dispersion. The latter is calculated as
| (5) |
where is the Boltzmann constant, and are the mean and N2H+ molecular weights. We assumed that is close to the dust temperature measured in the ridges to be 23 K. This calculation only provides approximated values for the W43-MM1 and W43-MM2 ridges since they are better represented by cylinders than spheres and are embedded within backgrounds whose N2H+ emission is not removed here. The unusually large virial ratios measured, and 2.9, indicate that, despite their high level of turbulence, the W43-MM1 and W43-MM2 ridges are most probably gravitationally bound cloud structures. The immediate surroundings, however, have much smaller virial ratios, 0.6 and 0.5, indicate that they are just at the limit to be gravitationally bound which requires . Since velocities in the W43-MM1 and W43-MM2 ridges vary within ranges, which are close to the measured line widths, and since the virial ratio suggest boundedness/collapse, W43-MM1 and W43-MM2 ridges can be considered as coherent structures in both in space and velocity.
4. SiO emission Result & Analysis
4.1. SiO spectra and integrated intensity map
In Fig. 4, we plot the accumulated spectrum representing the SiO (2–1) emission integrated over the entire W43-Main region, as well as the spectra integrated over the W43-MM1 and the W43-MM2 ridges defined in Sect. 3.1. The spectrum integrated over the entire W43-Main region spans a velocity range of 80–110 km s-1, in agreement with the main 13CO (1–0) velocity range of W43 derived in Nguyen Luong et al. (2011b). Note that Carlhoff et al. (subm.) used the 13CO (2–1) data of our IRAM large program to refine the main velocity range for the W43 complex to . The similarity in velocities ranges between the 13CO (1–0) and SiO (2–1) lines is remarkable since SiO lines are generally tracing shocks from outflows and are thus expected to have very extended wings (e.g. Schilke et al., 1997). Some SiO emission arising from a collection of outflows driven by protostars forming in the W43-MM1 and W43-MM2 ridges could be hidden in these broad lines. The SiO (2–1) lines of Fig. 4 seem however to be dominated by one line component without velocity wings. We fitted Gaussian profiles to all three averaged spectra and obtained of 97.0 km s-1 for the W43-MM1 ridge, 91.8 km s-1 for the W43-MM2 ridge, and 94.5 km s-1 for the entire W43-Main. The FWHM line width measured toward the W43-MM1 and W43-MM2 ridges both are 8 km s-1 while that of the averaged spectrum in the entire W43-Main is somewhat larger, 12 km s-1. The integrated peak SiO fluxes in the W43-MM1 and W43-MM2 ridges are of the same order: 1.2 Jy (see Table 3).
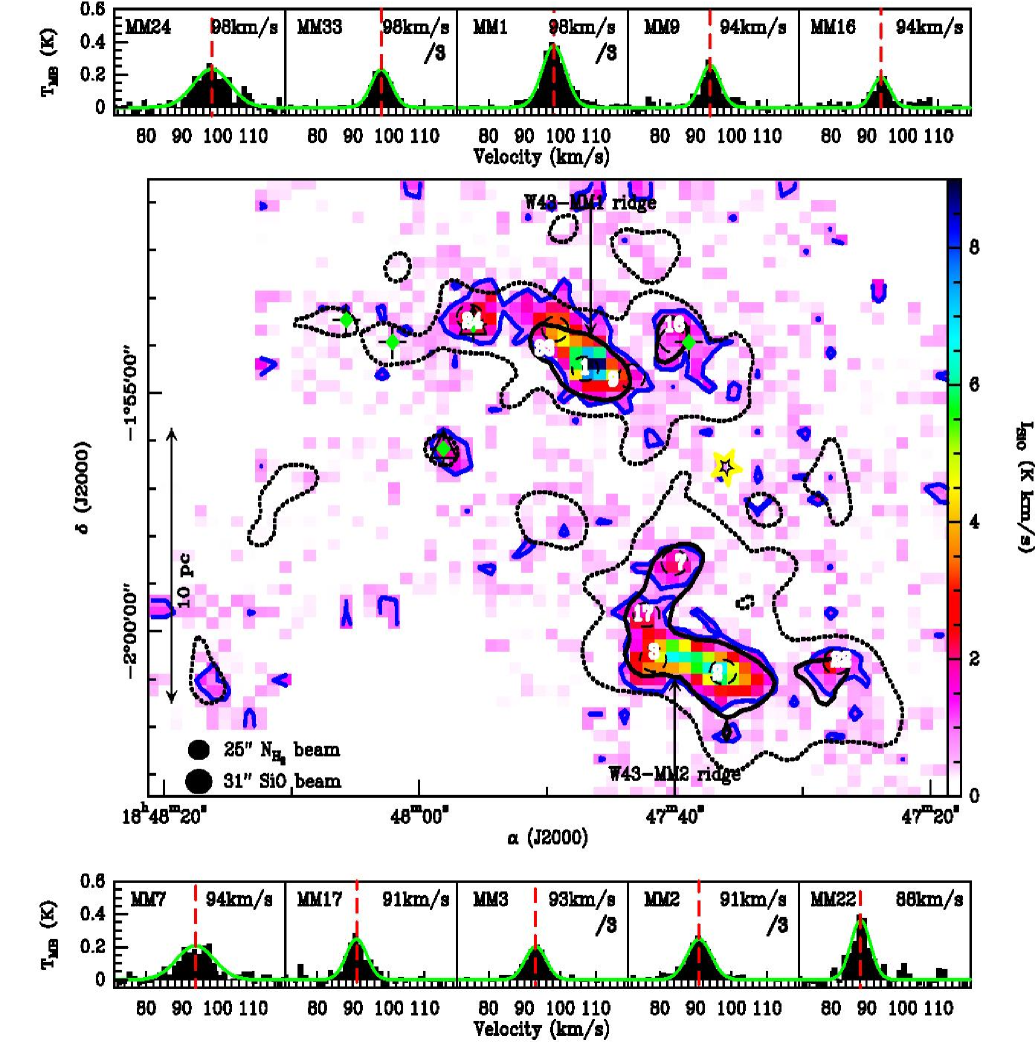
The intensity map of the SiO (2–1) emission, integrated from 80 to 110 km s-1, is shown in Fig. 5 for the W43-Main mini-starburst. The SiO emission above a 3 level, i.e. 0.8 K km s-1, appears as two extended features following the density structure of the two W43-MM1 and W43-MM2 ridges (see and compare the blue and black contours in Fig. 5). A closer inspection shows that there is an exception north of the W43-MM33 position since the SiO emission peak is offset by 0.5 pc (15″) from the dust column density peak. The spatially integrated SiO fluxes in the W43-MM1 and W43-MM2 regions are 39 K km s-1 pc2 for areas of 12 and 16 pc2, respectively. Their SiO emitting regions have mean dust column density of 1.5 and 5.9 , respectively. The strongest SiO emission peaks are at the position of massive dense cores in the W43-MM1 and W43-MM2 ridges, especially toward W43-MM1 and W43-MM2, but SiO emission is also detected toward other more isolated sources. Beuther & Sridharan (2007) observed five locations in the W43-Main region, among which two remained undetected in our lower-sensitivity image (see Fig. 5). Their observations suggest that the SiO (2–1) emission would be even more extended if observed with a higher sensitivity.
To probe in more detail the kinematics of shocked gas traced by SiO emission, we plotted the SiO spectra toward several peak positions in Fig. 5. These spectra are gridded at the HPBW of 31 or 0.9 pc at a distance of 6 kpc, each box thus representing a beam-separated independent spectrum. These spectra illustrate that the SiO emission is resolved and extended over several beams toward both the W43-MM1 and W43-MM2 ridges. The line parameters change from one location to another but most of the SiO spectra can be very well approximated by a single Gaussian profiles (see Table 4). The velocity dispersions of SiO (2–1) spectra are larger than those of N2H+ (1–0) spectra: 2.9 km s-1 instead of 2.2 km s-1. W43-MM24 and W43-MM7, which both are at one end of the ridges, are the locations with the broadest SiO (2–1) and N2H+ lines (see Table 4) compared to the rest of the ridges . The comparison of the (1–0) and SiO (2–1) peak velocities reveals a median offset of 1 km s-1 in the W43-MM1 ridge (see Table 4).
| Source samplesa | rms | FWZP– | FWZP– | ||||||
| (kpc) | (K/ km s-1) | ( km s-1) | (K km s-1 kpc2) | (K km s-1) | |||||
| (1) | (2) | (3) | (4) | (5) | (6) | (7) | (8) | (9) | (10) |
| W43-Main ( ) | 6.0 | 0.05 | 14.2 | 960 | 2.1 | 144 | 751 | 0.27 | 1.42 |
| W43-MM1, 17 beams | 6.0 | 0.05 | 12.3 | 770 | 1.7 | - | - | - | - |
| W43-MM2, 18 beams | 6.0 | 0.05 | 14.6 | 970 | 2.2 | - | - | - | - |
| All comparative studies | 2.9 | - | 31.8 | 331 | 3.0 | 13 | 72 | 0.1 | 0.26 |
| M07, 31 sources in Cygnus X | 1.4 | 0.03 | 18.7 | 37 | 1.5 | - | - | - | - |
| LS11, 49 sources | 3.0 | 0.03 | 35.9 | 290 | 2.2 | - | - | - | - |
| BS07, 14 sources | 3.9 | 0.02 | 27.0 | 240 | 1.5 | - | - | - | - |
| J10, 3 beams in G035.39–00.33 | 2.9 | 0.006 | 10.0 | 330 | 1.6 | - | - | - | - |
| J12, CMZ G0.253+0.016 | 8.0 | 0.006 | 70.0 | 608 | 9.5 | - | - | - | - |
| J12, CMZ G1.6–0.025 | 8.0 | 0.006 | 93.8 | 288 | 4.5 | - | - | - | - |
4.2. SiO (2–1) luminosity & velocity extent
We measured the luminosity and the velocity extent (or Full Width at Zero Power) of the SiO (2–1) lines detected in beam-averaged, 0.9 pc, pixels. To do so we first regridded the SiO spectra to 31 pixels, corresponding to the beam size of our observations and 0.9 pc at 6 kpc from the Sun. We then selected 17 spectra above the level detection observed in W43-MM1 ridge and 18 in W43-MM2 ridge, and thus being located within the blue contour of Fig. 5. The velocity extents, luminosities, and intensities of these SiO (2–1) spectra were then compared in Table 5 to the values determined for a few selected samples (López-Sepulcre et al., 2011; Beuther & Sridharan, 2007; Motte et al., 2007; Jiménez-Serra et al., 2010). The velocity extents of the SiO lines in W43-Main were defined above the 3, i.e. 0.05 K/kms level. This level is eight times less sensitive than G035.39-00.33 and three time less sensitive than the rest of the comparative studies (for details see Table 5). However, even with higher sensitivity, G035.39-00.33 do not show wings in spectra. We therefore expect both our velocity extents and SiO intensities to be directly comparable with those reported in the comparative studies within a factor of 3 times.
The sources from the López-Sepulcre et al. (2011), Beuther & Sridharan (2007), Motte et al. (2007), and Jiménez-Serra et al. (2010) samples have all been studied in SiO (2–1) with the IRAM 30 m telescope and thus also with a 31 beam. They span a large variety of distances: 1.4 kpc for the Cygnus X massive dense cores identified by Motte et al. (2007), 1.7-5.7 kpc for the massive star-forming cores of López-Sepulcre et al. (2011) and 0.7-7.3 kpc for high-mass protostellar objects (Beuther & Sridharan, 2007) and 2.9 kpc for IRDC G035.39–00.33 (Jiménez-Serra et al., 2010). In the first three studies, the SiO (2–1) emission is mainly intepreted as a tracer of protostellar outflows, in the last one the SiO emission is interpreted as associated with colliding flows. CO outflows of high-mass protostars are known to typically be 0.05–0.8 pc long (e.g. Beuther et al. 2002; Duarte-Cabral et al. subm.). The SiO emission in the three comparative studies arises from local regions where high-velocity shocks are developing and should thus be confined within a 31 beam for these 2.9 kpc sources.
None of the published SiO measurements of the Central Molecular Zone (CMZ) were observed with the same transition and spatial resolution as in our W43 observations. To compare our W43 SiO observations with this well-known region, we here used the SiO (2–1) measurements of the G0.253+0.016 and G1.6–0.025 sources of the CMZ obtained with the MOPRA telescope (Jones et al., 2012). The larger beams (40″) of this observation over-estimate their SiO (2-1) integrated intensity and luminosity compared to ours but probably not more than 50%. A distance of 8 kpc is assumed for Fig. 6b. The origin of the SiO emission from the CMZ clouds is still a matter of debate since star formation may be inhibited (Menten et al., 2009; Kruijssen et al., 2013). For W43-Main and the outflow sources of the comparative samples, we estimated the SiO (2–1) luminosity, , from the integrated intensity, , via:
The conversion of the SiO 2–1 luminosity unit from to is discussed in Appendix C. Luminosity allows a more direct comparison of published intensities with those measured in W43-Main. For sources closer than W43, Eq. 4.2 is a proxy of the dilution of their intensities measured within 0.1–0.9 pc beams to the largest physical scale, here 0.9 pc. This is correct for the unresolved SiO emisison of outflow sources (e.g. López-Sepulcre et al., 2011; Beuther & Sridharan, 2007; Motte et al., 2007) but it is obviously wrong for IRDC G035.39–00.33 whose emission is extended (Jiménez-Serra et al., 2010). The comparison of intensities rather than luminosities is more appropriate in such cases but with an implicit assumption that the sources have a constant intensity emission over, at least, 0.9 pc.
Fig. 6 shows the relations for both the SiO (2–1) luminosity (panel a) and integrated intensity (panel b) as a function of their velocity extent. We called hereafter them as the FWZP and FWZP relations. We do not include the measurements of the CMZ in the fits since their FWZP go off from the W43 sample or the comparative samples. The most notable trait is that the SiO emission in W43–Main does not spread over more than 25 km s-1, in contrast with that of the high-mass molecular outflows which spread up to 50 km s-1 (e.g. López-Sepulcre et al., 2011). The median velocity extent of W43 is much smaller than the median values in other samples: 14 km s-1 compared to 32 km s-1 (see Table 5). Furthermore, the SiO (2–1) luminosity and intensity of W43-Main pixels are much steeper functions of their velocity extent than the relations measured for other samples (see Figs. 6a-b). The parameters of the best linear fits are given in Table 5. In more details, with a linear relation between the SiO (2–1) luminosity and velocity extent such as
| (7) |
we measured K kpc2 for W43-Main and K kpc2 for the comparative samples taken together. With a similarly linear relation between the SiO (2–1) integrated intensity and velocity extent, , the slope of the W43-Main region remains three times steeper than for the comparative samples (see Table 5).
Despite a large range of distances, the SiO (2–1) integrated intensities in in all the sources of the different samples, including W43-Main except the CMZ sources, are almost similar: K km s-1. In contrast, the median SiO (2–1) luminosity in W43-Main, K km s-1 kpc2, is three times larger than the median value observed for comparative sources. The total SiO (2–1) luminosity measured toward the W43-Main region is K km s-1 kpc2, with 50% concentrated in the W43-MM1 and another 50% in W43-MM2 ridge surroundings.
Within the three catalogs of massive young stellar objects, we found three sources that lie near the steep fit of the FWZP relation : G34.26+0.15 in the López-Sepulcre et al. (2011) sample and a couple of sources from Beuther & Sridharan (2007) (see Fig. 6a). The G34.26+0.15 source is an ultra compact H II region with a strong hot core SiO emission (Watt & Mundy, 1999) and the two Beuther & Sridharan (2007) sources in fact correspond to W43-MM24 and another location in W43-Main. The SiO line emission observed toward the CMZ has also higher luminosities than the SiO lines from outflows with the same FWZP (see Fig. 6a). If the lack of star formation activity in these regions is confirmed (see Sect. 5.1) other mechanism such as violent cloud-cloud collisions could be responsible for producing SiO in the CMZ (Martin-Pintado et al., 1997; Requena-Torres et al., 2006).
4.3. SiO column density
Assuming that the SiO emission is optically thin in shocked regions () and that the Local Thermodynamic Equilibrium (LTE) hypothesis is valid, we can in principle calculate the SiO column density from the integrated intensity by solving the basic radiative transfer equation (Rohlfs & Wilson, 2000). The total SiO (2–1) column density can be estimated with the following equation:
| (8) | |||||
where is the Boltzmann constant and GHz the emitting frequency. The line strength (), the dipole moment ( Debye), and the upper level energy () of the SiO (2–1) transition were taken from the splatalogue catalog. is the partition function which was extrapolated, for a particular excitation temperature, from the tabulated values of the Cologne Database for Molecular Spectroscopy (CDMS) 999The CMDS catalog can be searched here: http://www.astro.uni-koeln.de/cdms (Müller et al., 2005). The rotational degeneracy is given by while the K and nuclear spin degeneracies are and . A beam filling factor of is justified in our study since the SiO emission is extended in W43-Main and fills the entire beam as confirmed by interferometric observations (Louvet et al. in prep.). We recall that the LTE calculation relies on the assumption that the gas density is larger than the critical density of the SiO (2–1) transition given by
| (9) |
where the Einstein coefficient ( s-1), the cross-section () of the SiO molecule are taken from the splatalogue catalog. is the approximate ensemble average velocity of the collision partner, hydrogen in this case. Equation 8 yields a critical density of for an excitation temperature ranging from 106 K to 20 K. The median density values of the W43-MM1 and W43-MM2 ridges, and (see Table 3), prove that at least there are some parts of these cloud ridges where the density surpasses the critical density. Therefore Eq. 8 can be used as a good upper limit estimation of the SiO column density. Besides, if the SiO emission is optically thick, the SiO column density must be increased by a factor .
Assuming conservative shock temperatures K in Eq. 8, we derived the SiO column density of each of the W43-Main points of Figs. 7a. We varied the excitation temperatures from a minimum of K to a maximum K, which is a typical temperature range for shocks (Draine, 1980; Chieze et al., 1998). As shown in Figs. 1a and 5a of Lesaffre et al. (2013), each maximum gas temperature can be related to a single shock velocity for a specific set of inputs. Therefore, the observed column density plotted in Fig. 7a is almost directly comparable to the theoretical column density plotted in Fig. 7b (see Sect 5.2 for a fuller discussion of the models). For instance, a C-type shock with a low-velocity of 7.5 km s-1 can easily reach a temperature of 3000 K (see Lesaffre et al. 2013 and Sect. 5.2). Depending on the model, the SiO molecules could be formed either in the shock front or just after it in the post-shock gas, thus arguing for excitation temperatures from a few thousands to a few hundreds Kelvin. This is coherent with the fact that at 1900 K, Si starts to evaporate from ice mantles (e.g. Gusdorf et al., 2008b). The SiO column density of the 35 independent 0.9 pc-beam points, detected above our level in the W43-MM1 and W43-MM2 ridges plus surroundings, are shown in Fig. 7a as a function of . Our SiO column density thus ranges from to , with a mean value of 6. Such values are typical for shocked regions associated with the most powerful outflows driven by high-mass star-forming regions (e.g. G5.89-0.39 and G34.26 by Acord et al., 1997; Hatchell et al., 2001) or observed toward the Central Molecular Zone (Yusef-Zadeh et al., 2013).
5. Discussion
We discuss the origin of the SiO emission in Sects. 5.1-5.2 and their implications on the formation of ridge and subsequent the star formation processes in Sect. 5.3.
5.1. Observational constraints on the origin of the SiO emission in the W43-MM1 and W43-MM2 ridges
We here review the various physical processes that could explain the bright SiO (2–1) emission spreading along the W43-MM1 and W43-MM2 ridges. As will be explained in Sect.5.2, all SiO emission stem from shocks. We investigate the hypotheses of high-velocity shocks () in outflows, moderate- to high-velocity shocks () in photon dominated regions (PDRs) and hot cores, and low-velocity shocks () associated with clouds collision.
SiO emission coming from outflows driven by young stellar objects is usually caused by high-velocity shocks (, Schilke et al., 1997). This mechanism, that should translate into high-velocity spectral wings, could play a role in W43-Main since it is an active star-forming region. However, the SiO lines observed in W43-Main do not spread over more than 25 km s-1, in contrast with lines measured toward high-mass protostellar outflows which have up to 50 km s-1 wings (e.g. López-Sepulcre et al., 2011; Motte et al., 2007, see Figs. 6a-b). As it will be shown in Louvet et al. (in prep.), from a higher-angular resolution SiO imaging, beam dilution and sensitivity limit may partly explain why the protostellar outflows of the W43-MM1, W43-MM2, and W43-MM3 massive dense cores are hardly seen. We cannot, however, rule out the scenario of a widespread population of low-mass protostars driving outflows along the W43-MM1 and W43-MM2 ridges. Higher-angular resolution and higher sensitivity SiO line and dust continuum mappings are necessary to confirm/denounce it (see Louvet et al. in prep.)
SiO emission tracing irradiated shocks in PDRs have been observed to be associated with medium-velocity shocked gas (, e.g. Schilke et al., 2001). Irradiated shocks are to be expected in the W43-Main mini-starburst region since the cloud is associated with a very luminous cluster (3.5 10, Smith et al., 1978; Bik et al., 2005). Fast winds and ionization from the OB/WR stars are observed to be interacting with intermediate-density clouds, which are swept up and accumulated at the periphery of the giant H II region (Motte et al., 2003). We however do not detect SiO emission over the PDR ring (see Fig. 5), delineated in near-infrared and centimeter continuum emission (Motte et al., 2003, Carlhoff et al. subm.). Moreover, the process of medium-velocity shocks in irradiated PDRs is rather unlikely to develop in the higher-density and thus better-shielded cloud structures that are the W43-MM1 and W43-MM2 ridges. We prove this statement by making shock models for the solar or stronger radiation fields, i.e.LABEL:• and . The SiO production is slightly more efficient in the case of with but the weaker radiation field seems to produce more SiO for low-velocity shocks (see Fig. 7b).
We cannot neglect the impact of the OB cluster on the ridges via its radiation pressure and UV photons. However, as shown by Krumholz & Matzner (2009), even for the most powerful clusters in the Galaxy, the radiation pressure effect is stalled at a radius much smaller than 5 pc. Moreover, the ridges are very dense regions with , the penetrating depths of UV photons from a cluster with , similar to the W43 OB cluster, will decrease rapidly and reach a value of within the ridge (Meixner & Tielens, 1993). Therefore, W43 OB cluster cannot be the main responsibility for creating the extended shocks observed in the W43 ridges although itcould still contribute.
Hot cores and hot corinos are emitting SiO lines that trace high-velocity (, Hatchell et al., 2001; Jørgensen et al., 2011) shocks associated with the strong thermal heating of young stars. The SiO lines with hot core origin could account for part of the emission observed toward the high-mass protostars of W43-Main. However, like for the outflow hypothesis, our analysis of SiO lines did not reveal many high-velocity components (see Figs. 4 and 6a-b) and the protostellar content of the W43-MM1 and W43-MM2 ridges must still be assessed. This scenario is thus not very likely.
Therefore, none of the physical processes usually advocated to explain SiO emission in star-forming regions, i.e. high-velocity or irradiated shocks, explain reasonably all SiO (2–1) emission observed in W43-Main. Given that the observed SiO lines have Gaussian-like shapes without any high-velocity components (see, e.g., Fig. 5), a series of low-velocity, i.e. , shocks are more appropriate (see Sect. 5.2). The very similar line shapes in terms of intensity and width over the two 10 pc2 areas (see Table 4) moreover support the hypothesis of a large-scale mechanism homogeneously producing shocks throughout both the W43-MM1 and W43-MM2 ridges. The similar and overlapping extended morphologies between the shocked gas and the dense gas of ridge structures (see Figs. 3 and 5), suggest that the formation of ridges is associated with such shocks. The mechanism at the origin of SiO emission in W43-Main could thus be colliding flows or merging of filaments that are interpreted as the processes necessary to build up cloud ridges (e.g. Schneider et al., 2010b; Hennemann et al., 2012).
Jiménez-Serra et al. (2010) also proposed that the SiO emission observed along IRDC G035.39–00.33 could partly arise from the collision of gas streams that form the higher-density IRDC structure. Their measurements however suffer from a lack of sensitivity and spatial resolution: only three independent beams are above their detection level. A detailed comparison shows that the SiO (2–1) observed along each of the W43-MM1 and W43-MM2 ridges are 30 times more intense and 10 times more extended than that of IRDC G035.39–00.33. In Fig. 5, we detected SiO (2–1) integrated intensities of 1–11 K km s-1 over 12 pc2 and 16 pc2 areas along the W43-MM1 and W43-MM2 ridges and their immediate surroundings, respectively. These values are to be compared with the 0.02–0.05 K km s-1 emission observed along the 1 pc2 IRDC G035.39–00.33 filament (Jiménez-Serra et al., 2010; Henshaw et al., 2013, see also Fig. 6b). The W43-MM1 and W43-MM2 ridges could therefore be two more regions, as IRDC G035.39–00.33, where extended SiO emission is detected and interpreted as arising from low-velocity shocks associated with the formation of high-density cloud structures. From the analysis of Sect. 4.2, we propose to use a linear relation in the luminosity versus velocity extent diagram of Fig. 6a to distinguish the low-velocity (10 km s-1) shocks with steep slopes ( K kpc2 defined in Eq. 7) possibly associated with cloud collision from more classical high-velocity (20–100 km s-1) shocks with flatter slopes ( K kpc2). The SiO emission in W43 is as luminous as the SiO emission associated with extremely high-velocity outflows despite having narrower velocity range. This may suggest that the low-velocity shocks in W43 are highly efficient in forming/releasing SiO over an extended region.
Very widespread SiO emission, with velocity dispersion exceeding those observed toward W43-Main, has been reported toward the entire Central Molecular Zone of our Galaxy (CMZ covering pc2, Martin-Pintado et al., 1997; Jones et al., 2012). The CMZ is in general characterized by much higher temperatures (K) and more turbulence and shears, resulting in larger velocity dispersion ( ; see the recent review by Güsten & Philipp, 2004). Two CMZ clouds with strong and extended SiO emission, G1.6–0.025 and G0.253+0.016, have been observed to be devoid of signs of massive star formation (Menten et al., 2009; Kauffmann et al., 2013; Kruijssen et al., 2013) but see however Rodríguez & Zapata (2013). Recent studies by Yusef-Zadeh et al. (2013) still interpreted the very broad SiO lines observed close to Sgr A∗ as arising from highly embedded protostellar outflows. We propose that the process explaining the SiO emission measured in the CMZ is partly, like in the case of W43-Main, velocity shears arising from cloud collision. Given the much higher shock velocities in CMZ ( is up to ) and interstellar radiation field, its SiO emission could be explained either in the frame of highly-irradiated and highly magnetized shock models, or in that of fast J-type shock models (see Section 5.2 for a short review on shock models).
This is in marked contrast with the strong SiO emission of W43-Main detected at the ridges’ standard velocities at rest. In W43, the velocity dispersion observed for SiO (2–1) lines and the 5 km s-1 variation found for the ridge material suggest the collision of gas flows separated by 5–10 km s-1 only. Note that SiO molecules could form in the post-shock gas and thus display a factor of two lower velocities than the initial shock velocity (see Sect. 5.2).
We therefore conclude that most of the SiO emission in W43-Main mainly comes from low-velocity (10 km s-1) shocks. This is a convincing evidence that SiO molecules being formed in shock front or post-shock gas under the influence of low-velocity shocks.
5.2. Theoretical ability to create SiO molecules through low-velocity shocks
SiO emission has been first demonstrated to possibly arise from magnetized, stationnary C-type shock models, with (Schilke et al., 1997; Gusdorf et al., 2008a; Guillet et al., 2007, 2011). In bipolar outflows associated to low-mass star-forming regions, for instance, Gusdorf et al. (2008b) showed that young, non-irradiated, non-stationary intermediate-to-high velocity C-shock models can also account for the SiO emission. On the other hand, low-velocity C-type shocks with magnetized, “irradiated” models is also proposed to explain the origin of SiO emission in irradiated environment (Lesaffre et al., 2013). Guillet et al. (2009) have shown that stationnary, J-type shock models also constitute reasonable candidates to generate significant amounts of SiO emission in molecular outflows and jets.
We examine here a few dedicated shock models, similar to models in Lesaffre et al. (2013), which demonstrate that SiO could be produced in low-velocity, , shocks in W43 ridges. Figure 7b is comparing six models with different radiation fields and different fraction of Si in the gas phase, grain mantles, or grain cores (e.g. Lesaffre et al., 2013). Their predictions as a function of the shock velocity can directly be compared with our observations (see Figs. 7a-b). Silicon in the interstellar medium resides mainly in the cores of silicate grains (Flower et al., 1996). Impinging particles or photons may however release some of the Si in the gas phase where it can potentially be oxidized by either O2 or OH to form the SiO molecule (see Le Picard et al. 2001 and references therein). In even mildly irradiated media, like e.g. with a far-UV field of in units of the average interstellar radiation field and with a column density of 2 , all these SiO molecules photo-dissociate and Si remains mostly in atomic form in the gas (Le Picard et al., 2001). As shown in Lesaffre et al. (2013), magnetized shocks, even at low-velocity, can bring enough energy to overcome the reaction barriers for OH and O2 formation and balance the photo-dissociation rates. These molecules are then available to oxidize Si and form SiO.
The amount of SiO a shock can produce depends on the phase where the element Si is present in the pre-shock medium: grain cores, grain mantles, or gas phase. If some Si is already in gas phase, SiO can be formed at very low velocity, i.e. already around (see e.g. solid lines in Fig. 7b). If Si is present in the form of ice mantles on the grains, one needs to reach at least 10 km s-1 to sputter Si in the gas phase (see e.g. dashed lines in Fig. 7b, Gusdorf et al., 2008b). If, on the other hand all the Si is locked in the core of grains, one needs to spend more energy to detach Si and a velocity of at least 25 km s-1 is needed (see e.g. dotted lines in Fig. 7b, Schilke et al., 1997; Gusdorf et al., 2008a). Figure 7b illustrates in more details these three scenarii for a range of C-type shock velocities using the models by Lesaffre et al. (2013). We used far-UV fields of (red curves) to (blue curves) and a density for the pre-shock gas of cm-3 (see below), close to that of the W43-MM1 and W43-MM2 ridges. The magnetic field perpendicular to the shock front is another important parameter because it will determine the velocity limit at which C shocks cannot exist (Lesaffre et al., 2013). It is expressed through the dimensionless magnetization parameter . We assumed a constant magnetic field strength over the shocked regions, equal to the one measured toward the W43-MM1 massive dense core: G (Cortes et al., 2010). Given the mean density of the W43-MM1 and W43-MM2 ridges listed in Table 3, we estimated and thus . We therefore set for our models shown in Fig. 7b.
As seen in Figs. 7, the models with Si initially deposited in the gas or in mantles and shock velocities of 5–10 km s-1 can explain the SiO column density observed in the W43-MM1 and W43-MM2 ridges. However, the distinction between these two types of Si reservoirs and the use of more detailed input parameters would require a multi-transition study of SiO emission lines incorporating other shock tracers.
In order to check the effect of the mean interstellar radiation field on the SiO production, we increased the far UV field strength from to . We showed that the SiO abundance is not changed much (see Fig. 7b). It proves that the observed SiO emission does not necessarily favor shocks in a medium highly irradiated by the UV photons of the cluster.
5.3. Implications for the formation of ridge and young massive cluster
Our current knowledge of high-mass star-formation points toward a dynamical picture. Accretion flows from a surrounding filamentary network (Schneider et al., 2010a; Hennemann et al., 2012) were observed and suggested to be necessary to create ridges that form the majority of high-mass stars. In principle, this process could be called “colliding flows” since they represent the collision of several gas streams. The collision observed here happens at high density ( cm-3 ) and could be a prolongation of the converging flows process building up molecular gas from pockets of HI gas. At these densities, the cloud structures considered are gravitationally bound and even collapsing (see Table 3 and Motte et al. 2005 for W43). In colliding flows models, gravity is the main force that drive the colliding flows, sometimes called “gravitational focussing” (Burkert & Hartmann, 2004). Since the initial gravitational potential should anyway be explained, a converging flows plus colliding streams scenario is attractive as it self-consistently forms first the cloud and then ridges. It also agrees with observations suggesting that the W43 molecular complex has formed through large-scale colliding flows (Nguyen Luong et al., 2011b) while harboring ridges with a coherent but complex velocity structure (see Sect. 3). The special location of W43 at the meeting point of the Galactic Bar and spiral arm certainly helps to generate such dynamics (Nguyen Luong et al. 2011b, Carlhoff et al. subm.).
Theoretically, colliding flows are an efficient way to gather mass in dense cloud structures (e.g. Bergin et al., 2004; Heitsch et al., 2008; Koyama & Inutsuka, 2000). With the simple case of two streams frontally colliding, collected sheets would form and rapidly fragment into filaments (Heitsch et al., 2011). In the practical case of streams which are turbulent and/or colliding with non-zero impact angles, shears are expected to develop. Series of shocks in compressed layers should thus be natural consequences of realistic colliding flows (Bergin et al., 2001; Koyama & Inutsuka, 2000; van Loo et al., 2007). In W43-Main, the high-density ridges coincide with extended SiO emission, thus delineating the shocked and compressed cloud structures (see Sect. 3). The low-velocity (10 km s-1) shocks observed along the ridges (see Sect. 4) tend to confirm that cloud ridges are formed through the gradual merging of several gas flows, as previously proposed for the DR21 ridge by Schneider et al. (2010a); Hennemann et al. (2012). The W43-MM1 and W43-MM2 immediate surroundings have 1.5 more mass than the ridges themselves (i.e. ) and could feed them for the next yrs with an infall rate close to the shock velocity found here, a few km s-1.
Within the shocked filaments created by colliding flows, higher-density cloud structures/cores are expected to form, possibly leading to the formation of high-mass stars (Whitworth et al., 1994a, b; van Loo et al., 2007). Ridges are large-scale, a few pc2, elongated structures with a mean density typical of protostars ( cm-3 ) and forming clusters of high-mass stars (Hill et al., 2011; Nguyen Luong et al., 2011a; Hennemann et al., 2012). The W43-MM1 and W43-MM2 ridges are exceptionally massive and can be qualified as candidate precursors of starburst clusters (Motte et al., 2003) or or precursors of young massive clusters (Ginsburg et al., 2012). The massive dense cores identified by Motte et al. (2003) were assumed to be hosting high-mass protostars and used to estimate a star formation rate reminiscent of extragalactic starbursts: yr-1kpc-2). While the three most massive dense cores (W43-MM1, W43-MM2, and W43-MM3 with within 0.2 pc sizes) are clearly forming one/a few high-mass stars, the exact nature of the others is still unclear. One needs higher-angular observations to search for high-mass protostars in the W43-MM1 and W43-MM2 ridges and confirm that the star formation rates of these ridges are high (Louvet et al. in prep.). Such a result is consistent with the high star formation activity measured toward other ridges studied with Herschel (e.g. Nguyen Luong et al. 2011b, Hennemann et al. in prep.). Note that, in contrast, the CMZ presents high-density clouds that may be devoid of high-mass star formation (e.g. Menten et al. 2009). If confirmed, such a low star formation activity could be related to the too-large strength of the velocity shears in the CMZ. The W43-MM1 and W43-MM2 ridges are thus high-density cloud structures forming from constructive low-velocity colliding flows while other regions, like CMZ, might suffer from destructive colliding flows or strong radiation fields.
6. Conclusion & Summary
We report the discovery of two ridge structures and extended SiO emission in the W43-Main mini-starburst region. We used a combination of Herschel continuum data in the 160–350 wavebands and IRAM 30 m telescope data of the SiO (2–1) and N2H+ (1–0) emission lines (see Tables 1-2). Our main findings can be summarized as follows:
-
•
On the Herschel column density image, W43-Main harbors two high-column density ( ) structures, which we call the W43-MM1 and W43-MM2 ridges (see Fig. 2a).
-
•
Above a background level of , the W43-MM1 and W43-MM2 ridges have masses of and within 6 and 14 pc2 areas, respectively (see Table 3). The corresponding volume and surface densities are cm-3 and pc-2 for W43-MM1 ridge or cm-3 and pc-2 for W43-MM2 ridge.
-
•
The immediate surroundings of the W43-MM1 and W43-MM2 ridges, defined as cloud structures above , have a mean density of cm-3 (see Fig. 2a and Table 3). They provide a mass reservoir of for W43-MM1 ridge and for W43-MM2 ridge that could be used to further build up the ridges and enhance its subsequent star formation.
-
•
The N2H+ (1–0) spectra measured toward the W43-MM1 and W43-MM2 ridges (see Fig. 3 and Table 4) suggest that these dense cloud structures are complex, with velocities spanning the and ranges, respectively. The W43-MM1 and W43-MM2 ridges however are coherent velocity structures and despite their large N2H+ velocity dispersion, , they are gravitationally bound.
-
•
In W43-Main, the SiO (2–1) emission spreads over two large areas: 12 pc2 and 16 pc2 (see Fig. 5). They cover the W43-MM1 and W43-MM2 ridges and part of their immediate surroundings. This SiO emission is, with a few clouds in the CMZ, among the most extended observed up to now in our Galaxy.
-
•
The SiO (2–1) spectra observed along the ridges and integrated over the entire W43-Main (see Figs. 4-5) can correctly be described by single Gaussian velocity dispersions () without any obvious wings (FWZP , see Table 5). SiO (2–1) lines are also peaking at the same velocities as N2H+ (1–0) and 13CO (1–0) lines. The absence of high-velocity SiO wing emission in W43 is consistent with not having SiO arising from outflow shocks, as observed in other star-forming regions.
-
•
Despite the 0.9 pc resolution of our SiO (2–1) map, the lines are bright (1–11 K km s-1, see Fig. 5), roughly corresponding to a SiO column density of . The luminosities of beam-pixels in the W43-MM1 and W43-MM2 regions are K km s-1 kpc2, summing up to a total luminosity of 4 or 2 K km s-1 kpc2 for each of the ridges.
-
•
The FWZP relation is steeper for the SiO lines arising from W43-Main than for most SiO lines detected toward comparative samples of massive young stellar objects (see Fig. 5 and Table 5). We propose to use such diagrams and slopes of the linear fits to distinguish between low-velocity () and high-velocity () shocks, for both observational studies and synthetic observations of shock models.
- •
-
•
Dedicated shock models prove that low-velocity () shocks could give rise to bright and extended SiO emission, provided that 10% Si is initially deposited in gas phase or in the grain ice mantles (see Fig. 7). The exact process responsible for SiO emission in the W43-MM1 and W43-MM2 ridges is surely not grain core destruction as advocated for high-velocity (20 km s-1) shocks developing along protostellar outflows. Among the main open questions are how Si could exist in the gas phase or in grain mantles and with which abundance.
-
•
The structure and kinematics of the W43-MM1 and W43-MM2 ridges are tightly linked to those of the shocked gas observed in SiO. Low-velocity (10 km s-1) shocks may thus indicate that shears have developed when collisionning several gas flows arising from the ridge immediate surroundings. This interpretation is consistent with the idea that cloud ridges (and their embedded massive dense cores) are forming through colliding flows or merging of filaments.
References
- Acord et al. (1997) Acord, J. M., Walmsley, C. M., & Churchwell, E. 1997, ApJ, 475, 693
- Ballesteros-Paredes et al. (1999) Ballesteros-Paredes, J., Hartmann, L., & Vázquez-Semadeni, E. 1999, ApJ, 527, 285
- Bally et al. (2010) Bally, J., Anderson, L. D., Battersby, C., et al. 2010, A&A, 518, L90+
- Bendo et al. (2013) Bendo, G. J., Griffin, M. J., Bock, J. J., et al. 2013, ArXiv: 1306.1217, accepted for publication in MNRAS
- Bergin et al. (2001) Bergin, E. A., Ciardi, D. R., Lada, C. J., Alves, J., & Lada, E. A. 2001, ApJ, 557, 209
- Bergin et al. (2004) Bergin, E. A., Hartmann, L. W., Raymond, J. C., & Ballesteros-Paredes, J. 2004, ApJ, 612, 921
- Beuther et al. (2002) Beuther, H., Schilke, P., Sridharan, T. K., et al. 2002, A&A, 383, 892
- Beuther & Sridharan (2007) Beuther, H., & Sridharan, T. K. 2007, ApJ, 668, 348
- Bieging et al. (2010) Bieging, J. H., Peters, W. L., & Kang, M. 2010, ApJS, 191, 232
- Bik et al. (2005) Bik, A., Kaper, L., Hanson, M. M., & Smits, M. 2005, A&A, 440, 121
- Blum et al. (1999) Blum, R. D., Damineli, A., & Conti, P. S. 1999, AJ, 117, 1392
- Bonnell & Bate (2006) Bonnell, I. A., & Bate, M. R. 2006, MNRAS, 370, 488
- Bressert et al. (2012) Bressert, E., Ginsburg, A., Bally, J., et al. 2012, ApJ, 758, L28
- Burkert & Hartmann (2004) Burkert, A., & Hartmann, L. 2004, ApJ, 616, 288
- Chieze et al. (1998) Chieze, J.-P., Pineau des Forets, G., & Flower, D. R. 1998, MNRAS, 295, 672
- Cortes et al. (2010) Cortes, P. C., Parra, R., Cortes, J. R., & Hardy, E. 2010, A&A, 519, A35
- Csengeri et al. (2011a) Csengeri, T., Bontemps, S., Schneider, N., Motte, F., & Dib, S. 2011a, A&A, 527, A135+
- Csengeri et al. (2011b) Csengeri, T., Bontemps, S., Schneider, N., et al. 2011b, ApJ, 740, L5+
- Draine (1980) Draine, B. T. 1980, ApJ, 241, 1021
- Flower et al. (1996) Flower, D. R., Pineau des Forets, G., Field, D., & May, P. W. 1996, MNRAS, 280, 447
- Ginsburg et al. (2012) Ginsburg, A., Bressert, E., Bally, J., & Battersby, C. 2012, ApJ, 758, L29
- Griffin et al. (2010) Griffin, M. J., Abergel, A., Abreu, A., et al. 2010, A&A, 518, L3+
- Gueth et al. (1998) Gueth, F., Guilloteau, S., & Bachiller, R. 1998, A&A, 333, 287
- Guillet et al. (2009) Guillet, V., Jones, A. P., & Pineau Des Forêts, G. 2009, A&A, 497, 145
- Guillet et al. (2007) Guillet, V., Pineau Des Forêts, G., & Jones, A. P. 2007, A&A, 476, 263
- Guillet et al. (2011) —. 2011, A&A, 527, A123
- Gusdorf et al. (2008a) Gusdorf, A., Cabrit, S., Flower, D. R., & Pineau Des Forêts, G. 2008a, A&A, 482, 809
- Gusdorf et al. (2008b) Gusdorf, A., Pineau Des Forêts, G., Cabrit, S., & Flower, D. R. 2008b, A&A, 490, 695
- Güsten & Philipp (2004) Güsten, R., & Philipp, S. D. 2004, in The Dense Interstellar Medium in Galaxies, ed. S. Pfalzner, C. Kramer, C. Staubmeier, & A. Heithausen, 253
- Hartmann et al. (2001) Hartmann, L., Ballesteros-Paredes, J., & Bergin, E. A. 2001, ApJ, 562, 852
- Hartmann et al. (2012) Hartmann, L., Ballesteros-Paredes, J., & Heitsch, F. 2012, MNRAS, 420, 1457
- Hartmann & Burkert (2007) Hartmann, L., & Burkert, A. 2007, ApJ, 654, 988
- Hatchell et al. (2001) Hatchell, J., Fuller, G. A., & Millar, T. J. 2001, A&A, 372, 281
- Heitsch & Hartmann (2008) Heitsch, F., & Hartmann, L. 2008, ApJ, 689, 290
- Heitsch et al. (2008) Heitsch, F., Hartmann, L. W., & Burkert, A. 2008, ApJ, 683, 786
- Heitsch et al. (2011) Heitsch, F., Naab, T., & Walch, S. 2011, MNRAS, 415, 271
- Hennemann et al. (2012) Hennemann, M., Motte, F., Schneider, N., et al. 2012, A&A, 543, L3
- Henshaw et al. (2013) Henshaw, J. D., Caselli, P., Fontani, F., et al. 2013, MNRAS, 428, 3425
- Hildebrand (1983) Hildebrand, R. H. 1983, QJRAS, 24, 267
- Hill et al. (2011) Hill, T., Motte, F., Didelon, P., et al. 2011, A&A, 533, A94
- Hill et al. (2012) Hill, T., André, P., Arzoumanian, D., et al. 2012, A&A, 548, L6
- Hosokawa & Omukai (2009) Hosokawa, T., & Omukai, K. 2009, ApJ, 691, 823
- Inoue & Fukui (2013) Inoue, T., & Fukui, Y. 2013, ArXiv: 1305.4655, submitted to ApJL
- Inoue & Inutsuka (2009) Inoue, T., & Inutsuka, S.-i. 2009, ApJ, 704, 161
- Jiménez-Serra et al. (2010) Jiménez-Serra, I., Caselli, P., Tan, J. C., et al. 2010, MNRAS, 406, 187
- Jones et al. (2012) Jones, P. A., Burton, M. G., Cunningham, M. R., et al. 2012, MNRAS, 419, 2961
- Jørgensen et al. (2011) Jørgensen, J. K., Bourke, T. L., Nguyen Luong, Q., & Takakuwa, S. 2011, A&A, 534, A100+
- Kauffmann et al. (2013) Kauffmann, J., Pillai, T., & Zhang, Q. 2013, ApJ, 765, L35
- Koyama & Inutsuka (2000) Koyama, H., & Inutsuka, S. 2000, ApJ, 532, 980
- Kruijssen et al. (2013) Kruijssen, J. M. D., Longmore, S. N., Elmegreen, B. G., et al. 2013, ArXiv: 1303.6286, submitted to MNRAS
- Krumholz & Matzner (2009) Krumholz, M. R., & Matzner, C. D. 2009, ApJ, 703, 1352
- Krumholz et al. (2009) Krumholz, M. R., McKee, C. F., & Tumlinson, J. 2009, ApJ, 693, 216
- Le Picard et al. (2001) Le Picard, S. D., Canosa, A., Pineau des Forêts, G., Rebrion-Rowe, C., & Rowe, B. R. 2001, A&A, 372, 1064
- Lefloch et al. (1998) Lefloch, B., Castets, A., Cernicharo, J., & Loinard, L. 1998, ApJ, 504, L109
- Lesaffre et al. (2013) Lesaffre, P., Pineau des Forêts, G., Godard, B., et al. 2013, A&A, 550, A106
- López-Sepulcre et al. (2011) López-Sepulcre, A., Walmsley, C. M., Cesaroni, R., et al. 2011, A&A, 526, L2+
- Martin-Pintado et al. (1997) Martin-Pintado, J., de Vicente, P., Fuente, A., & Planesas, P. 1997, ApJ, 482, L45
- Meixner & Tielens (1993) Meixner, M., & Tielens, A. G. G. M. 1993, ApJ, 405, 216
- Menten et al. (2009) Menten, K. M., Wilson, R. W., Leurini, S., & Schilke, P. 2009, ApJ, 692, 47
- Molinari et al. (2010) Molinari, S., Swinyard, B., Bally, J., et al. 2010, A&A, 518, L100+
- Motte et al. (2012) Motte, F., Bontemps, S., Hennemann, M., et al. 2012, in SF2A-2012: Proceedings of the Annual meeting of the French Society of Astronomy and Astrophysics, ed. S. Boissier, P. de Laverny, N. Nardetto, R. Samadi, D. Valls-Gabaud, & H. Wozniak, 45–50
- Motte et al. (2005) Motte, F., Bontemps, S., Schilke, P., et al. 2005, in IAU Symposium, Vol. 227, Massive Star Birth: A Crossroads of Astrophysics, ed. R. Cesaroni, M. Felli, E. Churchwell, & M. Walmsley, 151–156
- Motte et al. (2007) Motte, F., Bontemps, S., Schilke, P., et al. 2007, A&A, 476, 1243
- Motte et al. (2003) Motte, F., Schilke, P., & Lis, D. C. 2003, ApJ, 582, 277
- Motte et al. (2010) Motte, F., Zavagno, A., Bontemps, S., et al. 2010, A&A, 518, L77+
- Müller et al. (2005) Müller, H. S. P., Schlöder, F., Stutzki, J., & Winnewisser, G. 2005, Journal of Molecular Structure, 742, 215
- Nguyen Luong et al. (2011a) Nguyen Luong, Q., Motte, F., Hennemann, M., et al. 2011a, A&A, 535, A76
- Nguyen Luong et al. (2011b) Nguyen Luong, Q., Motte, F., Schuller, F., et al. 2011b, A&A, 529, A41+
- Poglitsch et al. (2010) Poglitsch, A., Waelkens, C., Geis, N., et al. 2010, A&A, 518, L2+
- Requena-Torres et al. (2006) Requena-Torres, M. A., Martín-Pintado, J., Rodríguez-Franco, A., et al. 2006, A&A, 455, 971
- Rivera-Ingraham et al. (2013) Rivera-Ingraham, A., Martin, P. G., Polychroni, D., et al. 2013, ApJ, 766, 85
- Rodríguez & Zapata (2013) Rodríguez, L. F., & Zapata, L. A. 2013, ApJ, 767, L13
- Rohlfs & Wilson (2000) Rohlfs, K., & Wilson, T. L. 2000, Tools of radio astronomy (Springer)
- Roussel (2012) Roussel, H. 2012, arXiv:1205.2576
- Schilke et al. (2001) Schilke, P., Benford, D. J., Hunter, T. R., Lis, D. C., & Phillips, T. G. 2001, ApJS, 132, 281
- Schilke et al. (1997) Schilke, P., Groesbeck, T. D., Blake, G. A., & Phillips, T. G. 1997, ApJS, 108, 301
- Schneider et al. (2010a) Schneider, N., Csengeri, T., Bontemps, S., et al. 2010a, A&A, 520, A49
- Schneider et al. (2010b) Schneider, N., Motte, F., Bontemps, S., et al. 2010b, A&A, 518, L83+
- Schneider et al. (2012) Schneider, N., Csengeri, T., Hennemann, M., et al. 2012, A&A, 540, L11
- Smith et al. (1978) Smith, L. F., Biermann, P., & Mezger, P. G. 1978, A&A, 66, 65
- van Loo et al. (2007) van Loo, S., Falle, S. A. E. G., Hartquist, T. W., & Moore, T. J. T. 2007, A&A, 471, 213
- Watt & Mundy (1999) Watt, S., & Mundy, L. G. 1999, ApJS, 125, 143
- Whitworth et al. (1994a) Whitworth, A. P., Bhattal, A. S., Chapman, S. J., Disney, M. J., & Turner, J. A. 1994a, A&A, 290, 421
- Whitworth et al. (1994b) —. 1994b, MNRAS, 268, 291
- Yusef-Zadeh et al. (2013) Yusef-Zadeh, F., Royster, M., Wardle, M., et al. 2013, ApJ, 767, L32
Appendix A Appendix A: Online images
In Fig. 8, we show the composite 3-color Herschel image of the W43 molecular cloud complex (70 µm: blue, 160 µm: green, 250 µm: red).
Appendix B Saturation correction of Herschel/SPIRE images
We explain here the process developed to correct for the saturation of SPIRE images, presented in Sect. 2.1 and used to build the column density and dust temperature images (see Sect. 3.1). This process has already been successfully used to correct the bright-mode SPIRE images of the HOBYS Key program (e.g. Rivera-Ingraham et al. (2013); Fallscheer et al. subm.). In the case of W43, the Hi-GAL observations were performed in the nominal voltage bias mode, and as a result, the SPIRE detectors were saturating on bright sources, i.e. the inner parts of W43-Main and W43-South. We used SPIRE data taken in the bright-source voltage bias mode, as part of the HOBYS project (see Sect. 2.1), to replace the Hi-GAL map pixels suffering from soft saturation (see definition in Sect. B.1) or which are just missing. To this end, the HOBYS data were processed through the exact same steps as those used for the Hi-GAL data, including mapping into the same coordinate system using Scanamorphos (see Sect. 2.1 and Figs. 10a-f.).
B.1. Determination of the “soft”-saturation limit
In Fig. 11, we plotted the signal and weight maps of the region around W43-Main as observed by the Hi-GAL and HOBYS surveys (top and bottom rows respectively). Saturated map pixels were flagged as NaN when all bolometers passing over the regions produced signals that fell out the range of the electronics. These pixels are shown in white and are located over the W43-MM1, W43-MM2, and W43-MM3 massive dense cores. The astronomical surface brightness at which this occurs varies from bolometer to bolometer as it depends on how the voltage offset for the detector signal was set at the beginning of the observation. In practice, a bolometer with a baseline signal near the high signal limit saturates more easily.
Furthermore, the map pixels near the bright saturated regions have a non-linear response to the incoming flux. Bolometers travelling up or down the bright sources produced usable data only at the faint beginning and end of their measurements. In this case, the signal values of the map pixels were weighted down with increasing surface brightness, making signals close to bright sources no longer reliable. This is illustrated by the sudden decrease in the weight map toward the centers of the W43-MM1, W43-MM2, and W43-MM3 massive dense cores (see Fig. 11 upper right). Therefore, it is also necessary to replace the signal in these “softly”-saturated pixels. We visually checked both the weight and signal maps around the NaN pixels and determined that map pixels with fluxes larger than 150 Jy/beam, for all Herschel wavebands, are significantly affected by saturation effects. This threshold value is also consistent with the surface brightness above which individual bolometers of the SPIRE arrays were saturated in flux calibration data (Bendo et al., 2013).
B.2. Offset addition to the bright-source-mode maps & replacement of saturated pixels in the nominal-mode maps
Before replacing the saturated pixels in the nominal voltage bias mode (Hi-GAL) SPIRE maps with those from the bright-source voltage bias mode (HOBYS) maps, we added offsets to the bright-mode map pixels. To derive such offsets, we first masked the region surrounding the NaN pixels, then correlated surface brightness pixel by pixel over the common areas where Hi-GAL pixels are not saturated (see Figs. 12a-c). The correlation weakens as the surface brightness increases, especially above the “soft”-saturation limit of 150 Jy/beam. Elsewhere, both datasets are linearly correlated, as shown in Figs. 12a-c. The pixels with fluxes 150 Jy/beam in the Hi-GAL maps, i.e. the saturated pixels and those with non-linear response, were then replaced by the ones from the HOBYS maps with offsets. As can be seen in Figs. 13a-c, the repaired maps better correlate with the bright-mode maps. The resulting image presents a smooth transition from the pixels initially coming from the Hi-GAL dataset and the HOBYS dataset with offsets added.
Appendix C Conversion the unit of line luminosity from K km s-1 kpc2 into solar luminosity
The unit K km s-1 kpc2 of the molecular line luminosity calculated from Equation 4.2 can be expressed also in the unit of the sun bolometric luminosity . One equals W, which can be converted into the Jy unit of flux density as Jy Hz m2 = Jy Hz kpc2. The frequency-integrated flux density unit Jy Hz is equivalent to the velocity-integrated main-beam temperature K km s-1, the conversion between the two units is as following
| (C1) |
Thus, for our SiO 2–1 observation, the conversion between the line luminosity in unit of K km s-1 kpc2 to the unit of the sun bolometric luminosity is
| (C2) |