Dynamical mass of the O-type supergiant in Zeta Orionis A††thanks: Based in part on observations collected at the European Southern Observatory, Chile (Prop. No. 076.C-0431, 080.A-9021, 083.D-0589, 285.D-5042)
Abstract
Aims. A close companion of Orionis A was found in 2000 with the Navy Precision Optical Interferometer (NPOI), and shown to be a physical companion. Because the primary is a supergiant of type O, for which dynamical mass measurements are very rare, the companion was observed with NPOI over the full 7-year orbit. Our aim was to determine the dynamical mass of a supergiant that, due to the physical separation of more than 10 AU between the components, cannot have undergone mass exchange with the companion.
Methods. The interferometric observations allow measuring the relative positions of the binary components and their relative brightness. The data collected over the full orbital period allows all seven orbital elements to be determined. In addition to the interferometric observations, we have analyzed archival spectra obtained at the Calar Alto, Haute Provence, Cerro Armazones, and La Silla observatories, as well as new spectra obtained at the VLT on Cerro Paranal. In the high-resolution spectra we identified a few lines that can be associated exclusively to one or the other component for the measurement of the radial velocities of both. The combination of astrometry and spectroscopy then yields the stellar masses and the distance to the binary star.
Results. The resulting masses for components Aa of and Ab of are low compared to theoretical expectations, with a distance of pc which is smaller than a photometric distance estimate of pc based on the spectral type B0III of the B component. If the latter (because it is also consistent with the distance to the Orion OB1 association) is adopted, the mass of the secondary component Ab of would agree with classifying a star of type B0.5IV. It is fainter than the primary by about magnitudes in the visual. The primary mass is then determined to be . The possible reasons for the distance discrepancy are most likely related to physical effects, such as small systematic errors in the radial velocities due to stellar winds.
Key Words.:
techniques: interferometric - binaries: spectroscopic - stars: supergiants - stars: fundamental paramaters - stars: individual: Zeta Orionis A1 Introduction
Studies of double-lined eclipsing binaries have been very successful in measuring masses of stars on the main sequence (Torres et al., 2010) with high enough accuracies to challenge stellar evolution models. The latter have held up well even for O-type stars (Gies, 2003). However, even though O-type supergiants have also been found in eclipsing binaries, the observational selection bias that favors closer systems over wider ones, would indicate a high probability that the components in these systems have interacted and therefore would not be described by single-star evolution models.
High-angular resolution techniques based on optical long baseline interferometers have overcome this limitation and have contributed significantly to the stock of precise stellar mass measurements. Here we report on our attempt to make the first such determination for a supergiant in a detached system, excluding any mass transfer.
Hummel et al. (2000) found a companion 40 mas from the O9.5 Ib component A (HR 1948) of the wide double Orionis AB, and detected orbital motion over the course of a few months. Using the Navy Precision Optical Interferometer(Armstrong et al., 1998), we continued observations over the 7.3 year orbital period in order to determine the orbital elements. Component B (HR 1949) showed slow motion relative to A by increasing the position angle 9.6 degrees over the past century, and by decreasing the separation by 116 mas at the same time. It is currently 2.40 arcsec away from the primary at a position angle of 165 degrees (Washington Double Star Catalog). We interpret this as orbital motion in a common proper motion physical pair.
A detailed spectroscopic study of Orionis A was carried out by Bouret et al. (2008), who determined an effective temperature of K for component Aa (the secondary, Ab, was not taken into account) and with normal abundances. The rotational velocity (of the primary) was determined to be km/s, and the rotation period to seven days, implying an inclination of the rotation axis of .
Meanwhile, we were able to identify photospheric lines of both the primary and secondary components in archival spectra obtained with HEROS and FEROS at La Silla, Chile, with BESO at Cerro Armazones, Chile, FOCES at Calar Alto, Spain, and new observations with UVES at the VLT. This allowed us to determine a dynamical mass and distance to Orionis A.
2 Observations and data reduction
2.1 Interferometry
Observations prior to 2000 were described in Hummel et al. (2000). While these and the observation in 2000 used the three-way beam combiner, subsequent observations used the six-way beam combiner described by Armstrong et al. (1998). In Table 1 we list the dates and stations used (along with astrometric results described later). For a given combination of stations (“configuration”, per spectrometer), the signals of all baselines thus realized were decoded and Fourier-transformed to yield complex visibilities as described by Hummel et al. (2003). For the observations in the years of 2004 and later, fewer than the maximum number of stations were allowed to illuminate a spectrometer owing to crosstalk between the fringe signals at different modulation frequencies.
The data were reduced as described by Hummel et al. (2003). Additional “incoherent” scans away from the fringe packet were executed for each star and each station configuration in order to precisely determine the visibility bias. Calibration was performed using interleaved observations of Orionis adopting a limb-darkened diameter of 0.9 mas (Mozurkewich et al., 1991), for each configuration separately. Calibration uncertainties based on scan-to-scan variations in the calibrator visibility range from a few percent up to 20%, and in the closure phase up to a few degrees. Since channel-to-channel variations of the visibility amplitude spectra are much lower in value, we allowed the calibration of each spectrum to float during the astrometric fits rather than applying the larger calibration uncertainties. The (limb-darkened) diameter of Orionis Aa was determined to be 0.58 mas by Remie & Lamers (1982) based on the infrared flux method, and measured to be mas by Hanbury Brown et al. (1974) using an intensity interferometer. The latter group already noticed the presence of a third component in the Ori AB system, and even predicts a magnitude difference of about 2 mag. However, they state that the stellar diameter derived from intensity interferometry should be taken as trustworthy for component Aa, since the contributions from the additional components would be much smaller than the uncertainty. We computed an additional estimate of the diameter based on a B0I template SED fit to archival photometry, giving a value of mas. We therefore adopted a “mean” value of 0.48 mas, but such a diameter is mostly unresolved by our interferometric observations.
As an example, we show visibility spectra of all six baselines in a full four-station observation in Fig. 1. The full coverage of the sinusoidal visibility variation demonstrates that the precision of the astrometric fits should in fact benefit from a floating calibration.

| Feb 13 | 1998.12 | CEW | 42.1 | 276.3 | 0.60 | 0.13 | 175 |
| Feb 14 | 1998.12 | CEW | 42.1 | 276.4 | 0.60 | 0.13 | 176 |
| Mar 03 | 1998.17 | CEW | 42.5 | 275.1 | 0.58 | 0.13 | 175 |
| Mar 20 | 1998.21 | CEW | 43.0 | 273.9 | 0.58 | 0.15 | 176 |
| Nov 19 | 1998.88 | EW | 46.7 | 260.0 | 2.40 | 0.11 | 163 |
| Nov 26 | 1998.90 | CEW | 46.8 | 258.8 | 0.56 | 0.16 | 178 |
| Feb 13 | 1999.12 | CW | 47.3 | 254.6 | 2.20 | 0.19 | 155 |
| Feb 17 | 1999.13 | CW | 47.2 | 254.2 | 2.13 | 0.18 | 155 |
| Feb 18 | 1999.13 | CW | 47.2 | 254.0 | 1.65 | 0.20 | 153 |
| Feb 23 | 1999.14 | CEW | 47.0 | 253.8 | 0.58 | 0.14 | 176 |
| Mar 29 | 1999.24 | CEW | 47.1 | 251.7 | 0.58 | 0.19 | 179 |
| Mar 30 | 1999.24 | CEW | 47.1 | 251.6 | 0.55 | 0.16 | 177 |
| Oct 18 | 2000.80 | CEW | 37.3 | 214.1 | 0.64 | 0.11 | 177 |
| Jan 09 | 2002.02 | EWNE2 | 26.2 | 154.7 | 0.25 | 0.13 | 146 |
| CWE2W7 | |||||||
| Jan 12 | 2002.03 | EWNE2 | 26.1 | 153.8 | 0.25 | 0.15 | 146 |
| CWE2W7 | |||||||
| Dec 20 | 2002.97 | EWNE2 | 24.5 | 87.7 | 0.20 | 0.15 | 176 |
| CWE2 | |||||||
| Mar 11 | 2004.19 | CE, CW | 23.5 | 332.2 | 0.49 | 0.28 | 178 |
| Mar 12 | 2004.19 | CE, CW | 23.6 | 332.5 | 0.48 | 0.29 | 6 |
| Feb 24 | 2006.15 | CEN | 46.4 | 261.5 | 0.28 | 0.15 | 23 |
| CWE6 |
We determined the separation, , and position angle, , of the binary components for each night from the visibility data, starting with estimates derived from images made using standard phase self-calibration and deconvolution methods (see examples in Hummel et al., 2000). This procedure enabled unambiguous identification of the global minimum of corresponding to the best fit values of and to the visibility data. The astrometric fit results are also listed in Table 1. The uncertainty ellipses correspond to one-seventh of the synthesized beam, which has been shown to give realistic estimates of the astrometric accuracy of NPOI multi-baseline observations. Using the orbit determined with these measurements (as described below), a simultaneous fit to all visibility data determined the magnitude difference to be over the NPOI band width (m) without significant color changes.
2.2 Spectroscopy
Spectroscopic observations were taken with various echelle instruments. In 1995, 1997, and 1998 spectra were obtained with the HEROS instrument, attached to ESO telescopes on La Silla. The HEROS observational campaigns were described by Kaufer (1998), and the data format and processing in detail by Stahl et al. (1995). In brevity, HEROS provided spectra with a spectral resolution of from about 350 to about 870 nm. For individual spectra a above 100 was aimed for. For Ori, there were 57 spectra taken in 1995 (MJD 49747 to 49804), 16 in 1997 (MJD 50449 to 50457), and 64 in 1998 (MJD 51143 to 51160). For the purpose of this work, deriving the orbital radial velocity (RV) variations, spectra within one season have been averaged to increase to almost 1000, and the mean time was taken as epoch.
FEROS data were obtained from the ESO archive. In 2006, one single spectrum was taken at MJD=53738, and in 2009 5 spectra were obtained on MJD=54953. FEROS data range from 370 nm to 900 nm with . See Kaufer et al. (1999) for a more detailed description of the instrument. The combined for each epoch is between 100 and 200.
A single spectrum was taken in 2001 with FOCES at the 2.2 m telescope of Calar Alto, Spain. The wavelength coverage ranges from 390 nm to 950 nm, with . Data reduction was performed using the FOCES data reduction software by N. Przybilla (priv. comm.).
Several spectra were recorded over three observing seasons in 2009 and 2010 by the BESO spectrometer (based on the FEROS design) at the Hexapod 1.5m telescope at Cerro Armazones, Chile. The wavelength coverage ranges from 370 nm to 860 nm, with .
A few spectra taken in 1995, 1998, and 1999 were found in the public ELODIE archive111http://atlas.obs-hp.fr/elodie/ of the Haute Provence Observatory (Moultaka et al., 2004), covering the wavelength range of 400 nm to 680 nm, at .
Finally, UVES spectra have been obtained in the 437+760 setting (Dekker et al., 2000) separately of components A and B, which were easily resolved. A total of 32 spectra were taken of Ori A within half an hour and averaged to a combined of well above 1000. Additionally, five/four (blue/red arm) spectra of Ori B were taken, with a combined of about 500.
We checked the wavelength calibration to confirm the same position of the interstellar Ca ii H (3934) and Na i (D1) lines (5896) in all spectra. The rms variation was 1.0 km s-1 and 1.7 km s-1, respectively. However, these lines are shifted by several times the rms in the FOCES spectrum, and the same is true for the Na D line in all but the last epoch of the ELODIE spectra. The wavelength calibration of these spectra should therefore be considered uncertain so they were excluded from further analysis.
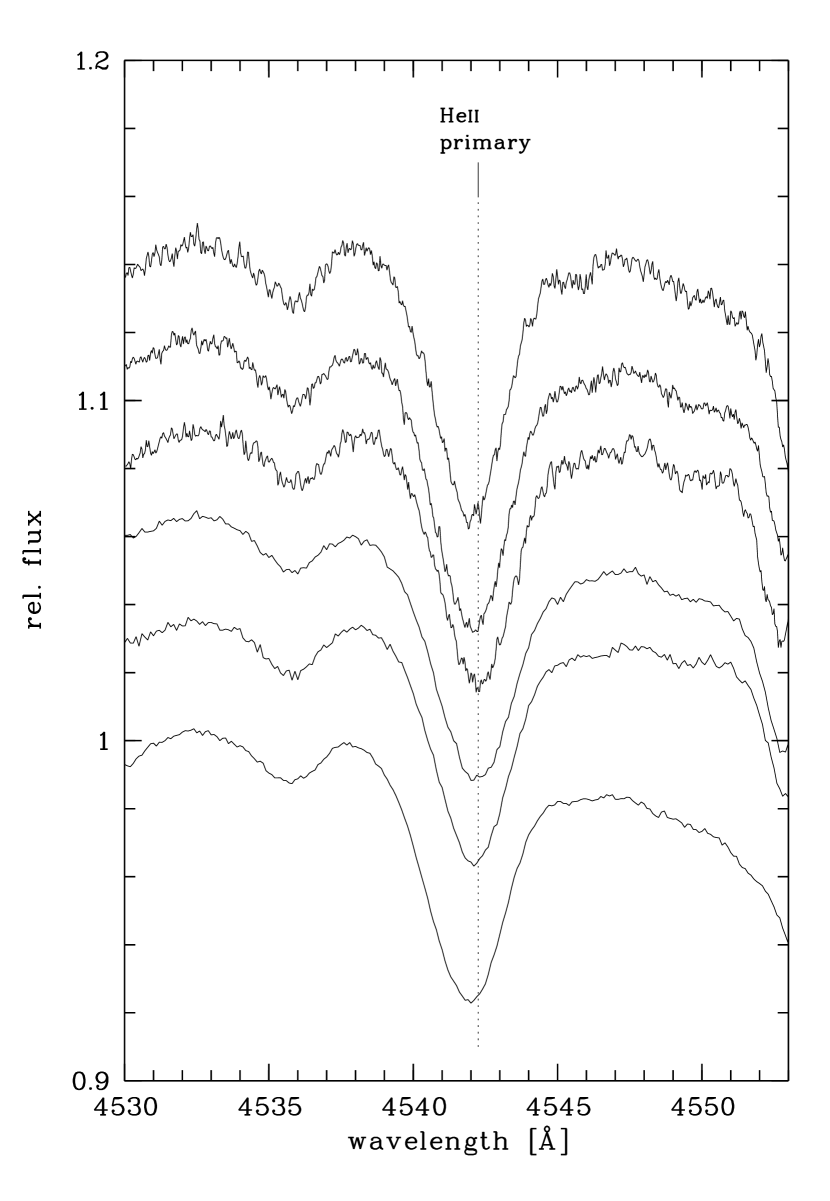
In the spectra all He i lines, as well as He ii 4686, have a relatively narrow core with varying RV in one direction, while the line wings are shifted in anti-phase with respect to the cores. This is the signature of a double-lined (SB2) binary. For some lines (almost) exclusive formation in the O9.5 component can be assumed. The best candidates are the He ii lines, typically not seen in B-type stars (except He ii 4686, which explains why RVs we derived from single Gaussian profiles fitted to this line did not show orbital motion). We also noticed systematic offsets between lines nearly independent of the orbital phase, such as an offset of about 5 km/s between the He ii lines at 4542 and 4200, which appeared to be due to a slight non-Gaussian shape of the latter. Such offsets were also noted by Rauw et al. (2012) in the case of another O-star binary. Therefore, we decided not to use multi-line fits and derived RVs from He ii 4542 with Gaussian fits to the line. The width of this line was about 3 , as expected from the of 110 km/s. Theoretical spectra based on model atmospheres (Hubeny & Lanz, 1995) show that this line is basically absent in an early type B dwarf or subgiant ( K and ). However, Bouret et al. (2008) note line shape variability with a peak-to-peak maximal amplitude of 17 km/s (in particular He i 4922) on time scales of the rotational period of the primary related to its magnetic field modulating the wind.
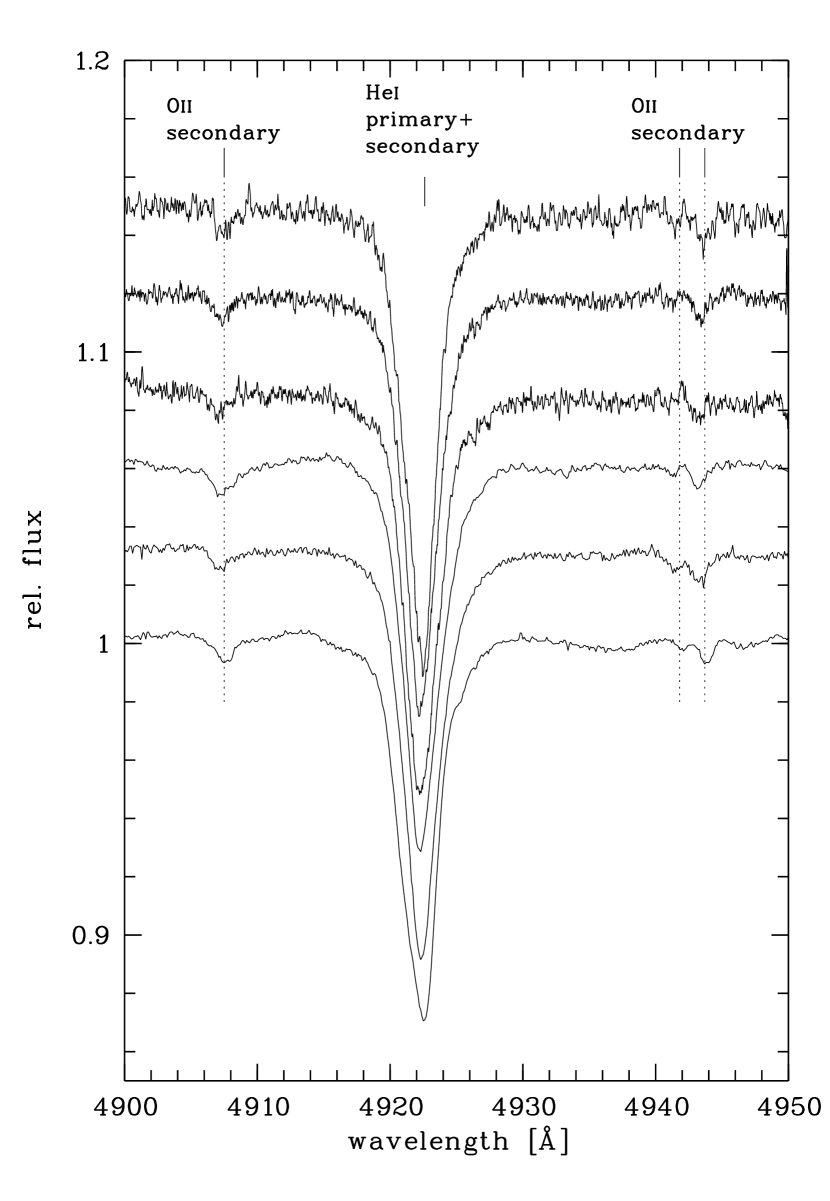
There are as well very weak and rather narrow lines that are not expected in the O9 Ib star. These narrow lines are RV variable in the same sense as the cores of stronger lines, i.e. they belong to the companion and are indicative of an early type B star. Again, we fit Gaussian profiles to the O ii 4941 and 4943 lines to derive the RV of the secondary (as a single parameter in the fit). The width of these lines was typically 1 . Theoretical spectra (Hubeny & Lanz, 1995) confirm that these lines are deeper by a factor of five than the same lines in an O9.7 supergiant ( K and ). Combined with the fact that the primary lines are rotationally broadened, this choice for measuring the secondary velocities is justified. The O ii 4907 line was not usable in several spectra, and was therefore not included. The results of the Gaussian-fit measurements are given in Table 2.
We estimated the uncertainty of each RV measurement of the secondary from their spread when fit to simulated line profiles designed to have the same noise statistics and residual fit deviations from Gaussian profiles as the measured profile (Monte Carlo method). For the lines of the primary, which had a much higher S/N, we estimated the level of systematic error related to profile variations by comparing the Gaussian fit results with RVs obtained by matching the mirrored profile with itself at about half of the line depth. The resulting estimate for the lower limit of the uncertainty related to non-Gaussian profiles of 1.5 km/s applicable to all observations of this line was then added in quadrature to the Monte Carlo uncertainty estimate for each measurement.
| JD-2400000 | Phase | He ii 4542 | O ii 4943 | Instrument |
|---|---|---|---|---|
| 49771.5 | 0.90 | 16.7 1.8 | 50.0 2.8 | HEROS |
| 50454.5 | 0.15 | 31.0 2.1 | 24.2 2.6 | HEROS |
| 51143.5 | 0.41 | 35.0 1.7 | 14.9 3.3 | HEROS |
| 52182.7 | 0.79 | 25.8: | 33.3: | FOCES |
| 53738.7 | 0.37 | 39.6 1.9 | 12.8 5.0 | FEROS |
| 54501.5 | 0.66 | 29.7 2.3 | 21.7 2.3 | FEROS |
| 54873.6 | 0.80 | 23.2 1.6 | BESO | |
| 54919.5 | 0.81 | 23.9 1.7 | BESO | |
| 55170.7 | 0.91 | 14.1 1.6 | BESO | |
| 55235.5 | 0.93 | 20.3 3.0 | BESO | |
| 55237.6 | 0.93 | 20.4 3.7 | BESO | |
| 54954.5 | 0.83 | 23.8 1.8 | 39.0 2.3 | FEROS |
| 55435.9 | 0.01 | 20.5 1.8 | 47.3 3.3 | UVES |
| 50030.7 | 0.99 | 19.4: | 42.7: | ELODIE |
| 51144.9 | 0.41 | 35.3: | 8.0: | ELODIE |
| 51533.3 | 0.55 | 29.6 2.9 | ELODIE |
| Orbital period | d |
|---|---|
| Periastron epoch | JD |
| Periastron long. | |
| Eccentricity | |
| Ascending node | |
| Inclination | |
| Semi-major axis | mas |
| Systemic velocity | km/s |
| Orbital parallax | mas |
| Visual magnitude difference | |
| (derived) | km/s |
| (derived) | km/s |
3 Results and discussion
3.1 Orbital elements and distance
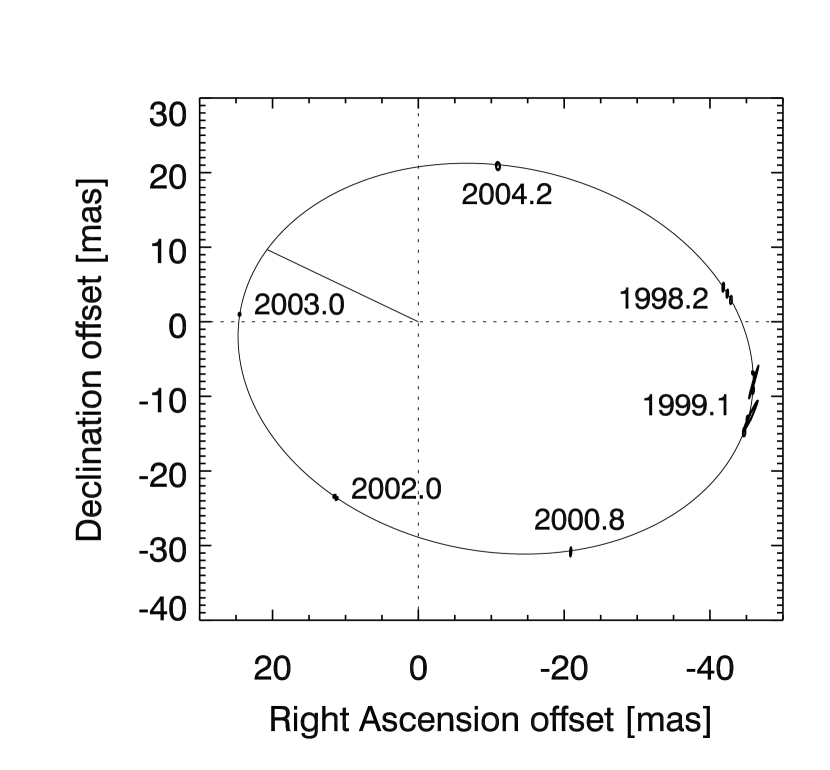
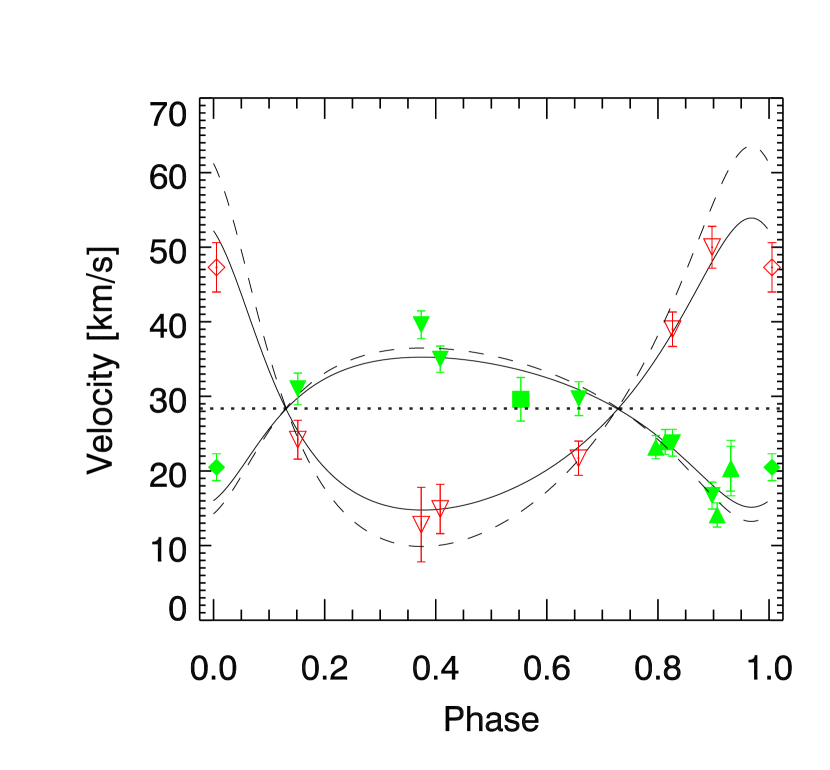
We fit the seven orbital elements, the systemic velocity, and the stellar masses, to the astrometric positions and RVs. Initial estimates of the elements of the apparent orbit were obtained using the Thiele-Innes method. Thanks to the high precision of the astrometric orbit, the elements in common with the spectroscopic orbit did not change much after including the RV data. The latter mostly constrained the mass estimates. The reduced of the fits was about 0.5 for astrometry and 1.0 for spectroscopy. No significant offset between the systemic velocities for primary and secondary was found (at a level of 1 km/s). The results are summarized in Table 3, and Figs. 4 and 5 show the fit to the measurements. An orbital parallax of mas was derived, corresponding to a distance of pc and a distance modulus of 7.4. Orionis is a member of the Orion OB1 association, more specifically of the OB1b subgroup which is centered on the belt stars (Bally, 2008). The Orion star forming regions are typically assumed to be at about 400 pc. Menten et al. (2007) derived a distance of pc from VLBA astrometry to the Orion nebula cluster, confirmed by Kraus et al. (2009), who obtained an orbital parallax from one of its members. Our measurement here of Ori comes in low and would indicate a location on the near side of the association.
Apart from the more general criticism of Hipparcos distances of O-stars expressed by Schröder et al. (2004), there are reasons particular to the Ori system to be careful. As an astrometric binary with a period of less than a decade, and Hipparcos measuring over three years, a five-parameter solution, i.e. without taking orbital acceleration into account, is probably not sufficient. However, in the new Hipparcos reduction (van Leeuwen, 2007), Ori data was solved with five parameters only for a distance of pc. For this reason we discard the Hipparcos parallax for determining the distance. A distance measurement to Ori derived from the Ca ii H+K equivalent width, which gives pc (Megier et al., 2009), is potentially problematic, because the short distance makes it sensitive to localized density fluctuations. Despite the apparent agreement of these results with our distance estimate, we take an alternative approach in the following.
The distance can also be estimated photometrically, in particular since all components contributing to the integrated light are known now with some certainty. Strömgren photometry was taken from Hauck & Mermilliod (1998). These data, mag, are measurements of the combined flux, i.e. including components Aa, Ab, and B. Worley (1969) lists the magnitude difference between A and B as mag, Edwards (1976) gives mag, and Murphy (1969) mag, however referring to older sources from the first half of the century. In the following, Worley’s value is used. The magnitude difference between Aa and Ab of mag is derived from fitting the interferometric data. With these values, the individual component magnitudes are mag, mag, and mag, while mag.
The colour excess is given as by Lee (1968). Although this excess was derived by assuming a single star, since all three stars in the system are well within the Rayleigh-Jeans tail of their SED, any correction for the presence of the two B stars would be very small. Since Lee notes that in the outer areas of Orion, explicitely including the “northwestern regions”, the extinction would be normal with , the photometric fluxes were dereddened with the usual ; i.e., mag.
Component B is well known to be a B0 III star, which is also confirmed by our spectrum. The B2 III classification by Edwards (1976) comes from a photometric classification scheme utilizing the magnitude difference, but assuming the combined magnitude of the Aa+Ab subsystem is due to component Aa alone. Since Ab was not known then, this introduced a bias.
Assuming an absolute magnitude for a B0 III star of mag (Loktin & Beshenov, 2001; Nieva, 2013) and the above values for and , the distance modulus becomes 7.94 mag. Taking 0.3 mag as combined uncertainty for the distance modulus from , , and , the photometric distance to the Ori system is pc, i.e. the photometric parallax is mas. This value is only marginally consistent with the orbital parallax.
3.2 Stellar parameters
We note that for the photometric distance the absolute magnitudes for components Aa and Ab would point to spectral types of O9.5 Iab and B0.5 IV, in good agreement with the spectroscopic evidence. As the photometric distance is based on a reliable spectral classification of a non-supergiant for which recent calibrations of the absolute magnitude exist Nieva (2013), we regard the photometric distance as more robust than the orbital parallax, which is based on rather low velocity amplitudes. We therefore fit the stellar masses to the combined interferometric and spectroscopic data under the condition that the results are consistent with the photometric distance. The results are given in Table 4. The mass estimates are now significantly higher than those given in Table 3, but in particular for the secondary to be more in line with what is expected for a star of its type and luminosity class (Torres et al., 2010). As far as the mass of the supergiant, no previous dynamical measurements of O-type supergiants exist with periods long enough to exclude a history of mass exchange.
| Parameter | Aa | Ab | B |
|---|---|---|---|
| Sp. type | O9.5 Iab | B1 IV | B0 III |
| [mag] | |||
| (photometry) [mag] | |||
| (orbit) [mag] | |||
| [] | – | ||
| [] | – |
As shown in in Fig. 5, it appears that the problem lies mostly with the velocities of the secondary, which were derived from the O ii 4943 line. As mentioned before, a small contribution of the primary to this line can be expected based on theoretical atmosphere models, which is why it would be premature to claim that the stellar masses derived from the RV curves alone would point to lower values then expected for the supergiant. Since we do not have enough very high S/N spectra (such as the UVES spectrum) to attempt spectral disentangling (e.g., using FDBinary by Ilijic et al. (2004)), we adopt the results that are consistent with the photometric distance.
3.3 Evolutionary state
Given the apparent diameter adopted for the primary, we computed a physical radius of with a parallax mas, consistent with this component being a supergiant. The same value can be derived from the effective temperature and luminosity (see Table 4).
To determine the (approximate) age of Orionis A, we used the stellar evolution models computed by Schaller et al. (1992); Charbonnel et al. (1993); Schaerer et al. (1993); Meynet et al. (1994) for masses of 15 and 25 times solar, for metallicities of 0.001, 0.004, 0.008, 0.020, and 0.040. For metallicities lower than solar, models matching the derived luminosity and effective temperatures are older and place the primary on the hydrogen-shell burning track following the exhaust of the core hydrogen supply. However, the secondary is quite a bit older here than the primary, and these models are therefore invalidated. Using solar metallicity models, , we find that at an age of about 7 Myr, the modeled stars match the observed properties reasonably well, considering that a model for the mass of the primary was not available (Fig. 6). Martins et al. (2012) determined a younger age of Myr based on the combined properties of Ori A (adopting a mass of ), using models of rotating massive stars by Brott et al. (2011).

4 Component B
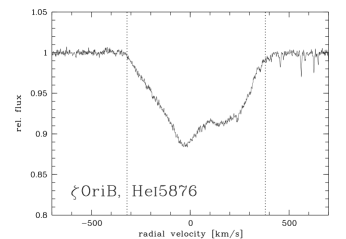
To our knowledge, this is the first time that a high-quality spectrum for component B of the Ori system has been obtained. The spectrum is that of a very rapidly rotating star, at about and a systemic velocity of , the latter consistent with the velocity of the Aa+Ab subsystem. The line profiles in the spectrum are highly distorted from a purely rotationally broadened profile (Fig. 7). Such distortions in early type stars could either be due to abundance patterns on the stellar surface or due to nonradial pulsation. Abundance patterns are unlikely, since the distortion has a similar shape in all lines, regardless of species. To produce such a shape, nonradial pulsation has to be a high-order -mode type, meaning Ori B is a Cephei star without a radial mode, where the photometric variations mostly cancel across the surface. According to Fig. 3 of Telting et al. (2006), such a line profile variation can be found in roughly half of the early B type stars with . Other examples for such rapidly rotating Cephei stars include Aqr (Peters & Gies, 2005) and Sco (Smith, 1986).
5 Conclusions
We have measured the apparent orbit of the companion of Orionis Aa discovered by Hummel et al. (2000) over its seven-year period, and determined the orbital elements. To determine a dynamical mass of the components, we analyzed archival spectra to measure the RV. We determined a dynamical mass estimate (14 M⊙) for the O-type supergiant component Aa, for which any history of mass exchange was excluded owing to the distance of the companion (minimum of 9.5 AU). The orbital parallax, however, indicates a distance (294 pc) of the system from Earth that is shorter than our photometric distance estimate (387 pc) based on the spectral type (B0III) of one of the components. Adopting the photometric distance, the mass of the supergiant would increase to 33 M⊙, closer to expectations based on stellar models. The RVs were based on the shifts in the He ii (4542) line of the primary and the O ii (4943) line of the secondary. Considering the low-velocity semi-amplitude and the paucity of suitable photospheric lines that can be ascribed to just one of the components (our data do not allow disentangling), we conclude that physical processes affecting line properties such as stellar winds may have led to small systematic RV errors.
Acknowledgements.
We thank Dr. Norbert Przybilla for providing the FOCES spectrum. The Navy Precision Optical Interferometer is a joint project of the Naval Research Laboratory and the US Naval Observatory, in cooperation with Lowell Observatory, and is funded by the Office of Naval Research and the Oceanographer of the Navy. The authors would like to thank Jim Benson and the NPOI observational support staff whose efforts made this project possible. This research made use of the NASA ADS abstract service and the SIMBAD database, operated at the CDS, Strasbourg, France. This research also made use of the Washington Double Star Catalog maintained at the U.S. Naval Observatory.References
- Armstrong et al. (1998) Armstrong, J. T., Mozurkewich, D., Rickard, L. J., et al. 1998, ApJ, 496, 550
- Bally (2008) Bally, J. 2008, in Handbook of Star Forming Regions, Volume I, ed. Reipurth, B., 459
- Bouret et al. (2008) Bouret, J., Donati, J., Martins, F., et al. 2008, MNRAS, 389, 75
- Brott et al. (2011) Brott, I., de Mink, S. E., Cantiello, M., et al. 2011, A&A, 530, A115
- Charbonnel et al. (1993) Charbonnel, C., Meynet, G., Maeder, A., Schaller, G., & Schaerer, D. 1993, A&AS, 101, 415
- Dekker et al. (2000) Dekker, H., D’Odorico, S., Kaufer, A., Delabre, B., & Kotzlowski, H. 2000, in Society of Photo-Optical Instrumentation Engineers (SPIE) Conference Series, Vol. 4008, Society of Photo-Optical Instrumentation Engineers (SPIE) Conference Series, ed. M. Iye & A. F. Moorwood, 534–545
- Edwards (1976) Edwards, T. W. 1976, AJ, 81, 245
- Flower (1996) Flower, P. J. 1996, ApJ, 469, 355
- Gies (2003) Gies, D. R. 2003, in IAU Symposium, Vol. 212, A Massive Star Odyssey: From Main Sequence to Supernova, ed. K. van der Hucht, A. Herrero, & C. Esteban, 91
- Hanbury Brown et al. (1974) Hanbury Brown, R., Davis, J., & Allen, L. R. 1974, MNRAS, 167, 121
- Hauck & Mermilliod (1998) Hauck, B. & Mermilliod, M. 1998, A&AS, 129, 431
- Hubeny & Lanz (1995) Hubeny, I. & Lanz, T. 1995, ApJ, 439, 875
- Hummel et al. (2003) Hummel, C. A., Benson, J. A., Hutter, D. J., et al. 2003, AJ, 125, 2630
- Hummel et al. (2000) Hummel, C. A., White, N. M., Elias, II, N. M., Hajian, A. R., & Nordgren, T. E. 2000, ApJ, 540, L91
- Ilijic et al. (2004) Ilijic, S., Hensberge, H., Pavlovski, K., & Freyhammer, L. M. 2004, in Astronomical Society of the Pacific Conference Series, Vol. 318, Spectroscopically and Spatially Resolving the Components of Close Binary Stars, ed. R. W. Hilditch, H. Hensberge, & K. Pavlovski, 111–113
- Kaufer (1998) Kaufer, A. 1998, in Rev. in Mod. Astron. No. 11, ed. E. Schielicke, 177
- Kaufer et al. (1999) Kaufer, A., Stahl, O., Tubbesing, S., et al. 1999, ESO Messenger, 95, 8
- Kraus et al. (2009) Kraus, S., Weigelt, G., Balega, Y. Y., et al. 2009, A&A, 497, 195
- Lee (1968) Lee, T. A. 1968, ApJ, 152, 913
- Loktin & Beshenov (2001) Loktin, A. V. & Beshenov, G. V. 2001, Astronomy Reports, 45, 711
- Martins et al. (2012) Martins, F., Escolano, C., Wade, G. A., et al. 2012, A&A, 538, A29
- Megier et al. (2009) Megier, A., Strobel, A., Galazutdinov, G. A., & Krełowski, J. 2009, A&A, 507, 833
- Menten et al. (2007) Menten, K. M., Reid, M. J., Forbrich, J., & Brunthaler, A. 2007, A&A, 474, 515
- Meynet et al. (1994) Meynet, G., Maeder, A., Schaller, G., Schaerer, D., & Charbonnel, C. 1994, A&AS, 103, 97
- Moultaka et al. (2004) Moultaka, J., Ilovaisky, S. A., Prugniel, P., & Soubiran, C. 2004, PASP, 116, 693
- Mozurkewich et al. (1991) Mozurkewich, D., Johnston, K. J., Simon, R. S., et al. 1991, AJ, 101, 2207
- Murphy (1969) Murphy, R. E. 1969, AJ, 74, 1082
- Nieva (2013) Nieva, M.-F. 2013, A&A, 550, A26
- Peters & Gies (2005) Peters, G. J. & Gies, D. R. 2005, in Astronomical Society of the Pacific Conference Series, Vol. 337, The Nature and Evolution of Disks Around Hot Stars, ed. R. Ignace & K. G. Gayley, 294
- Rauw et al. (2012) Rauw, G., Sana, H., Spano, M., et al. 2012, A&A, 542, A95
- Remie & Lamers (1982) Remie, H. & Lamers, H. J. G. L. M. 1982, A&A, 105, 85
- Schaerer et al. (1993) Schaerer, D., Charbonnel, C., Meynet, G., Maeder, A., & Schaller, G. 1993, A&AS, 102, 339
- Schaller et al. (1992) Schaller, G., Schaerer, D., Meynet, G., & Maeder, A. 1992, A&AS, 96, 269
- Schröder et al. (2004) Schröder, S. E., Kaper, L., Lamers, H. J. G. L. M., & Brown, A. G. A. 2004, A&A, 428, 149
- Smith (1986) Smith, M. 1986, ApJ, 304, 728
- Stahl et al. (1995) Stahl, O., Kaufer, A., Wolf, B., et al. 1995, Journal of Astronomical Data, 1, 3
- Telting et al. (2006) Telting, J. H., Schrijvers, C., Ilyin, I. V., et al. 2006, A&A, 452, 945
- Torres et al. (2010) Torres, G., Andersen, J., & Giménez, A. 2010, A&A Rev., 18, 67
- van Leeuwen (2007) van Leeuwen, F. 2007, A&A, 474, 653
- Worley (1969) Worley, C. E. 1969, AJ, 74, 764