The nucleation parameter for heavy-ion induced bubble nucleation in superheated emulsion detector.
Abstract
The values of the nucleation parameter, k, for bubble nucleation induced by high energy heavy ions 12C ( MeV/u), 20Ne ( MeV/u) and 28Si ( MeV/u) in superheated emulsion detector are determined by comparing the experimentally obtained normalized count rates with those obtained from simulations done using the GEANT3.21 simulation code. The results show that the nucleation parameter depends on the mass number of the incident heavy ions, and decreases with increasing mass number.
keywords:
Detector modelling and simulations I, Liquid detectors1 Introduction
A superheated emulsion detector consists of a large number of drops of superheated liquid suspended in another immiscible liquid-like, soft gel medium or a firm polymer matrix. One form of this detector is known as “superheated drop detector (SDD)” [1] and another form is “bubble detector (BD)”[2]. The basic principle of operation of these detectors is same as that of a bubble chamber [3]. During the passage of an energetic particle through a drop, if the energy deposited within a certain critical length is larger than a certain critical energy, the superheated liquid undergoes a phase transition to vapour phase, i.e., a nucleation event occurs. Acoustic pulse generated in this process constitutes the signal, which is recorded by acoustic sensors. Since 1979 [1], the superheated emulsion is being used in various areas such as in neutron dosimetry [4, 5, 6, 7], gamma ray detection [7, 8, 9], proton detection [10], neutron spectrometry [11, 12, 13, 14] and also in cold dark matter search experiments [15, 16, 17].
An important parameter that characterizes the bubble nucleation process in superheated emulsion detectors is the nucleation parameter. There are various phenomenological models to describe the nucleation process in superheated emulsion [18, 19]. In the present paper, we use the nucleation parameter k as defined in ref. [18], discussed in more details in Section 2. There have been a large number of studies which attempt to estimate the value of nucleation parameter for neutrons [7, 18, 19, 20, 21, 22]. But not much work has been done on estimation of nucleation parameter for heavy ions. In an earlier work [23], the response of SDD to various high energy heavy ions has been studied and the nucleation parameter has been estimated from the experimental results using estimation of dE/dx from SRIM2008 code [24]. In the present work, we consider the detailed geometry of the detector, allowing us to make a more accurate estimate of dE/dx, resulting in a more reliable estimate of the nucleation parameter for heavy ions.
Experimental studies on detection of heavy ions by superheated emulsion detectors have been done in refs. [23, 25, 26, 27]. From measurement of the maximum track length for various ions in a superheated emulsion, the relationship between maximum track length and the atomic number of the ions can be established, allowing identification of heavy ions [25, 26, 27]. The high energy heavy ions used in these studies were 12C (290 MeV/u), 28Si (600 MeV/u), 40Ar (650 MeV/u), 56Fe (500 MeV/u), 84K (400 MeV/u) and 132Xe (290 MeV/u). The response, threshold temperatures and the threshold degree of metastability of nucleation in superheated emulsion made of active liquid R-114 were investigated for different heavy ions with different energies, namely, 12C (180 MeV/u, 230 MeV/u), 20Ne (230 MeV/u, 400 MeV/u), 28Si (180 MeV/u, 490 MeV/u), 40Ar (500 MeV/u), and 56Fe (500 MeV/u) [23, 28]. The track length for protons has also been studied and in this case bubble tracks are formed by protons in the region corresponding to the Bragg peak of protons in the detector [10].
To understand the response of superheated emulsion detectors to various particles, one has to take recourse to simulation. Computational studies of the response of superheated emulsion to neutrons have been done using the frame work of Seitz’s radiation-induced nucleation theory [29, 30]. Monte Carlo studies of the response of superheated drops of liquid C4F10 (b.p.: C) for alpha particles, neutrons, gamma rays and -rays have been done within the context of dark matter search experiments [15, 31]. These studies have allowed determination of various parameters like the alpha detection efficiency as a function of temperature and the loading factor of the detector. It was also established from simulation studies that the maximal alpha detection efficiency is inversely proportional to the drop radius.
In the present work, we present our results of the simulation of the response of superheated emulsion with active liquid R-114 (C2Cl2F4; b.p. C) to heavy ions 12C ( MeV/u), 20Ne ( MeV/u) and 28Si ( MeV/u) using GEANT3.21 simulation toolkit [32]. We also study the possible dependence of the nucleation parameter k [18] on the mass of the heavy ions. We have performed two separate sets of simulations, referred to as Simulation I and Simulation II. In Simulation I, we simulated the geometry of the experimental set up of the actual experiment to calculate the expected nucleation rate. In Simulation II, instead of simulating the whole experimental set up, we independently determined the bubble nucleation probability of a single drop as a function of the nucleation parameter, k, using GEANT3.21. This nucleation probability is used to calculate the expected number of nucleation events for the same experiment. The normalized count rates at the threshold temperature of bubble nucleation, for the high energy heavy ions 12C ( MeV/u), 20Ne ( MeV/u) and 28Si ( MeV/u) from the above two simulations are compared with the experimental data [23] to estimate the nucleation parameter k, for the heavy ions. 111Lest there be confusion, we mention here that the results of the present paper are not directly applicable to the case of WIMP (cold dark matter candidate) search using SDDs. This is because of the huge difference in the energy scales of the ions causing the nucleation in the two cases. In the WIMP case, the WIMP-induced recoil nuclei causing the bubble nucleation events are expected to have kinetic energies of order tens to hundreds of keV, whereas here we are concerned with nucleations caused by heavy ions with energies of order hundreds of MeV per nucleon.
2 Condition of bubble formation
The critical energy, W, for bubble nucleation at a particular temperature and pressure as given by Gibb’s reversible thermodynamics [33], can be expressed as
| (1) |
where is the surface tension at temperature T, Pv is the vapour pressure of the liquid at the temperature T and P0 is the ambient pressure. The term is the degree of superheat of the liquid at the temperature T. If the radius of the embryo is greater than a certain critical radius (), it grows till the whole liquid drop is vaporized. If on the other hand, the radius of the vapour embryo is smaller than the critical radius, it shrinks back to the liquid. The critical radius is given by ,
| (2) |
Usually, a very small fraction of the total deposited energy () is utilized in the nucleation process. The quantity is often called as the thermodynamic efficiency () for bubble nucleation process [34]. The value is typically in the range of 3% to 5% for the neutron induced nucleation [34]. The condition for bubble formation can be written as,
| (3) |
where, k is the nucleation parameter [18] and is equal to twice the thermodynamic efficiency () [12]. The study of the nucleation parameter (k) has been described in details in the literature [12, 18, 23, 35]. From the experiment, the estimated value of k with neutrons from Am-Be source was found to be for R-114 [35]. For the heavy ions the estimated value of k for the same liquid is [23].
3 Present work
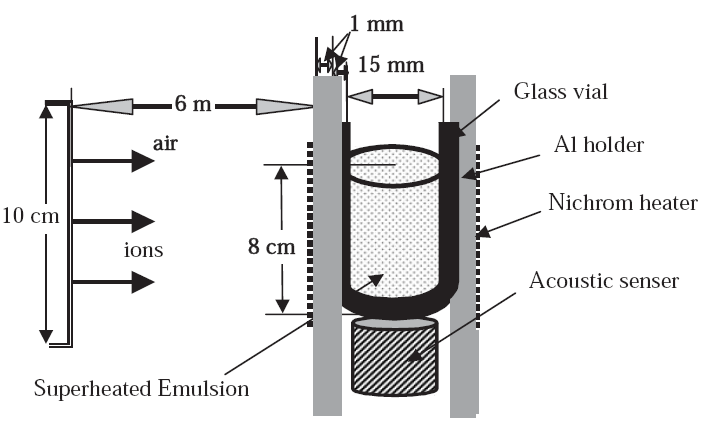
The details of the experiment for which the simulation is carried out is described in ref. [23]. A brief description of the experiment is given below for the sake of completeness. The experimental set up is shown in figure 1. The superheated emulsion was inside a glass vial of 1 mm thickness. The vial was placed inside an aluminium holder of thickness 1 mm. The beam entry port was 6 m away from the detector system. The dimensions of the detector used in the experiment were about mm in length and mm in diameter, containing drops of the liquid R- suspended in a firm polymer matrix. The drops had a distribution in diameter with a sharp peak at about 21 m. The main component of the polymer was glycerine. Before entering into the detector, the ions passed through m of air, mm of Al holder and mm of glass vial. In the experiment, the particle flux () was particles/sec/cm2. The simulation is carried out for 12C ( MeV/u), 20Ne ( MeV/u) and 28Si ( MeV/u).
3.1 Simulation I
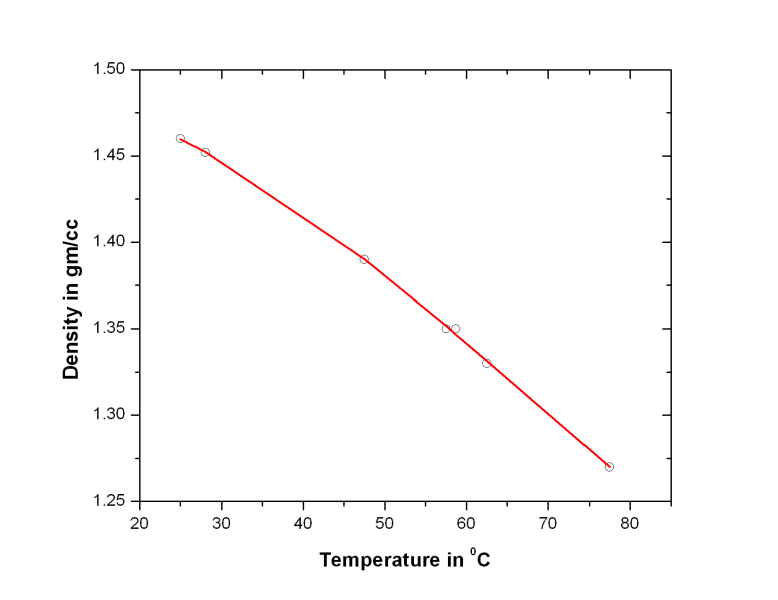
In this simulation, we simulate the experimental set up of the actual experiment. The positions of the drops and incident points of the ions are chosen randomly. There are two parts in the simulation: the geometry and the tracking of particles. In the geometry part, first the glycerine cylinder of density gm/cc, glass cylinder of density gm/cc and the liquid drops of R-114 are considered. The densities of R-114 liquid at different temperatures, are obtained from the following fitted functional form, shown in red line in figure 2, of the density as a function of temperature:
| (4) |
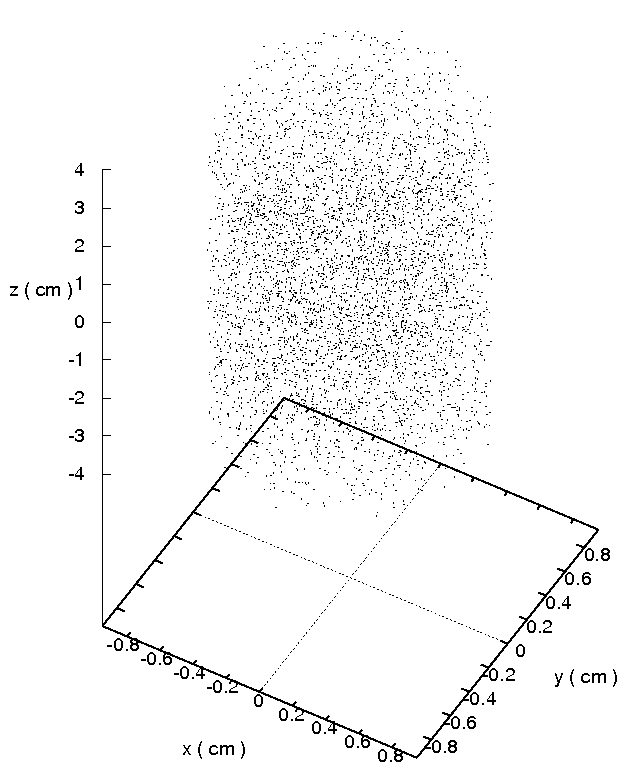
Here y is density in gm/cc and x is temperature in ∘C. The densities at some specific temperatures as shown in black circles in figure 2 are obtained from ref. [23]. A cylinder of Al with height 80 mm and diameter 19 mm is created. Within this Al cylinder, a 1 mm thick hollow glass cylinder of same height and outer diameter of 17 mm is placed. Then the cylinder of glycerine with height 80 mm and diameter 15 mm is created and placed inside the hollow glass cylinder. A total of 5000 () uniformly and randomly distributed non-overlapping drops of R-114 are then placed in the cylinder containing the glycerine (shown in figure 3). The diameter of each drop is taken as 20 m.
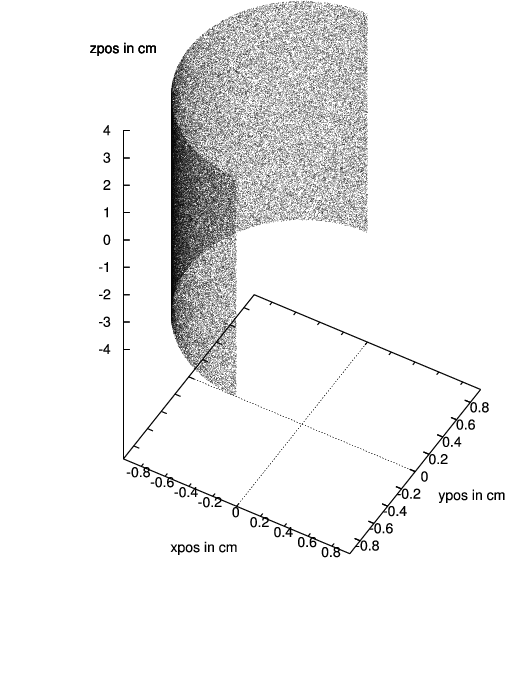
The second part of the simulation is tracking of particles through the geometry described above. The energy deposition by the ions during the passage through 6 m of air is obtained using SRIM 2008 code [24]. As the simulation is done for an experiment of 100 sec time duration, a total of million particles coming from negative x-direction is allowed to fall randomly on the outer surface of the Al cylinder perpendicular to the long axis of the detector. All particles have momenta only in the positive x-direction and the values of momenta at the entry point of the Al cylinder for 12C ( MeV/u), 20Ne ( MeV/u) and 28Si ( MeV/u) are found to be 7.071 GeV/c, 18.759 GeV/c and 24.022 GeV/c respectively. The distribution of the incident positions of the ions is shown in figure 4. The distribution of the drop centers and incident positions are generated outside the GEANT code, using the SRAND random number generator [36].
The Linear Energy Transfer, dE/dx, within a drop is obtained from the GEANT code. A true bubble nucleation event is assumed to occur if dE/dx is greater than the critical energy deposition () required for nucleation. Extra events due to more than one nucleation for same drop are rejected. The normalized count, in unit of , is calculated and plotted as a function of operating temperature.
3.2 Simulation II
This simulation is carried out to first find the probability of nucleation of a drop for the three ions, 12C ( MeV/u), 20Ne ( MeV/u) and 28Si ( MeV/u) and then, using this probability, the normalized count rate and the nucleation parameter for the above mentioned experiment are obtained. In this simulation only one single drop of liquid R-114 of diameter 20 m is created. To include the actual experimental situation of the randomness in the incident positions of the ions within a drop, a total of incident positions within the drop are generated using the SRAND random number generator [36]. On each incident position an ion with same energy is made to fall times. The energy losses of the ions during their passage through air are taken into account and calculated using SRIM 2008. As a result, the momenta of 12C ( MeV/u), 20Ne ( MeV/u) and 28Si ( MeV/u) at the incident points within the drop are 7.071 GeV/c, 18.759 GeV/c and 24.022 GeV/c respectively. The momentum is only in the positive x-direction.
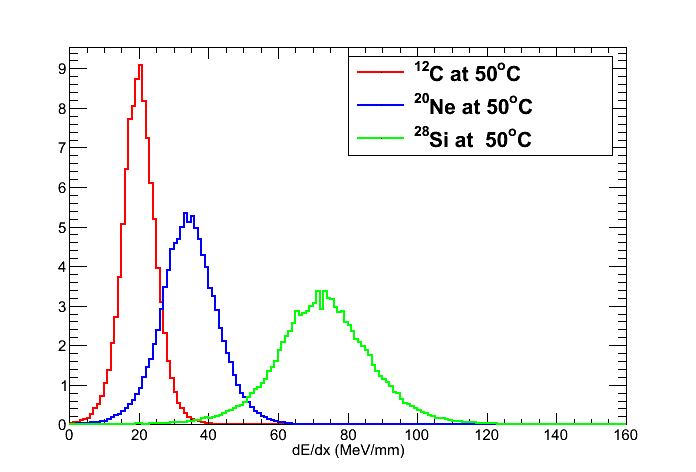
The energy deposition as well as LET of the ion along its track through the drop are obtained from the GEANT code. The distribution of LET for the ion has been obtained for each temperature. In figure 5 the distribution of LET within a 20 m diameter drop for 12C, 20Ne and 28Si with above mentioned momenta are shown for a temperature of C. The density of R-114 liquid at different temperatures are obtained from the fitted functional form using eq. (4). Using the distribution of LET, the probability of bubble nucleation of a drop has been calculated for each temperature for different values of nucleation parameter (k). We defined the probability of bubble nucleation of a drop (PB) for a particular nucleation parameter (k) as,
| (5) |
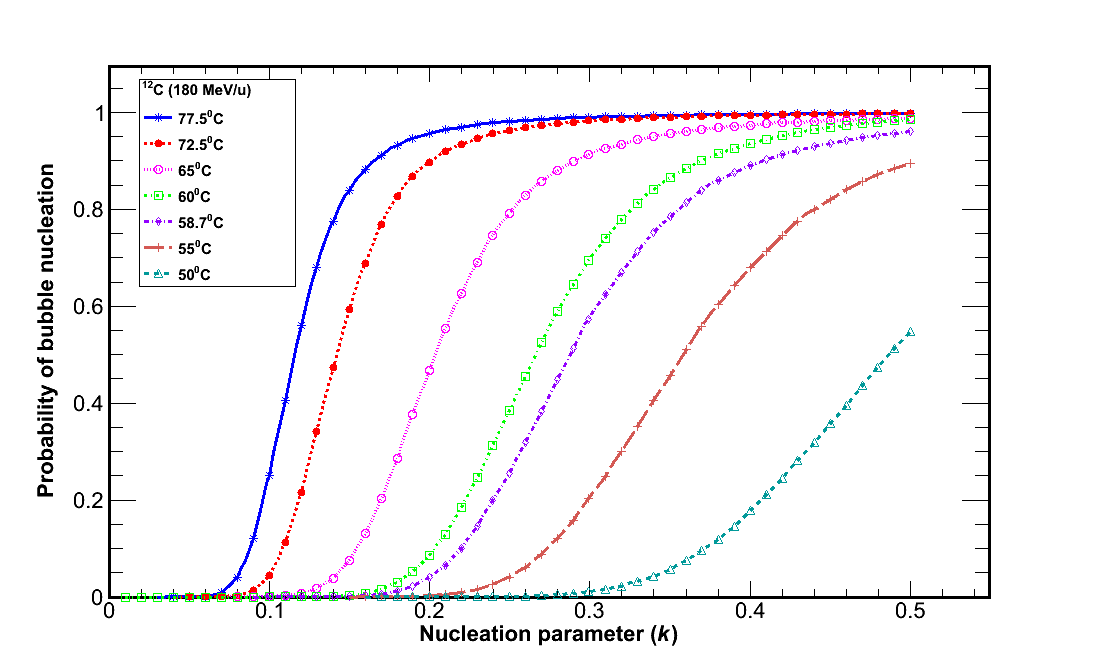
It is seen that, for any given temperature, the probability reaches a saturation value as the value of k is increased. For illustration, this probability PB as a function of the nucleation parameter k, for various temperatures, is shown in figure 6 for the heavy ion 12C (180 MeV/u) with incident momentum 7.071 GeV/c. To obtain the number of bubble nucleation events due to a particular ion with a particular nucleation parameter, the probability of bubble nucleation at that value of the nucleation parameter for that ion is multiplied by the total hit points obtained from Simulation I for the same ion. Finally the normalized count, in unit of , is calculated and plotted as a function of temperature.
4 Results and Discussions
4.1 Simulation I
From Simulation I, we have obtained the normalized count rates for different temperatures. Varying the value of k, the response has been fitted with the experimental result. To find the value of k, the normalized count rate () at the experimentally estimated threshold temperature and that obtained from the Simulation I (N1) are compared. Experimentally at low temperatures the response was almost flat at a value of cm2 corresponding to background. Above a certain threshold temperature, the number of counts rises sharply [23]. The experimental threshold temperature (T is considered at the midpoint between the temperature at the end of the above mentioned flat region of the curve and the temperature corresponding to the next higher count above the background count of cm2. The normalized count rate at the threshold temperature so defined is taken to be the mean of the two counts at the two corresponding temperatures. The same procedure is adopted here to find the normalized count rate (N1) at the threshold temperature.
| Experiment | Simulation I | Simulation II | ||||
| Ion (energy | Normalized | Value of | Normalized | Normalized | ||
| in Mev/u) | count at Tth | k | count at Tth | count at Tth | ||
| and | ( cm2) | cm2 | cm2 | |||
| Tth(∘C) | ( Nexpt ) | ( N1 ) | ( N2 ) | |||
| 12C (180) | 0.24 | 0 | 0.167 | |||
| 58.71.2 | 0.23 | 0.001 | ||||
| 0.22 | 0.081 | |||||
| 0.21 | 0.285 | |||||
| 0.19 | 0.706 | |||||
| 0.11 | 0 | 1.000 | ||||
| 20Ne (400) | 0.23 | 11.864 | ||||
| 62.52.5 | 0.12 | 0.119 | ||||
| 0.11 | 0.050 | |||||
| 0.10 | 0.423 | |||||
| 28Si (350 ) | 0.23 | 33.681 | ||||
| 57.52.5 | 0.08 | 2.197 | ||||
| 0.07 | 0.016 | |||||
| 0.06 | 0.714 | |||||
| 0.05 | 0.972 | |||||
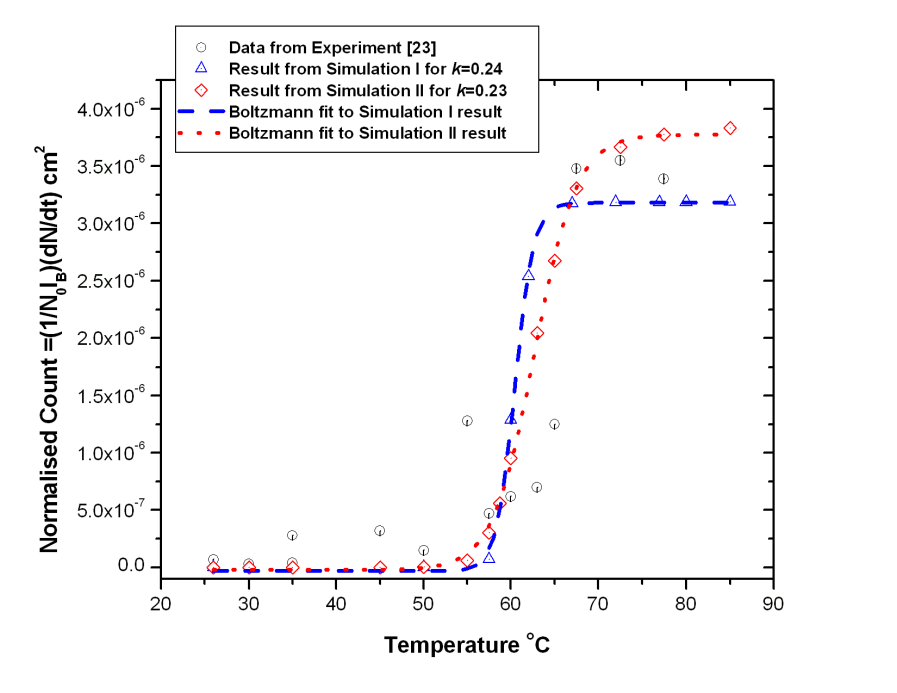
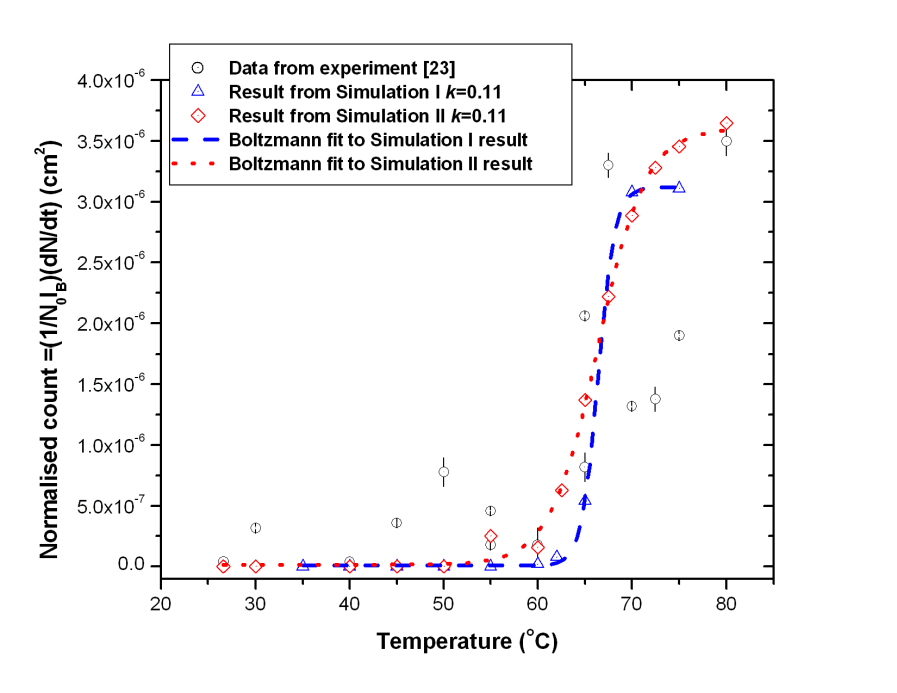
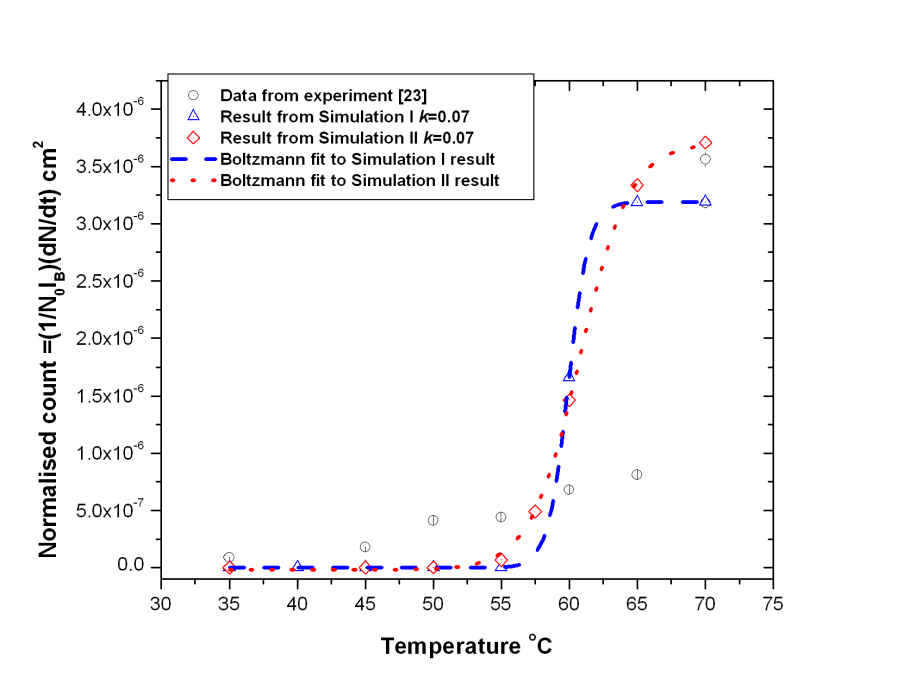
In table 1, the normalized count rates at the threshold temperature from the experiment and Simulation I with different values of k are tabulated. The value of k for which the deviation between experiment and Simulation I is least is taken as best values of k for a particular ion. The deviation for Simulation I is defined as . In case of 12C ( MeV/u), the deviation () is smallest for nucleation parameter k = 0.24. For the other two heavier ions, 20Ne ( MeV/u) and 28Si ( MeV/u), the deviation is smallest for the values of nucleation parameter 0.11 and 0.07 respectively. The normalized count rate as a function of temperatures for the best value of k obtained above for Simulation I (blue triangle in figures 7, 8, 9) are fitted to the Boltzmann function (blue dashed line in figures 7, 8, 9 ) given by
where y(T) is the normalized count at temperature (T) and is the base line value and is the plateau value of the count rate. The values of the thermodynamic efficiency, for 12C ( MeV/u), 20Ne ( MeV/u) and 28Si ( MeV/u) from Simulation I is 0.12, 0.055 and 0.035, respectively (table 2).
| Ion | Incident | Mass no. | k obtained from | obtained from k | ||
| energy | ||||||
| MeV/u | Simulation I | Simulation II | Simulation I | Simulation II | ||
| 12C | 12 | 0.24 | 0.23 | 0.12 | 0.115 | |
| 20Ne | 20 | 0.11 | 0.11 | 0.055 | 0.055 | |
| 28Si | 28 | 0.07 | 0.07 | 0.035 | 0.035 | |
4.2 Simulation II
A similar procedure as described above for Simulation I is followed to obtain the nucleation parameter (k) and thermodynamic efficiency () from Simulation II. The normalized count rates () for different values of nucleation parameter (k) at the threshold temperature obtained from the simulation are shown in table 1. The deviation is calculated using the eq. . It is seen that the smallest deviation is obtained for k values of 0.23, 0.11, 0.07 for 12C ( MeV/u), 20Ne ( MeV/u) and 28Si ( MeV/u) respectively (table 1). The response obtained from Simulation II for 12C ( MeV/u), 20Ne ( MeV/u) and 28Si ( MeV/u) ions are shown as red dotted line in figures 7, 8, 9, respectively. The thermodynamic efficiency () for the same set of ions are 0.115, 0.055 and 0.035, respectively (table 2).
4.3 General observations
From Simulation I and II, is found to be in the range of 3.5% to 12%. The values of k and in R-114 liquid for different heavy ions as obtained from Simulation I and II are shown in table 2. From table 2, comparing the value of k from the two simulations, it is seen that for 28Si ( MeV/u) and 20Ne ( MeV/u), the values of k are same and these are 0.07 and 0.11, respectively, while for 12C ( MeV/u) values of k are 0.24 and 0.23 from Simulation I and Simulation II, respectively. Our results show that the value of k varies with the mass number of the ions. It can be explained by comparing the mean value of LET distribution within a 20 m drop obtained from the GEANT code. The mean value of LET for 28Si ( MeV/u) and 20Ne ( MeV/u) are 73.14 MeV/mm and 34.50 MeV/mm respectively. These values are greater than that for 12C ( MeV/u) (20.11 MeV/mm); (see figure 5). By definition is the fraction of energy deposition required for bubble nucleation and as decreases with increase of LET, this implies that thermodynamic efficiency () is lowest for 28Si and highest for 12C.
| Ion | Incident energy | Mass no. | k | Deviation obtained |
|---|---|---|---|---|
| MeV/u | using eq. (6) | |||
| 12C | 12 | 0.19 | ||
| 20Ne | 20 | 0.11 | ||
| 28Si | 28 | 0.05 |
We have also done a separate calculation to obtain the value of nucleation parameter using the result from Simulation I. In this calculation all the experimental results for the whole temperature range used in the experiment and for all the three ions C, Ne and Si are considered. Varying the value of k and using the experimental data for all the three ions, a best fitted single simulation curve has been independently found for each of the three ions, 12C ( MeV/u), 20Ne ( MeV/u) and 28Si ( MeV/u). The deviation between the experimental and the simulated normalized count rate has been calculated for all experimental data using the following formula,
| (6) |
where, i represents the number of experimental data, N is the total number of experimental data available for the three ions, obtained from [23], N and N are the normalized count rate corresponds to a particular temperature from experiment and Simulation I respectively. The best fitted single simulation curve for each ion corresponds to a nucleation parameter k for which the deviation is smallest. For 12C ( MeV/u), 20Ne ( MeV/u) and 28Si ( MeV/u) the nucleation parameter ( k) is found to be equal to 0.19, 0.11 and 0.05, respectively (table 3), which also shows the dependence of k on the mass number of the ions.
We should mention that, as evident from the figures above, there are some deviations of the simulation results from the actual experimental data points. This is only to be expected. There can be several reasons for this. For example, in the simulations described above, we have not included the effects of possible fluctuation of the flux of the incident particles during the experiment. Also, we have considered all the drops to be of a fixed size, rather than a possible distribution of the radii of the drops in the actual experimental situation. Furthermore, possible spontaneous nucleations due to impurities in the real detector are not considered. All these effects may, to varying degrees, contribute to the deviations between the simulated results and experimental data points seen in the figures above. However, the important point to note is that the simulations do reproduce the broad nature of the experimental response curve. This, we believe, indicates that our simulations do indeed capture the essential physics of the nucleation process under consideration.
5 Conclusions
We have studied the response of superheated emulsion detector to incident heavy ions, 12C ( MeV/u), 20Ne ( MeV/u) and 28Si ( MeV/u) to understand the dependence of the bubble nucleation process on the masses of the incident nuclei. We have done this by simulating the energy losses (LET) by the nuclei during their passage through the active liquid drops that constitutes the detector. Our simulation also includes the geometry of the detector used in the actual experiment. We have determined the nucleation parameter, k, by comparing the simulation results with those from experiment. It is observed from the result that the value of the nucleation parameter, k for 12C ( MeV/u) is higher than that of the higher mass ions like 20Ne ( MeV/u) and 28Si ( MeV/u). For the three ions investigated here, k is observed to decrease with the increase in mass of the heavy ions. The present simulation provides an important observation that the nucleation parameter, (k) depends on the mass number of the ions.
Acknowledgements.
The authors would like to thank Sunanda Banerjee for valuable discussions and Lab Saha for his help in software installation. One of us (PB) wishes to thank Ramanath Cowsik for support under the Clark Way Harrison Visiting Professorship program at the McDonnell Center for the Space Sciences at Washington University in St. Louis.References
- [1] R. E. Apfel, Detector and dosimeter for neutrons and other radiation., US Patent (1979) 4143274.
- [2] H. Ing and H. C. Birnboim, A bubble-damage polymer detector for neutrons., \hrefhttp://dx.doi.org/10.1016/0735-245X(84)90106-6 Nuclear Tracks and Radiation Measurement 8 (1984) 285.
- [3] D. A. Glaser, Some effects of ionizing radiation on the formation of bubbles in liquids., \hrefhttp://link.aps.org/doi/10.1103/PhysRev.87.665 Phys. Rev. 87 (1952) 665.
- [4] R. E. Apfel and S. C. Roy, Investigations on the applicability of superheated drop detectors in neutron dosimetry., \hrefhttp://dx.doi.org/10.1016/0167-5087(84)90234-5 Nucl. Instrum. Methods 219 (1984) 582.
- [5] H. Ing, The status of the bubble-damage polymer detector., \hrefhttp://dx.doi.org/10.1016/1359-0189(86)90535-2 Nuclear Tracks and Radiation Measurements 12 (1986) 49.
- [6] R. E. Apfel and Y. C. Lo, Practical neutron dosimetry with superheated drops., Health Phys. 56 (1989) 79.
- [7] F. d’Errico, Radiation dosimetry and spectrometry with superheated emulsion., \hrefhttp://dx.doi.org/10.1016/S0168-583X(01)00730-3 Nucl. Instrum. Methods B 184 (2001) 229.
- [8] B. Roy, M. Das, S. C. Roy and B. K. Chatterjee, Threshold temperature for -ray detection in superheated drop detector., \hrefhttp://dx.doi.org/10.1016/S0969-806X(01)00316-4 Radiation Physics and Chemistry 61 (2001) 509.
- [9] M. Das, S. Seth, S. Saha, S. Bhattacharya and P. Bhattacharjee, Neutron-gamma discrimination by pulse analysis with superheated drop detector., \hrefhttp://dx.doi.org/10.1016/j.nima.2010.06.361Nucl. Instrum. Methods A 622 (2010) 196.
- [10] S. L. Guo et al., Proton tracks in bubble detector., \hrefhttp://dx.doi.org/10.1016/S0168-583X(02)01622-1 Nucl. Instrum. Methods B 198 (2002) 135.
- [11] F. d’Errico, W. G. Alberts, G. Curzio, S. Guldbakke, H. Kluge and M. Matzke, Active neutron spectrometry with superheated drop (Bubble) detectors, Radiation Protection Dosimetry 61 (1995) 159.
- [12] M. Das, B. K. Chatterjee, B. Roy B and S. C. Roy, Superheated drop as a neutron spectrometer., \hrefhttp://dx.doi.org/10.1016/S0168-9002(00)00423-X Nucl. Instrum. Methods A 452 (2000) 273.
- [13] T. Cousins, K. Tremblay and H. Ing, The application of the bubble detector to the measurement of intense neutron fluences and energy spectra. \hrefhttp://dx.doi.org/10.1109/23.101190 IEEE Trans. Nucl. Sci. 37 (1990) 1769.
- [14] H. Ing, R. A. Noulty and T. D. Mclean, Bubble detectors - a maturing technology., \hrefhttp://dx.doi.org/10.1016/S1350-4487(96)00156-4 Radiation Measurements 27 (1997) 1.
- [15] PICASSO collaboration, Response of superheated droplet detectors of the PICASSO dark matter search experiment. \hrefhttp://dx.doi.org/10.1016/j.nima.2005.09.015 Nucl. Instrum. Methods A 555 (2005) 184.
- [16] SIMPLE collaboration, A CF3I-based SDD prototype for spin-independent dark matter searches., \hrefhttp://dx.doi.org/10.1016/j.astropartphys.2008.08.002 Astroparticle Physics 30 (2008) 159.
- [17] COUPP collaboration, Improved limits on spin-dependent WIMP-proton interactions from a two liter CF3I bubble chamber., \hrefhttp://link.aps.org/doi/10.1103/PhysRevLett.106.021303 Phys. Rev. Lett. 106 (2011) 021303.
- [18] M. Das and T. Sawamura, Estimation of nucleation parameter for neutron-induced nucleation in superheated emulsion., \hrefhttp://dx.doi.org/10.1016/j.nima.2004.04.235 Nucl. Instrum. Methods A 531, (2004) 577.
- [19] L. W. Dietrich and T. J. Connolly, A study of fission-fragment-induced nucleation of bubbles in superheated water., Nucl. Sci. Eng. 50 (1973) 273.
- [20] C. R. Bell, N. P. Oberle, W. Rohsenow, N. Todreas and C. Tso, Radiation-induced boiling in superheated water and organic liquids., Nucl. Sci. Eng. 53 (1974) 458.
- [21] M. J. Harper and J. C. Rich, Radiation-induced nucleation in superheated liquid droplet neutron detectors., \hrefhttp://dx.doi.org/10.1016/0168-9002(93)91101-R Nucl. Instrum. Methods A 336 (1993) 220.
- [22] S. Tsuda, T. Sawamura, A. Homma and M. Narita, Pressure dependence of neutron detection sensitivity in a superheated drop detector., Radiation. Protection Dosimetry 87 (2) (2000) 87.
- [23] M. Das, N. Yasuda, A. Homma and T. Sawamura, Threshold temperatures of heavy ion-induced nucleation in superheated emulsions., \hrefhttp://dx.doi.org/10.1016/j.nima.2004.12.022 Nucl. Instrum. Methods A 543 (2005) 570.
- [24] J. F. Ziegler, M. D. Ziegler, and J. P. Biersack, SRIM2008.
- [25] S. L. Guo et al., High energy heavy ion tracks in bubble detectors., \hrefhttp://dx.doi.org/10.1016/S1350-4487(99)00078-5 Radiation Measurements 31 (1999) 167.
- [26] S. L. Guo et al., Characteristics of heavy ion tracks in bubble detectors., \hrefhttp://dx.doi.org/10.1016/S1350-4487(01)00165-2 Radiation Measurements 34 (2001) 269.
- [27] S. L. Guo et al., Status of bubble detectors for high-energy heavy ions., \hrefhttp://dx.doi.org/10.1016/S1350-4487(03)00120-3 Radiation Measurements 36 (2003) 183.
- [28] M. Das, N. Yasuda and T. Sawamura, Threshold ss of superheated emulsion detector to heavy ions., \hrefhttp://dx.doi.org/10.1016/j.radmeas.2008.03.069 Radiation Measurements 43 (2008) S62.
- [29] W. Lim and C. K. Wang, Computational studies of neutron response function for a neutron spectrometer which uses Freon-12, -22, and -115 superheated liquids., \hrefhttp://dx.doi.org/10.1016/0168-9002(93)90277-O Nucl. Instrum. Methods A 335 (1993) 243.
- [30] F. Seitz, On the theory of bubble chamber., The Physics of Fluids 1 (1958) 2.
- [31] S. Seth, Simulation of the -response of superheated droplet detector for PICASSO experiment., PICASSO Scientific and Technical Report (February 1, 2012) PSTR_12_001.
- [32] GEANT-Detector description and simulation tool, CERN Program Library long WRITE-up W5103, CERN.
- [33] J. W. Gibbs , On the equilibrium of heterogeneous substances., Transactions of the Connecticut Academy III (1975) 108.
- [34] R. E. Apfel, S. C. Roy and Y. C. Lo, Prediction of the minimum neutron energy to nucleate vapor bubbles in superheated liquids., \hrefhttp://link.aps.org/doi/10.1103/PhysRevA.31.3194 Phys. Rev. A 31 (1985) 3194.
- [35] M. Das, B. Roy, B. K. Chatterjee and S. C. Roy, Use of basic principle of nucleation in determining temperature-threshold neutron energy relationship in superheated emulsions., \hrefhttp://dx.doi.org/10.1016/S0969-806X(02)00502-9 Radiation Physics and Chemistry 66 (2003) 323.
- [36] SRAND random number generator, http://gcc.gnu.org/onlinedocs/gfortran/SRAND.html.