The 617 MHz - m Correlation (Cosmic Rays and Cold Dust) in NGC 3044 and NGC 4157
Abstract
We present the first maps of NGC 3044 and NGC 4157 at m and m from the JCMT as well as the first maps at 617 MHz from the GMRT. High latitude emission has been detected in both the radio continuum and sub-mm for NGC 3044 and in the radio continuum for NGC 4157, including several new features. For NGC 3044, in addition, we find 617 MHz emission extending to the north of the major axis, beginning at the far ends of the major axis. One of these low intensity features, more than 10 kpc from the major axis, has apparently associated emission at cm and may be a result of in-disk activity related to star formation.
The dust spectrum at long wavelengths required fitting with a two-temperature model for both galaxies, implying the presence of cold dust (T K for NGC 3044 and T K for NGC 4157). Dust masses are and for NGC 3044 and NGC 4157, respectively, and are dominated by the cold component.
There is a clear correlation between the 617 MHz and m emission in the two galaxies. In the case of NGC 3044 for which the m data are strongly dominated by cold dust, this implies a relation between the non-thermal synchrotron emission and cold dust. The 617 MHz component represents an integration of massive star formation over the past yr and the m emission represents heating from the diffuse interstellar radiation field (ISRF).
The 617 MHz – m correlation improves when a smoothing kernel is applied to the m data to account for differences between the CR electron diffusion scale and the mean free path of an ISRF photon to dust. The best-fit relation is for NGC 3044. If variations in the cold dust emissivity are dominated by variations in dust density, and the synchrotron emission depends on magnetic field strength (a function of gas density) as well as CR electron generation (a function of massive star formation rate and therefore density via the Schmidt law) then the expected correlation for NGC 3044 is , in agreement with the observed correlation.
keywords:
galaxies: individual: NGC 3044, NGC 4157; galaxies: ISM; infrared: galaxies; radio continuum: galaxies1 Introduction
1.1 Cosmic Rays and Dust in Disk-Halo Outflows
Observations of edge-on, star-forming galaxies indicate that many (possibly most) such systems display extra-planar emission (‘halos’). Where sufficient observations exist, these halos are known to be both multi-phase, displaying all of the components of the in-disk interstellar medium (ISM), as well as highly structured, revealing vertical features over a variety of spatial scales (e.g. Lee et al., 2001). Mass flux estimates thus far (Bregman & Pildis, 1994; Wang et al., 1995, 2001; Fraternali et al., 2002) imply that disk-halo outflow is responsible for transporting large quantities of gas and, as a result, has an important role to play in the evolution of galaxies, from metallicity gradients in disks to altered star formation rates (SFRs). Spatially resolved observations of nearby edge-on galaxies provide us with important data for studying the details of such disk-halo outflows.
Early observations of edge-on galaxies showed that radio continuum emission can extend several kpc above the plane (Hummel & van der Hulst, 1989; Hummel, Beck, & Dettmar, 1991), and this emission is dominated by non-thermal synchrotron radiation (e.g. Irwin, English & Sorathia, 1999; Irwin, Saikia & English, 2000), indicative of magnetic fields and cosmic rays (CRs). Galactic winds may also be present, since CRs can drive outflows, as first pointed out by Ipavich (1975); such outflows or ‘feedback’ are crucial to galaxy formation scenarios.
Dust in galaxy halos was first observed in the form of vertical filaments in absorption against starlight (Sofue, 1987) and, later in emission from high resolution space-based infra-red (IR) observations (e.g. Irwin & Madden, 2006). Extracting the physical conditions of dust, which is present over a range of sizes, compositions and excitation conditions, requires careful modelling of the spectral energy distribution (SED) and therefore observations at a variety of infrared wavelengths. Although such modelling is routinely carried out for galaxy disks, it has proved more difficult for the weaker halo emission [but see Whaley et al. (2009)]. With fewer data points, however, it is still possible to constrain some dust properties (e.g. Dunne et al., 2000; Dunne & Eales, 2001), especially in the ‘classical’ regime in which grains reach equilibrium temperatures.
In this paper, we present the results of observations at 617 MHz as well as at two sub-mm wavelengths, m and m, of two edge-on galaxies – NGC 3044 and NGC 4157 – in order to study both the in-disk emission and any halo emission which might be present. Since synchrotron emission is stronger at lower frequencies, halos should be more easily detected than at high radio frequencies for comparable signal-to-noise (S/N). A clear example can be found in Irwin & Saikia (2003). As for dust, the sub-mm wavelengths are known to be probes of cold dust and are less likely to be contaminated by contributions from hot or warm components and/or stochastically heated very small grains. Such data also provide the best estimate of total dust mass. Adopting these wavebands also allows us to probe the far infrared (FIR) - radio continuum relation (see next subsection) in these galaxies.
In the next two subsections, we discuss the FIR - radio continuum relation and introduce the two galaxies. In Sect. 2, we provide details of the observations and data reduction. Sect. 3 presents the results, including high latitude emission, where present, temperature fitting, mass estimates, and sub-mm-radio correlations. Sects. 4 and 5 present the discussion and conclusions, respectively.
1.2 The FIR-Radio Continuum Relation
The well-known relationship between thermal FIR emission from dust and the predominantly non-thermal synchrotron emission in galaxies (de Jong et al., 1985; Helou et al., 1985) is believed to result from the dependence of both on massive star formation (Wunderlich & Klein, 1988). The same stars that provide ultraviolet (UV) photons to heat the dust are also destined to become supernovae, thus producing non-thermal radio emission. What is still a puzzle, however, is how the relation can be so tight over many orders of magnitude among galaxies that have a range of properties, for example, differing ISM masses, dust masses, metallicities, SFRs and possible differences as to how optically thick or optically thin galaxies are to UV photons and CR electrons. Similar arguments apply to the correlation which has also been found within galaxies. As a result, other possibilities have been proposed for the origin of the relation, for example coupling between the magnetic field strength and the gas density; since it is well known that gas and dust density vary together, one would expect higher synchrotron emission wherever the dust emission is higher (Helou & Bicay, 1993; Hoernes et al., 1998; Groves et al., 2003).
One observational difficulty has been the traditional choice of the 1.4 GHz radio frequency (which includes a small but non-negligible thermal contribution) and FIR emission at and m (which includes contributions from both warm and cold dust). An early attempt at separating the various spectral contributions within M 31 (Hoernes et al., 1998) suggested that a good relation still exists between non-thermal radio emission and cold dust, the former driven by supernovae and the latter heated by the general interstellar radiation field (ISRF) rather than solely by hot young stars, i.e. the direct link with star-forming regions is less clear. Pierini et al. (2003) later found a slightly non-linear relation between the radio continuum and cold dust () and suggest that there may be a non-linear dependence of radio emission on SFR. See also Tabatabaei et al. (2010a) and Tabatabaei et al. (2010b) for further discussion.
A better approach is to observe the radio emission at a frequency that is strongly dominated by the non-thermal component, so that assumptions and corrections for the thermal contribution are not required. This is especially important when searching for correlations within a given galaxy since the thermal contribution can vary strongly from place to place. We have taken this approach by choosing the low radio frequency of 617 MHz. Similarly, by searching for correlations with m emission, the ISRF-heated cold dust component is more likely to be isolated. Such an approach has been taken by Brar, Irwin & Saikia (2003) who find a good correlation between these two wavebands within the galaxy, NGC 5775.
An important refinement is to consider whether a smoothed version of the sub-mm emission improves upon the relation, should one be found. For example, Bicay & Helou (1990) proposed that, since the mean free path of a UV photon to dust absorption is much less than the diffusion length of a typical CR electron, we would expect that the FIR-radio continuum relation (or, in our case, the 617 MHz - 850 m relation) will be improved if the FIR emission is smoothed spatially. Such an improvement has been observed by Murphy et al. (2006a, 2006b, 2008, 2009). We will examine this refinement for NGC 3044 and NGC 4157 as well.

1.3 The galaxies
Optical images of NGC 3044 and NGC 4157 are shown in Fig. 1 and their basic parameters are listed in Table 1. Aside from the fact that NGC 4157 resides in a richer environment (see below), the two galaxies have similar global properties: to within a factor of about 1.5, the galaxies are of similar size, SFR, total mass, and gas content. One difference is in the colour of the emission as seen in Fig. 1 and indicated by the (B-V)T colour of Table 1. NGC 3044 shows predominantly blue emission throughout its projected disk, whereas NGC 4157 shows blue emission in the outer regions. There is a small difference in inclination between the two galaxies which may contribute to this colour difference though it isn’t clear to what extent. For example, the slightly lower inclination of NGC 4157 appears to allow the redder inner regions of the galaxy to be more readily revealed. We describe these galaxies in detail, below.
1.3.1 NGC 3044
NGC 3044 (Fig. 1 left) is an isolated galaxy with no known companions. Although Tully (1988) place it within the Leo Cloud, the other 3 members are widely displaced in the sky ( or Mpc). Some minor warping can be seen in the optical image at large galactocentric radii, however, and asymmetries between the north-west and south-east major axis emission have been noted by Lee & Irwin (1997) and Collins et al. (2000). NGC 3044 has been considered both a ‘starburst’ and ‘normal’ galaxy; Tüllmann et al. (2006) discuss this issue, indicating that it may be considered a starburst galaxy, but one in which the starburst is extended over most of the disk, rather than concentrated near the nucleus.
The presence of a galactic halo in NGC 3044 is well known, having first been discovered in the radio continuum by Hummel & van der Hulst (1989) and further observed by various authors (e.g. Condon et al., 1990; Colbert et al., 1996; Irwin, English & Sorathia, 1999; Irwin, Saikia & English, 2000). Extra-planar diffuse ionized gas (eDIG) has been detected by Collins et al. (2000), Tüllmann & Dettmar (2000) and Miller & Veilleux (2003) and extends as far as 5 kpc from the plane (Tüllmann et al., 2006)111Adjusted to our distance and so throughout.. Halo structure, including a kpc-scale diameter H arc on the south side of the disk is also observed (Miller & Veilleux, 2003). Ionization of the eDIG can be explained by a combination of photo-ionization and shock ionization (Tüllmann & Dettmar, 2000). XMM-Newton observations by Tüllmann et al. (2006) have detected an extended soft X-ray halo which reaches its maximum height over the inner disk ( kpc). The X-ray emission correlates with both the eDIG and radio continuum. Halo HI emission is also observed, including HI extensions and several loops that have the signature of expanding supershells (Lee & Irwin, 1997). There appears to be some spatial correlation between the HI and radio continuum features in the inner disk, but the HI is more extended radially and shows vertical extensions that do not have counterparts at other wavebands. Infrared spectroscopy of the halo has also been recently obtained by Rand et al. (2011).
A supernova was observed in NGC 3044 in the year, 1983222Data from the International Astronomical Union Central Bureau for Astronomical Telegrams at http://www.cfa.harvard.edu/iau/lists/Supernovae.html..
1.3.2 NGC 4157
NGC 4157 (Fig. 1 right) is a member of the Ursa Major Cloud (Tully, 1988) and belongs to the galaxy group, LGG-258 (Garcia, 1993). Previous radio continuum observations have been made by Condon (1987), Gioia & Fabbiano (1987), Hummel & van der Hulst (1989), Irwin, English & Sorathia (1999) and Irwin, Saikia & English (2000). HI data can be found in Rhee & van Albada (1996), in Verheijen & Sancisi (2001), in the Westerbork HI survey of Spiral and Irregular Galaxies (WHISP) catalog333see http://www.astro.rug.nl/~whisp/ (see e.g. Noordermeer et al., 2005), and in Kennedy (2009). A companion galaxy, UGC 7176, with a dynamical mass 1% of that of NGC 4157, is located 12 arcmin to the south (Kennedy, 2009). CO parameters can be found in Young et al. (1995) and Komugi et al. (2008). The galaxy was observed with the Infrared Space Observatory (ISO) at m (Bendo et al., 2002) and a UV image from the Galaxy Evolution Explorer (GALEX) satellite can be found in Gil de Paz et al. (2007).
A radio continuum halo was discovered in NGC 4157 by Irwin et al. (1999) but, to our knowledge, the only previous search for extraplanar features in this galaxy was made by Howk & Savage (1999) who searched for extraplanar dust absorption, with ambiguous results.
Three historical supernovae have been detected in NGC 4157 in the years, 1937, 1955 and 2003 (see Footnote 2).
| Parameter444Values from the NASA/IPAC Extragalactic Database (NED) unless otherwise indicated. | NGC 3044 | NGC 4157 |
| Morphological Type | SB(s)c? sp (HII) | SAB(s)b? sp (HII) |
| RA (J2000) (h m s) | 9 53 40.9 | 12 11 04.4 |
| DEC (J2000) (∘ ′ ′′) | 1 34 47 | 50 29 05 |
| Distance, (Mpc)555The quoted values agree, within errors, with NED Hubble Flow distances with respect to the Cosmic Microwave Background for = 73 km s-1 Mpc-1. | 21.7666Lee & Irwin (1997). | 12.9777Irwin, English & Sorathia (1999). |
| Optical major minor axis (′ ′) | 5.71 0.63 | 7.95 1.06 |
| (′, kpc)888Optical diameter at the 25th magnitude isophote, from de Vaucouleurs et al. (1991). | 4.90, 30.9 | 6.76, 25.4 |
| Inclination (∘) | 85c | 83999Tully et al. (1996). |
| Position angle (∘) | 113c | 66d |
| Blue Magnitude | 12.46 | 12.15 |
| (B-V)T101010Total B-V colour from de Vaucouleurs et al. (1991). | ||
| , , , (Jy)111111IRAS flux densities at m, m, m and m, respectively, from Sanders et al. (2003). | 0.60, 1.11 9.64, 19.38 | 1.72, 2.12, 17.71, 50.67 |
| , , , (mJy)121212Errors on IRAS flux densities of previous row. | 22, 86 30, 89 | 39, 28, 43, 170 |
| 0.497 | 0.350 | |
| , ( erg s-1 cm-2)131313FIR (m) and IR (m) flux density, respectively, according to the prescription of Sanders & Mirabel (1996), with their constant, . | 0.558, 1.05 | 1.21, 2.35 |
| , ( )141414FIR and IR luminosity, respectively, from , with erg s-1. | 0.820, 1.55 | 0.631, 1.22 |
| , ( erg s-1 kpc-2) | 3.29, 6.21 | 3.76, 7.26 |
| SFR (M⊙ yr-1)151515Star formation rate, from , according to the prescription of Kennicutt (1998). | 2.7 | 2.1 |
| ()161616HI mass (Lee & Irwin 1997 for NGC 3044; Kennedy 2009 for NGC 4157). | 5.4 0.4 | 4.2 0.1 |
| ()171717 mass using a conversion factor of mol cm-2 (K km s-1)-1 (Solomon & Sage 1988 for NGC 3044; Young et al. 1996 for NGC 4157). | 2.1 50% | 1.8 30% |
| ()181818Total dynamical mass from HI data (Lee & Irwin 1997 for NGC 3044; Kennedy 2009 for NGC 4157). | 1.5 0.2 | 2.0 0.5 |
| NGC 3044 | NGC 4157 | |
| Date of Observation | 26 July 2002 | 27 July 2002 |
| On-source Observing Time (min.) | 404 | 280 |
| Primary Flux Density Calibrator | 3C 286 | 3C 286 |
| Phase Calibrator | J0943-083 | J1146+399 |
| No. of Spectral Channels | 128 | 128 |
| Channel Width (kHz) | 125 | 125 |
| Central Frequency (MHz)191919After editing | 617.375 | 619.937 |
| Total Bandwidth (MHz)a | 9.875 | 9.375 |
| Primary Beam FWHM (arcmin) | 47.4 | 47.2 |
2 Observations & Data Reduction
2.1 Radio Continuum Data
Observations of NGC 3044 and NGC 4157 were obtained with the Giant Metrewave Radio Telescope (GMRT), located near Pune, India, which consists of 30 antennas, each 45 m in diameter, in a fixed, ‘Y’-shaped array with a longest baseline of about 25 km and the shortest, 100 m. Fourteen of the antennas are clustered randomly in a central 1 1 km central ‘square’ with the remainder in the arms. At the time of the observations, not all antennas were available, leaving typically, 25 to 29 antennas for each observation. For a more complete description of the telescope, see Swarup (1991), Swarup et al. (1991), Ananthakrishnan (2005) or http://www.gmrt.ncra.tifr.res.in. A summary of the observational data is given in Table 2. Note that the shortest spacing ensures that, at 617 MHz, spatial scales up to about 17 arcmin are detected, i.e. about 3 times and 2 times the optical major axis diameters of NGC 3044 and NGC 4157, respectively.
Observations were carried out in the standard fashion, with a flux density calibrator observed during the observing run and phase calibrators observed at regular intervals, typically every 30 minutes. The spectral line mode, which is the default at the GMRT, was used to identify interference, if present. The data were processed using the Astronomical Image Processing System (AIPS) of the National Radio Astronomy Observatory (NRAO). Editing was initially carried out using the AIPS-compatible routine, GMRED202020This AIPS-compatible routine was written by us and is available at http://www.astro.queensu.ca/irwin. which we wrote in order to remove bad data, since the GMRT did not have on-line flagging during the observations. Further editing was then carried out in AIPS using standard routines. After editing, the central frequencies were slightly different for the two galaxies (Table 2), but we will refer to both data sets as the 617 MHz data.
Standard continuum calibration was carried out except for the additional step of bandpass calibration using the phase calibrators. The uv data were then Fourier-transformed, the dirty beam deconvolved and the clean beam reconvolved using the AIPS routine, IMAGR. This required forming a number of fields so that significant sources far from the field center could be properly imaged and cleaned. Maps were originally formed for every channel so that each one could be checked for consistency. This led to some further editing and re-calibration. The uv data in the remaining channels were then averaged to form a single-channel data set. From these data, maps were formed using a range of uv weightings resulting in a range of spatial resolutions and signal-to-noise (S/N) ratios, from which we present the 9 arcsec and 15 arcsec resolution images in Figs. 2a and b and Figs. 4a and b. The undisplayed images do not reveal any features that are not seen on these two.
The final step was to correct for the primary beam of the GMRT. This correction, however, introduces position-dependent noise over the image and, since the total flux correction was measured to be less than 0.4% for both galaxies after the primary beam correction (much less than other errors), we adopt the uncorrected maps for presentation and further analysis.
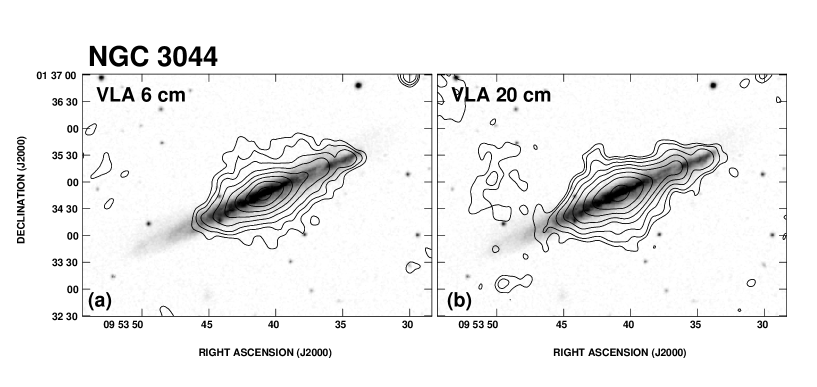
We carried out observations of NGC 3044 and NGC 4157 at 327 MHz also. However, the resulting data sets were not of sufficient quality to use. Since we have previously obtained Very Large Array (VLA) data of NGC 3044 and NGC 4157 at cm, these data are also presented here (Figs. 3 and 5, respectively) to supplement our GMRT data. For details on these data sets, see Irwin, English & Sorathia (1999).
2.2 Sub-mm Images
Sub-mm observations of NGC 3044 and NGC 4157 were obtained with the Submillimetre Common-User Bolometer Array (SCUBA, see Holland et al. (1999)) on the James Clerk Maxwell Telescope (JCMT212121The JCMT is supported by the Science and Technology Facilities Council of the UK, the NRC of Canada, and the Netherlands Organization for Scientific Research.). The m and m arrays, which were used concurrently, consist of 91 and 37 circular pixels, respectively. The configuration of the pixels gives an instantaneous field of view of 2.3′. Observations were carried out in 64-point jiggle-map mode which ensures Nyquist sampling at both frequencies. Hourly pointing checks were made during the observations and measurements to determine the atmospheric transparency were also carried out. Two fields of view were required to cover each galaxy. The final field of view and other observing data are given in Table 3. We will refer to these data as the m and m data.
The data were reduced using the SCUBA User Reduction Facility (SURF) package (Jenness & Lightfoot, 1999). The steps included regridding to true sky positions, atmospheric subtraction, flatfielding, and correction for sky opacity. For the latter, the optical depth from the Caltech Sub-mm Observatory, , was used, extrapolated to the observing wavelengths, and interpolated in time. Since there are not many pixels with no galaxy emission, sky values were calculated by first removing source emission from the data prior to sky subtraction222222The SURF routine, CALCSKY, was used.. The data were also examined carefully and edited for noisy bolometers and data spikes. Corrections for positional drift were applied and the data were calibrated using values of the known flux density calibrators for the times of observation. At this point, the data consisted of a sequence of calibrated images in time. Each image was then re-checked for bad data and additional flagging was carried out if the pixel value deviated by more than from the mean pixel value from all images. The final image was then made from an average of all images, weighted by integration time and background noise. The final step involved blanking the periphery of the final field of view (which contains two 2.3′ fields) where the noise was higher than the average over the general field.
Since these data were obtained, di Francesco et al. (2008) have independently reduced the same data set with good agreement in the results. We will compare our results to theirs, where relevant, in subsequent sections.
Finally, we consider the possibility of contamination of the m band by CO(J=3-2) emission. For NGC 3044, this can be tested explicitly since we have CO(J=3-2) data from Lee (1998) who find a maximum brightness temperature of 0.091 K with an effective line width of 89 km s-1 (width of = 7.5 m) within a 14.9 arcsec beam at a location near the radio continuum peak. Our peak continuum flux density of 69.4 mJy beam-1 in a 15 arcsec beam (Fig. 2d) corresponds to 2.1 K within the SCUBA 850 m bandwidth of 70 m (Holland et al., 1999). Therefore, the estimated contamination is less than 1%. It is well known that contamination of the SCUBA 450 m band by CO(J=6-5) is even lower (e.g. Seaquist et al., 2004).
| NGC 3044 | NGC 4157 | |
| Dates of Observation | 5, 6 Jan. 2001 | 12, 13 Jan. 2003 |
| 15 Nov. 2001 | 11 Oct. 2003 | |
| On-source Observing Time (min.) | 450 | 480 |
| Flux Density Calibrators | Mars, CRL 618 | Uranus, Mars |
| Central Wavelength (m) | 443, 863 | 443, 863 |
| Resolution (′′)232323At m and m, respectively. | 8.0, 14.9 | 8.0, 14.4 |
| Field of view (arcminute2)242424After editing. | 6.13, 8.0 | 6.48, 8.42 |
3 Results
The final maps are shown in Fig. 2 for NGC 3044. and Fig. 4 for NGC 4157. Beam sizes and noise value information can be found in the figure captions. We discuss the results for the two galaxies, separately.
3.1 The NGC 3044 Maps
3.1.1 Radio Continuum Images
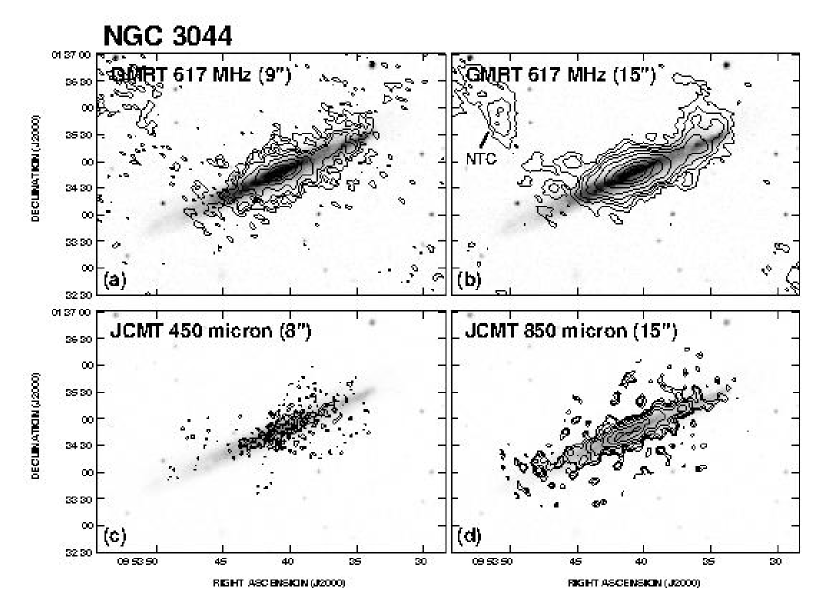
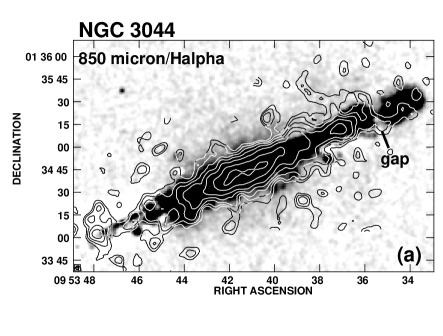
Figs. 2a and b show 617 MHz data for NGC 3044, illustrating both the in-disk as well as high latitude radio continuum emission of this galaxy, and the flux density is given in Table 4. The data have been shown with two different uv weightings to illustrate the fine structure emission (Fig. 2a) as well as larger scale structure at higher sensitivity (Fig. 2b). At 617 MHz, the emission is strongly dominated, unambiguously, by non-thermal synchrotron radiation. For comparison, we show the cm and cm VLA maps from Irwin, English & Sorathia (1999) in Fig. 3 over the same field of view as Fig. 2. As shown by Irwin, English & Sorathia (1999), the cm and cm maps are also dominated by non-thermal emission. In addition, we compute the global spectral index between the 617 MHz and cm emission to be ; this spectral index strongly departs from what would be expected for thermal emission ().
The 617 MHz radio continuum emission in the disk of NGC 3044 is highly asymmetric, being extended on the north-west side but has a more ‘truncated’ appearance on the south-east side. Asymmetries, in just this sense, can be seen in the X-ray image (Tüllmann et al., 2006) and in H (e.g. Collins et al., 2000) as well as the 6 cm and 20 cm maps. As has been pointed out earlier (Sect. 1), the X-ray, radio continuum, and H all appear correlated. The asymmetry observed in HI, however, does not correlate in the same sense. The HI distribution is extended more on the south-east disk than in the north-west (Lee & Irwin, 1997).
The extraplanar radio continuum emission is highly structured, as has been seen before in radio halos of other edge-on galaxies (e.g. Lee et al., 2001) though the halo is not as pronounced as in the VLA maps likely because the VLA observations have somewhat higher dynamic range (255/1 and 362/1 for 6 cm and 20 cm, respectively) than the 617 MHz observations (228/1). The uv distribution will also differ. The broadest halo can be seen on either side of the nuclear region, consistent with what is seen in H and soft X-rays.
A new and interesting result is the appearance of the two far ends of the major axis, both of which show emission extending out of the plane towards the north and both of which show a ‘double-pronged’ appearance. That is, there is evidence for the ejection of cosmic rays away from the plane at both ends of the major axis; presumably, the ejection of particles is facilitated by the lower density ISM at these locations.
On the far south-east end of the major axis, moreover, where the radio continuum major axis emission is truncated, some disconnected emission features can be seen towards the north, including a large feature centered at RA 9h 53m 51s, DEC 01∘ 35′ 45′′ which we have labelled a ‘non-thermal cloud’ (NTC). The feature occurs at a low S/N, but the independent VLA 20 cm map and (to a lesser extent) in the VLA 6 cm map (Fig. 3) also show features in this direction. These features will be discussed further in Sect. 4.1.1.
3.1.2 Sub-mm Images
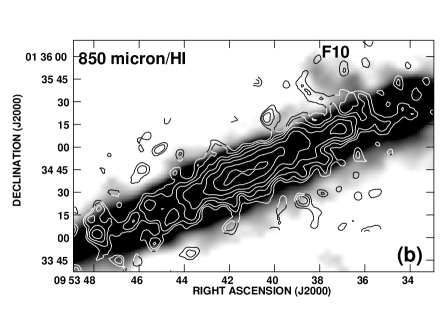
The sub-mm emission of NGC 3044 is shown in Fig. 2c and d. The field of view, delineated by the region over which contour emission is displayed, is much smaller than the radio continuum emission (see Table 3 for the field size). These maps show mainly the strong, in-disk emission, since the sensitivity is insufficient to delineate a global dust halo, if it exists. The 850 m map, however, does hint at a few discrete features; these will be discussed in Sect. 4.1.1.
The total 450 m and 850 m flux densities are given in Table 4. If emission at the level of the rms noise were to exist out to the ends of the optical major axis in the 450 m map (as is the case for the 850 m map), then the 450 m flux density would not change by more than the error bar that has been quoted. Therefore, the flux densities at the two frequencies can both be used to constrain dust properties, within the constraints of their uncertainties, as will be discussed in Sect. 3.3.
| Property | NGC 3044 | NGC 4157 |
| (Jy)252525Flux density at 617 MHz. Uncertaintites include variations in editing, and choice of imaging and self-calibration parameters over different reduction trials. | 0.20 0.04 | 0.43 0.05 |
| (Jy)262626Flux density at 450 or 850 m. Uncertaintites include variations over different box sizes as well as variations between our data reduction and that of di Francesco et al. (2008). | 3 1 | 10 2 |
| (Jy)b | 0.75 0.10 | 0.8 0.1 |
| Tc (K)272727Temperature of cold (subscript, c, and so throughout) or warm (subscript, w, and so throughout) dust component (see text). | 9.5 1.5 | 15.3 3 |
| Twc (K) | 31.0 1.4 | 25.6 0.9 |
| Nc/Nw282828Eqn. 2. The estimated error is 25%. This quantity is equivalent to . | 76 | 4 |
| ( )292929Eqn. 3. | 1.6 0.6 | 0.21 0.06 |
| 303030From of Table 1 and from this table. The uncertainty could be as high as 90% for NGC 3044 and 60% for NGC 4157. | 47 | 286 |
3.2 The NGC 4157 Maps
3.2.1 Radio Continuum Images
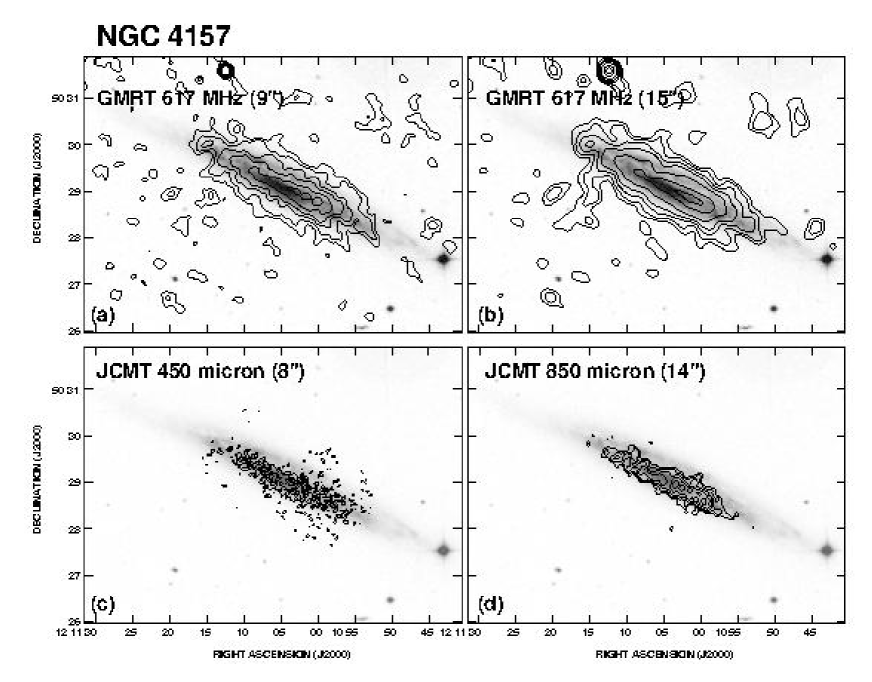
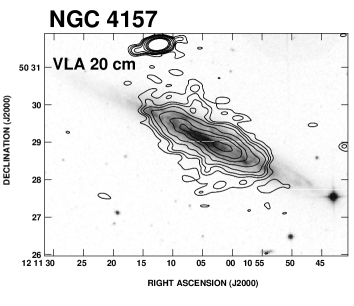
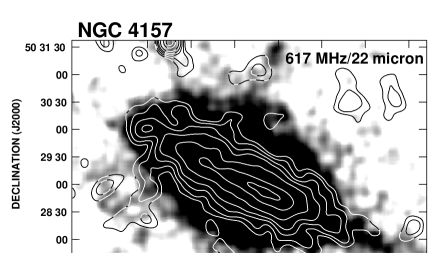
The 617 MHz emission of NGC 4157 is shown in Fig. 4a and b and the flux density is given in Table 4. For comparison, the VLA cm image is shown in Fig. 5 (a 6 cm image does not yet exist). The strongest radio emission belongs to a background point source that can be seen to the north of the galaxy on the far east side. The 617 MHz data agree very well with the VLA data throughout the disk. Fig. 4a and b appear to show a slight offset between the optical and radio major axes. However, this is because of a north-west/south-east assymetry on either side of the major axis of the DSS2 blue image that has been displayed in the figure; the south-east side is the farther side and therefore the displayed optical blue emission is truncated by extinction on this side. The colour image of Fig. 1, for example, shows good north-west to south-east symmetry and the optical and radio major axes align well when comparing with the colour image.
The radio emission of the halo is also similar between the VLA and 617 MHz emission, although the discrete extensions seen at cm are less obvious at 617 MHz, possibly because of the lower dynamic range at 617 MHz (42/1 over the emission associated with NGC 4157 in Fig. 4b, compared to 93/1 for Fig. 5). The most obvious extension in Fig. 4b begins in the far north-eastern disk and extends approximately 1.5 arcmin (5.6 kpc) towards the south. It is visible at 617 MHz but not at cm. If this feature is real, its spectral index must be less than () to render it undetectable on the cm image. No other independent detection of this feature has been made, but we note that it falls along the eastern side of an HI extension detected by Kennedy (2009); also spectral indices as low as have previously been detected in vertical features related to outflow in other galaxies (Heesen et al., 2011; Irwin et al., 2012). See Sect. 4.1.2 for further discussion.
3.2.2 Sub-mm Images
The m and m maps are shown in Figs. 4c and d, respectively, and flux densities are given in Table 4. Only in-disk emission can be seen in these full-resolution images. Again, there is the appearance of an offset in the major axis between the sub-mm emission and the optical emission. However, brightest optical emission aligns well with the brightest sub-mm emission, as shown in Figs. 4c and d to within the estimated pointing accuracy of 3 arcsec313131We have also verified that the astrometry of the m and m maps agrees with the results of di Francesco et al. (2008) who have independently reduced the SCUBA data., and, when the sub-mm emission maps are overlaid on the SDSS R-band image (not shown), the emission again centers squarely on the brightest optical emission. As we saw with the radio continuum emission, dust obscuration creates an apparent asymmetry in the optical images that have been displayed in the overlays.
The m and m emission in NGC 4157 extends approximately equally as far in radius; however, in both cases, neither is seen as far out as the optical disk. This is likely a sensitivity issue since the sub-mm dynamic range of the NGC 4157 data is lower than that of NGC 3044. This must be kept in mind when the two galaxies are compared.
3.3 Dust Temperature, Mass and Gas/Dust Ratio
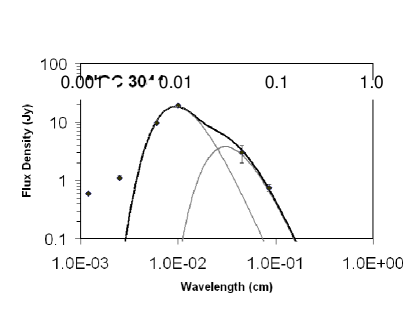
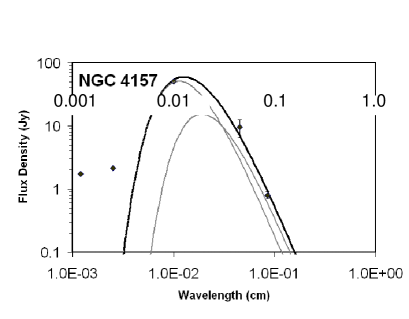
The IR/sub-mm spectra of NGC 3044 and NGC 4157, which include the IRAS flux densities (Table 1) as well as the sub-mm data (Table 4), are plotted in Fig. 6.
To determine the dust temperature, we consider only those ‘classical’ grains that are of sufficient size to reach an equilibrium temperature, rather than very small grains (VSGs) which are stochastically heated. Since the 12 and 25 m flux densities are considered to be contaminated by VSGs (e.g. Dupac et al., 2003; Désert, Boulanger & Puget, 1990) we exclude these points from our fits. For the remaining points, we assume that the dust is optically thin (see, e.g. Marengo et al., 1997; Eales & Edmunds, 1996; Stevens & Gear, 2000) and that the data can be described by a modified black body curve of the form
| (1) |
where is the flux density at frequency, , is the Planck function for dust at temperature, Td, is the solid angle subtended by all dust (proportional to the number of dust grains, , in the optically thin limit), is the frequency above which the dust becomes optically thick, and is the emissivity index which we take to lie in the range, 1.5 to 2, as found from other studies of our own and other galaxies (e.g. Masi et al., 1995; Alton et al., 1998; Stevens & Gear, 2000) The quantity, describes the optical depth. However, we could not fit the data, within errors bars, with a single-temperature model.
Although it is most realistic for the dust to have a spectrum of temperatures, we do not have sufficient data to test for such a spectrum. Instead, following Dunne & Eales (2001), James et al. (2002), Alton et al. (2000) and others, we fit a two-temperature (warm, denoted w, and cold, denoted c) model to the data. For identical dust grains that differ only by temperature, the spectrum is fit according to,
| (2) |
where and represent the number of warm and cold dust grains, respectively, and represent the flux density contributions of warm and cold dust grains, respectively, and is a constant that folds in the solid angle subtended by a dust grain and the frequency at which the dust becomes optically thick.
Since we have 4 useable data points per galaxy, we can solve only for the 4 parameters: , , , and . From these, we list the physically meaningful parameters, , , and in Table 4 and show the fits in Fig. 6. The uncertainties on the temperatures are associated with the adopted range of , i.e. , which dominates over other uncertainties.
The temperatures given in Table 4 appear to be typical of what has been found by other authors who have applied two-temperature fits. For example, the ranges found by Dunne & Eales (2001) and James et al. (2002) for a large sample of galaxies were and . More recent data obtained from the Planck mission (Ade et al., 2011) find that, using two-temperature fits, a cold component (T K) is required in galaxies. Our results for both NGC 3044 and NGC 4157 are consistent with this. We also find that there is a greater range of dust temperature within NGC 3044 in comparison to NGC 4157. This appears to be consistent with the slightly higher SFR and warmer colour (Table 1) in NGC 3044, leading to higher values of , along with the fact that dust emission has been detected to much higher galactocentric radii (compared to the optical disk) in NGC 3044 as opposed to NGC 4157 (cf. Figs. 2d, 4d) where lower might be measured.
With the above assumptions, the fraction of cold to warm dust in the galaxy, (equivalent to the mass fraction, ), has also been computed and is listed in Table 4. Previous values for a large sample of galaxies (Dunne & Eales, 2001; James et al., 2002) fall in the rather large range, ; with few exceptions, the implication is that there is much more cold than warm dust in galaxies and our results are again consistent with this conclusion.
For a two-temperature model, the dust mass can be found from
| (3) |
where we take Hz (850 m), is the flux density at this frequency, is the distance to the galaxy, and is the dust mass opacity coefficient at 850 m. The value of is uncertain since . We adopt a value of cm2 g-1 for consistency with other authors (Zhu et al., 2007; Vlahakis et al., 2005; Dunne & Eales, 2001; Dunne et al., 2000) and in agreement with James et al. (2002). The results are listed in Table 4. These masses fall within the range found for previous galaxy samples observed at m by James et al. (2002), Dunne et al. (2000) and also when m data are included in SED fits (Willmer et al., 2009).
There is considerably more dust in NGC 3044 than NGC 4157. Some of this difference may be attributed to sensitivity differences between the two galaxies which did not enable detection of emission in NGC 4157 as far out in radius than NGC 3044 (Sect. 3.2.2). However, undetected flux at large galactocentric radii is unlikely to increase of NGC 4157 by the factor of 8 which would bring it into agreement with the dust mass in NGC 3044, even if Nc/Nw were increased to account for a possibly increasing fraction of colder dust at the larger radii. There appears to be a real difference in dust mass between the two galaxies.
The global gas/dust ratio for the two galaxies is given in Table 4 where the gas mass is the sum of and in Table 1 and the dust mass is given in Table 4. The H2 mass has been taken from early CO observations for which the error bars are significant; nevertheless, the difference between the two galaxies is again apparent, mainly because of the larger dust content in NGC 3044, rather than significant differences between gas masses. (We have, in addition, resolved CO(J=2-1) data for NGC 3044 from Lee (1998) which we make use of in the next section.)
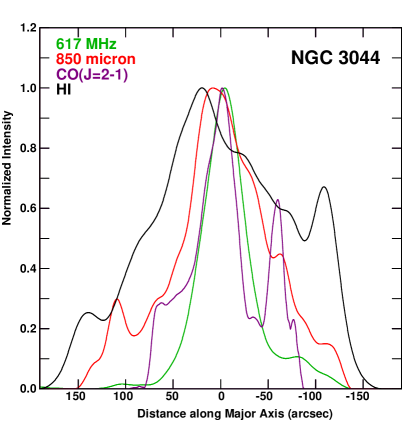
3.4 Major Axis Distributions of NGC 3044
For NGC 3044, we have spatially resolved data in a number of wavebands for which we can compare the normalized major axis distributions at a common spatial resolution (21 arcsec or 2.2 kpc). Fig. 7 shows the m slice in red and the 617 MHz slice in green. We show the m data, rather than the m data, since the S/N is higher for this data set and also the data unambiguously represent the cold dust distribution (Fig. 6). A correlation between the cold dust and synchrotron emission is apparent, but there are significant differences as well: the synchrotron-emitting component is narrower in this normalized plot and also has a smoother distribution. We will return to this issue in Sect. 3.5.
In addition, we have obtained both HI and CO data for this galaxy from Lee & Irwin (1997) and Lee (1998), respectively. The CO(J=2-1) data were obtained from the JCMT at 21 arcsec resolution and the data reduction of this component follows the description in Lee et al. (2001); we take the CO(J=2-1) emission to represent the molecular gas distribution323232Available CO(J=1-0) data are not of sufficient spatial resolution (see Solomon & Sage, 1988) for comparison.. These distributions are also plotted in Fig. 7. The HI distribution is very broad in comparison to the molecular gas, the latter being strongly centrally peaked with the exception of a discrete peak at a projected radius of -60 arcsec (i.e. to the northwest). The closest correlation is between the synchrotron emission and the molecular gas distribution within the central 50 arcsec, indicating the well-known close association between molecular gas, star formation, and the subsequent synchrotron radiation that is produced by supernovae. A plot of total gas distribution cannot be formed since the point-by-point ratio, CO(J=2-1)/CO(J=1-0) is not available.
3.5 617 MHz - 850 m Correlations
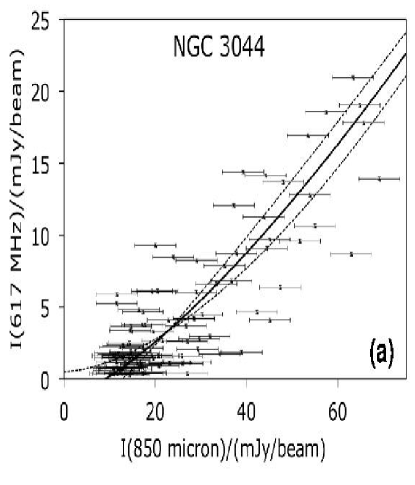
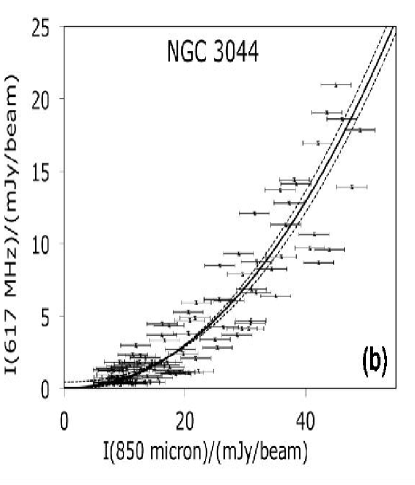
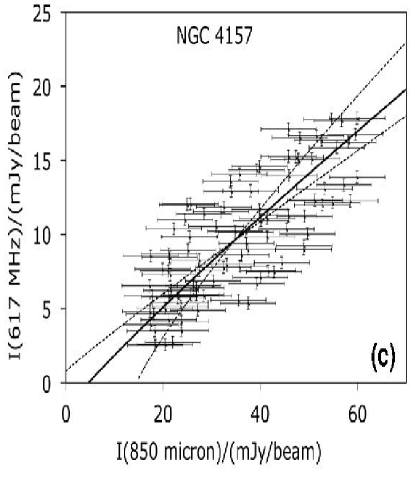
Following Brar, Irwin & Saikia (2003) and, as indicated in Sect. 1.2, we have searched for a correlation between the 617 MHz and 850 m data within the two galaxies; the latter waveband was chosen because it delinates the cold dust well (see Fig. 6) and also has the highest S/N of our sub-mm data. We use the images of Figs. 2b and d and 4b and d, smoothed to matching 15 arcsec spatial resolutions, sampled at 2 pixels per beam (approximately Nyquist) and all images cut off at their respective 3 noise levels.
The results are shown in Figs. 8a and c for NGC 3044 and NGC 4157, respectively, with the radio data on the axis, as is customary. The 617 MHz and 850 m data are clearly positively correlated within the two galaxies, the correlation coefficients being 0.84 and 0.77 for NGC 3044 and NGC 4157, respectively. The scatter in the two plots exceeds the individual error bars on the points, a result which is also found for the radio continuum - FIR relation, and the extent of the scatter appears to be similar to that of the radio continuum - FIR relation, i.e. approximately a factor of 2 both within and between galaxies (e.g. Yun, Reddy & Condon, 2001; Bell, 2003; Hoernes et al., 1998; Hippelein et al., 2003; Murphy et al., 2006a).
We then searched for the best relation between the two quantities using the least squares bisector approach (Isobe et al., 1990) but as applied to potentially non-linear data. Such an approach allows for the presence of a non-zero intercept, should one exist. We use a Levenberg-Marquardt algorithm to search for a power law of the form, , which finds the best fit by minimizing the weighted sum of the squared residuals in the coordinate. The fit is carried out in both the ‘forward’ direction (617 MHz data on the axis) as well as the ‘reverse’ direction (m data on the axis). The results of these two best fits are shown as dashed curves in Fig. 8a and c. The best fit is then considered to be the bisector of the forward and reverse fits, where is the average of the two fitted power law indices, the bisector passes through the crossing point of the two fits, and the bisector is placed such that areas between it and the forward and reverse fits are minimized. The bisectors are shown as solid curves in Fig. 8a and c and their parameters are listed in Table 5.
The results of Table 5 do not change significantly if the lower cutoff is varied or if the pixel sampling is varied. For example, we have tried a lower cutoff of 2 and also one pixel-per-beam averaging, yielding consistent results. The uncertainties are given for , which is the most important fitted parameter (see Sect. 4), determined from the larger of the formal error of the fit and some variation that results from systematic trials with different input parameters as starting points, and finally adjusting to one pixel/beam sampling. In each case, a power law fit improved the result over a simple linear fit (i.e. is lower), although, for both galaxies, the uncertainty on the power marginally encompasses the linear case (1.40.5 for NGC 3044 and 0.910.08 for NGC 4157).
| NGC 3044333333An equation of the form, has been applied, where and are the 617 MHz and 850 m flux densities, respectively, in mJy beam-1. | NGC 4157a | ||||||||
|---|---|---|---|---|---|---|---|---|---|
| 343434Standard deviation of the Gaussian smoothing kernel applied to the m data. Blank means no smoothing. | 353535Fitted parameters as defined in above. | c | c | 363636Reduced , i.e. weighted sum of the squared residuals in the coordinate, normalized by the number of degrees of freedom. | b | c | c | c | d |
| 0.06 | 1.4 0.5 | -1.3 | 7.55 | 0.046 | 0.910.08 | -1.9 | 7.34 | ||
| (0.84 kpc) | 0.005 0.003 | 2.10.3 | 0.04 0.2 | 3.06 | (0.63 kpc) | 0.07 0.05 | 1.40.3 | 1.5 0.5 | 4.9 |
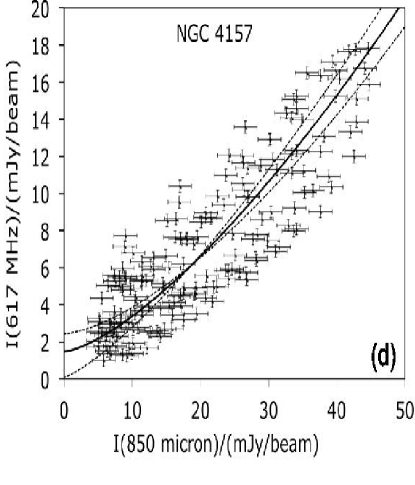
As indicated in Sect. 1.2, the FIR-radio continuum relation has been shown to improve when the FIR emission is smoothed. This process effectively ‘forces’ the UV photon dust optical depth to more closely match the synchrotron diffusion length. Following Murphy et al. (2008), we apply a sequence of smoothing kernels to the same m maps used above with consecutively increasing ‘smearing scale-lengths’. A m/617 MHz ratio map is then formed, normalized, and the residuals compared to see which, if any, improve upon the relations plotted in Figs. 8a and c. We tried both exponential smearing kernels () where is the distance from each point and is the exponential scale length (both in the plane of the sky) as well as gaussian smearing kernels (), where is the standard deviation of the gaussian. In both cases, a sequence of scales from 1 to 25 arcsec in 1 arcsec steps was tried. Like Murphy et al. (2008), we find that the residuals first decrease and then increase again as kernel size increases, resulting in a clear scale for which the fit is best.
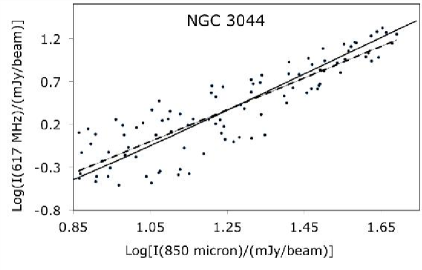
The best fit results are given in Table 5 and are plotted in Figs. 8b and d. There is no doubt that the fits are improved after applying this smoothing and, moreover, that the correlation becomes non-linear (2.10.3 for NGC 3044 and 1.40.3 for NGC 4157). For these cases with smoothing kernels, we also provide uncertainties on the other fitted parameters, as described above. Note that the intercept for NGC 3044 (Table 5) is consistent with zero. This is not the case for NGC 4157 although, for both galaxies, the forward and reverse bisectors encompass the (0,0) point. Since the intercept is zero for NGC 3044, we have also provided a logarithmic plot for this galaxy which is shown in Fig. 9. The best fit linear slope in this space with the displayed sampling (1.9 0.1) agrees with the non-linear fit of Table 5.
We find that the Gaussian smoothing kernel produces a better fit than an exponential kernel. It has been suggested that an exponential kernel is more likely to describe a situation in which cosmic ray electrons escape from the disk whereas a Gaussian kernel would describe a random walk (Bicay & Helou, 1990). For an edge-on galaxy, it is not straightforward to interpret the resulting best fit scale; however, since we are looking through a long in-disk line of sight in our two galaxies, we would expect that the in-disk (random walk) component should dominate, consistent with our better Gaussian fit. For more face-on galaxies, Murphy et al. (2006a) found that exponentials provided better fits and Marsh & Helou (1998), with earlier data, found that both Gaussians and exponentials were equally acceptable.
The non-linear relationship between the 617 MHz and m emission explains the fact that the major axis slices for these two bands, although roughly correlated, do not follow each other particularly well in Fig. 7 (red and green curves). However, when the functional relationship shown in Fig. 8b is applied to the m emission and renormalized, the widths of the two distributions (not shown) match each other to well within a beam size. (Note that squaring the m emission will narrow its distribution, bringing it in alignment with the 617 MHz emission after normalization.) These results will be discussed further in Sect. 4.
4 Discussion
4.1 High-Latitude Emission
4.1.1 NGC 3044
The presence of a multi-phase gaseous halo in NGC 3044 has been known for some time (Hummel & van der Hulst, 1989; Condon et al., 1990; Colbert et al., 1996; Irwin, English & Sorathia, 1999; Irwin, Saikia & English, 2000; Collins et al., 2000; Tüllmann & Dettmar, 2000; Miller & Veilleux, 2003; Tüllmann et al., 2006; Lee & Irwin, 1997). See Collins et al. (2000), for example, for measurements of the HI and eDIG scale heights in this galaxy. Our new observations are the first at 617 MHz and m and reveal several new high latitude features in these two wavebands (Fig. 2 and Sect. 3.1.1).
These disturbances are better seen in several selected overlays shown in Fig. 10; the greyscales show H emission, HI total intensity emission, and smoothed H emission in frames a, b, and c, respectively. At a location of about 1.5 arcmin from the nucleus along the north-west major axis there is a gap in the H emission in the disk (Fig. 10a). At this position is an HI supershell, part of which is visible as the high latitude feature, F10 (Fig. 10b), so labelled by Lee & Irwin (1997). The narrow vertical dust feature observed at m, although at a low S/N, occurs adjacent to F10 and the double-pronged 617 MHz feature is also at this position. Apparently, there is disturbance in the disk at this location which is affecting all of the components displayed and that disturbance has excavated an ionized gas cavity in the disk. This is not the first time that high latitude features have been associated with a gap or absence of H emission in the underlying disk; see Lee et al. (2001) for another prominent example in NGC 5775.
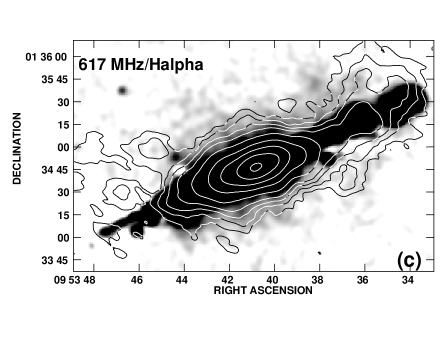
On the whole, there is global correspondence between the radio continuum and H emission as seen in Fig. 10c). This correspondence, which has been pointed out by many authors, including Collins et al. (2000) for NGC 3044 itself, can be understood from the fact that both components are associated with massive star formation.
What is more unusual, as pointed out in Sect. 3.1.1, are the extraplanar features which appear to originate at the two ends of the major axis. In particular, at the south-east end, the emission is truncated approximately where the H emission also narrows abruptly (Fig. 10c). We then see a series of disconnected emission features in both the GMRT 617 MHz and VLA 20 cm images (Figs. 2b and 3b, respectively), including the feature at RA 9h 53m 51s, DEC 01∘ 35′ 45′′ which we have labelled the non-thermal cloud (NTC) in Fig. 2b. The feature centers at approximately 2 arcmin (13 kpc) from the galaxy’s major axis.
In Fig. 11 we show the 617 MHz (red contours) and cm (blue dashed contours) emission of NGC 3044 superimposed on a greyscale image of the m emission taken from the Wide-field Infrared Survey Explorer (WISE) all sky survey (Wright et al., 2010; Cutri et al., 2012), the latter enhanced to show low intensities that are 2 in brightness. The m emission is an indicator of the presence of warm dust (of order 130 K for classical grains in thermal equilibrium). This map shows that the halo of NGC 3044 is even more extensive than previously known and shows considerable substructure, including vertical extensions and arcs as well as ‘disconnected’ features towards the north. It is beyond the scope of this paper to discuss the WISE results in detail; however, when considered together with the two independent radio continuum maps (GMRT and VLA), the results give credence to the reality of the northwards extensions that begin on the south-east end of the major axis. Note that, at low S/N, sensitivity to spatial scales (which depends on an array’s uv coverage) is as important as S/N in determining what emission features will be detected. Consequently, the GMRT and VLA emission, while overlapping, do not align perfectly and should not be used to determine spectral indices at these low emission levels. Put together, though, the truncation of the radio continuum major axis where the northwards extension begins, the abrupt narrowing of the H emission at this position, and emission extending towards the north that is visible in GMRT 617 MHz, the VLA cm map, and the WISE m map, suggest that a disruption has occurred at the south-east end of the major axis in this galaxy and expelled material to the north of the plane.

Bearing in mind the low S/N of the NTC, if we nevertheless take it at face value, we can estimate some physical parameters. Excluding the smaller features closer to the major axis, the NTC, as shown in Fig. 2b, has a flux density of 3 mJy, or a spectral power of W/Hz. By comparison, the flux density of the Galactic supernova remnant, Cas A, is Jy for epoch 2005.5 (Vinyaĭkin, 2007), corresponding to W/Hz at its distance of 3.4 kpc (Hammell & Fesen, 2008). Thus, the radio power of the NTC alone corresponds to 36 equivalent supernova remnants. If we include features closer to the disk, the value approximately doubles. The environment of the NTC differs substantially from that of Cas A; nevertheless this comparison suggests that a massive star-forming region in the disk could indeed have been responsible for the observed emission from the point of view of energetics.
Regarding timescales, from the mean magnetic field strength ( G) found throughout the disk and the observed halo of NGC 3044 (Irwin, English & Sorathia, 1999), the mean cosmic ray electron lifetime is yr (see Sect. 4.1.3). However, the magnetic field was found to vary from 3.5 to 8.9 G and it is likely that CRs far from the disk would be associated with magnetic fields that are at the low end of this range. Consequently, a lifetime of yr () may be more appropriate. For a distance of 13 kpc, then, the outflow velocity would be 91 km s-1 which is much less than the 300 km s-1 outflow velocity observed in NGC 253 by Heesen et al. (2009), for comparison.
The above calculations are order of magnitude only and are meant to illustrate the feasibility of non-thermal emission far from the disk of NGC 3044 having originated from activity within the disk. We require more information on the magnetic field distribution and strength to make more definitive statements.
As noted earlier, the 617 MHz emission in NGC 3044 shows curvature towards the north on both ends of the major axis of NGC 3044 which sometimes suggests that ram pressure stripping could be occurring as the galaxy passes through an intergalactic medium (IGM) in a southerly direction. However, there is no such evidence in the HI emission and, in fact, HI extensions are observed on both the north and south sides of the major axis. In addition, the isovelocity HI contours show a slight curvature which, if caused by motion through an IGM, would imply a motion to the north-east rather than the south-west (see Fig. 4 of Lee & Irwin, 1997). This suggests that the observed 617 MHz extensions at the ends of the major axis and the disconnected northern features may have been produced from internal activity which is asymmetrically placed with respect to gas distribution (or magnetic field distribution) in the galaxy. Lee & Irwin (1997) also argue for an internal origin for the HI supershells and the energetics (above) are consistent with this. With distributed star formation in the galaxy, it is reasonable to expect that outflows will more effectively eject material far from the plane at large galactocentric radii where the internal disk density is lower.
4.1.2 NGC 4157
NGC 4157 is also known to exhibit high latitude emission (Irwin, English & Sorathia, 1999; Kennedy, 2009) but fewer observations of this galaxy have been carried out in comparison to NGC 3044. As seen in Figs. 4c and d, we do not have sufficient S/N for a clear detection of high latitude dust in NGC 4157. The radio continuum emission (Figs. 4a and b) shows some extensions that are roughly at the locations of those seen in the VLA 20 cm map (Fig. 5). A new feature is seen in the 617 MHz map (Fig. 4b) in the form of a radio continuum extension beginning at the far north-eastern end of the major axis and extending south, as described in Sect. 3.2.1.
This southern extension can be better seen in Fig. 12 where it is overlaid onto a greyscale image of the m WISE emission. This plot shows that warm dust exists in a halo that extends up to 1.3 arcmin (4.9 kpc) from the plane. The HI in this galaxy extends to roughly the same z distance Kennedy (2009) (although HI also extends much farther in the radial direction along the major axis). The dust, therefore, may be a component of the high-latitude HI in the same way that it normally is within a galaxy disk.
For the purposes of our 617 MHz comparison, we note that the southern 617 MHz extension coincides with discrete dust emission in roughly the same direction which gives weight to our assertion that the extension is real. Indeed, some of the 617 MHz features on the north side of the disk also have dust counterparts. Although it isn’t clear whether these features occupy the same volume, the evidence continues to mount that all constituents of the ISM are represented in galaxy halos. See Lee et al. (2001) for an earlier example.
4.1.3 The Non-thermal - Cold Dust Relation in NGC 3044
As can be seen from Fig. 6, the m emission in NGC 4157 (as modeled) still includes a contribution from the warm dust component whereas the emission of NGC 3044 is strongly dominated by only cold dust at that wavelength. In addition, the S/N of the NGC 3044 data is higher than that of NGC 4157. We therefore consider only NGC 3044 in our discussion of the 617 MHz - m relation which we take to represent a relationship between synchrotron emission and cold dust (T K, Table 4).
Firstly, we note that the relationship between these two components is significantly improved when a smearing kernel is introduced to the sub-mm data (Fig. 8), consistent with earlier results (Murphy et al., 2006a, b, 2008, 2009). This kernel ‘corrects’ for differences between the photon mean free path to dust absorption and the CR electron diffusion length. We find, not only that the correlation improves, but also that it becomes clearly non-linear such that ; that is, the relationship is roughly consistent with a luminosity relation of . By comparison, Pierini et al. (2003) found and Brar, Irwin & Saikia (2003) found a roughly linear 617 MHz - m relation for NGC 5775. Neither of these authors applied a smearing kernal and, as Fig. 8 illustrates, the correlation becomes much flatter (, Table 4), when a smoothing kernel is ignored.
Murphy et al. (2006b) have shown that galaxies with higher SFRs per unit area have lower kernel scale lengths. They interpret this result to imply that galaxies with high SFRs contain, on average, younger SF regions from which CR electrons have not had sufficient time to diffuse to large scales. When SF has not been so recent, by contrast, the difference between the radio continuum scale and the dust scale diminishes.
As indicated in Sect. 3.5, it is not straightforward to interpret the meaning of the kernel size for an edge-on galaxy in which the line of sight that is being probed varies with position and may probe a range of SF regions of varying ages. In addition, our best result corresponds to a gaussian kernel which cannot be directly compared to the exponentials used by Murphy et al. (2006b) in more face-on systems. Nevertheless, we can consider some representative timescales to see whether our kernel size could reasonably represent a link between the CR electron and dust heating scales.
For example, based on spatially resolved images at cm and cm, the minimum energy magnetic field strength in NGC 3044 has a mean value of G, ranging from 3.5 to 8.9 G to within uncertainties of approximately a factor of 2 (Irwin, English & Sorathia, 1999). The lifetime for cosmic ray electrons against synchrotron and inverse Compton losses, for an isotropic velocity distribution of CR electrons, is given by (e.g. Murphy et al., 2006b),
| (4) |
where is the magnetic field strength and and are the magnetic field and radiation energy densities, respectively.
Taking and , then and we find yr (ranging from to 3.3 to 14 yr). This implies that the 617 MHz emission is measuring a massive SF history of NGC 3044 that is integrated over yr; it is not measuring the recent SF activity in the galaxy.
In this time, how far can CR electrons diffuse? The diffusion timescale can be written (Murphy et al., 2009),
| (5) |
where represents the distance that a CR electron can diffuse from its point of origin via a random walk, assuming an energy-dependent diffusion coefficient. Setting yields 4.3 kpc. This is a significant distance and sufficient to allow CR electrons to ‘fill’ the galaxy disk, assuming that SF has been widely distributed over the past yr.
If the cold dust is heated by the ISRF which is similarly widely distributed throughout the disk then, at least to order of magnitude, our smoothing kernel should represent roughly the difference between the CR electron diffusion length and the dust mean free path to ISRF photons. The latter is not known for NGC 3044 (and likely varies), but in our own Galaxy, a typical dust cross-section to absorption and scattering in the visible through UV part of the spectrum for big grains, , ranges from 0.2 to 1 cm2 per hydrogen atom (Désert, Boulanger & Puget, 1990). For this range of dust cross-section and using the mean ISM gas density in NGC 3044 of cm-3 (Lee & Irwin, 1997), the mean free path of ISRF photons to dust is kpc.
Our Gaussian smoothing kernel of kpc (Table 5) corresponds to a radius (half-width at half maximum) of 1.0 kpc. If we convolve this size scale with , the result is kpc which can now be compared to kpc estimated above. Although there are many uncertainties and assumptions in this comparison, the result indicates that the interpretation of the smoothing kernel as accounting for the difference between the CR electron diffusion scale and the photon mean free path to dust is reasonable.
Our results suggest that there is a clear link between synchrotron emission, which measures the integrated massive SF history in the galaxy over a few 107-8 yr, and the ISRF-heated cold dust. In the latter case, the fraction of heating that is due to FUV photons from young massive stars is uncertain (e.g. see the discussion in Bell, 2003). Older stars contribute approximately an order of magnitude more photons than OB stars in the Solar neighbourhood (Tielens, 2006, p. 13) whereas the cross-section for large grains increases by only a factor of 5 from the infrared through the ultraviolet (Désert, Boulanger & Puget, 1990). In addition, we are considering emission from regions (of order 4.3 kpc, see above) which are much larger than typical regions within which hot massive stars exist; the heating source for the m dust emission over such size scales is then the cooler stellar population (as has been found by other authors previously), rather than the hot, young massive stars that eventually give rise to the synchrotron emission via supernovae.
What then is the connection and the reason for the non-linear relation? We first note that non-linear relations have been observed before, especially when considering those of lower luminosity () and/or galaxies that have been studied at low radio frequencies ( GHz). In such cases, the relation , where has been observed. Such a trend has been interpreted as reflecting an increasing contribution from older stars in heating the dust, a non-linear relation between the SFR and radio continuum emission, or an underproduction of both radio and and infrared emission in low luminosity galaxies (see e.g. Bell, 2003).
To our knowledge, however, a slope as steep as has not previously been observed, likely because of the lack of smoothing as described above. The closest comparisons are to the results of Brar, Irwin & Saikia (2003) and Hoernes et al. (1998) for NGC 5775 and M 31, respectively, who both find approximately linear relations between non-thermal radio emission and cold dust, in agreement with our result when a smoothing kernel is ignored.
For both the 617 MHz and m emission, we are observing optically thin emission over equivalent lines of sight. Then the relation compares the emissivities of the two components (see also Groves et al., 2003). For synchrotron emission, the emission coefficient can be expressed as,
| (6) |
where represents number density of CR electrons, is the magnetic field strength (we take ), and is the power law slope of the CR electron spectrum.
There is substantial observational and theoretical evidence for an approximately constant Alfvén speed in the ISM leading to , where is the gas density (Troland & Heiles, 1986; Chaboyer & Henriksen, 1990; Groves et al., 2003; Thompson, Quataert, & Murray, 2009, and others). In addition, we expect that , where is the massive SFR. If we accept that the massive SFR is governed by a Schmidt law such that , then the above equation becomes,
| (7) |
For the dust emissivity, we have,
| (8) |
which is essentially a variant of Eqn. 1 in which the optical depth is expressed explicitly as a function of the number density of dust grains (). If we take a constant gas/dust ratio, then . In addition, variations in gas density in the ISM can be many orders of magnitude, whereas a reasonable variation in the cold dust temperature results in a variation in of factors of a few (e.g. increasing the error bar on for NGC 3044 by a factor of two varies by a factor of approximately 2). Dust temperatures may vary a great deal in the ISM, but since we are considering only the m emission which we have linked to the cold dust of NGC 3044 only, we will assume that gas density variations dominate and approximate the cold dust emission as,
| (9) |
Another way of expressing the above is that the ISRF imposes an essentially constant heating effect on due to a presumed dominance of widespread and long-lived cooler stars to this heating.
Combining Eqns. 7 and 9 and restoring the flux nomenclature yields,
| (10) |
Taking the observational results for the Schmidt law summarized by Kennicutt (2008), i.e. , and using the mean spectral index between and cm measured by Irwin, English & Sorathia (1999) for NGC 3044, , leading to , we find,
| (11) |
which agrees with the measured for NGC 3044, within errors. See Niklas & Beck (1997) for an earlier example of this kind of approach.
It is important to note the variations that can occur in the above indices. The measured spectral index of NGC 3044, for example, ranges from -1.0 to 0.2 within the galaxy and may differ from these values at the lower frequency that has been used in these observations. As for the Schmidt law, theoretical considerations result in values that can generally be found in the range, (Larson, 1992), though a free-fall value yields (Henriksen, 1991, his Eqn. 38). Observationally, variations in are also observed (Bigiel, 2008; Kennicutt & Evans, 2012). Nevertheless, the above result shows that a simple application of the average spectral index and the most universally accepted Schmidt law provides a reasonable explanation for the 617 MHz - 850 m correlation found in NGC 3044. For this result, it is important that the non-thermal radio emission and cold dust emission are sufficiently isolated spectrally and that the dust scale length is adjusted through smoothing.
To summarize, if we assume a constant ISRF heating of the cold dust, then the link between synchrotron emission and cold dust is via the gas density. A higher gas density yields a higher SFR and a higher magnetic field, both of which affect the synchrotron emission, and a higher gas density yields a higher dust density leading to a higher cold dust emission.
5 Conclusions
We have observed the edge-on galaxies, NGC 3044 and NGC 4157 at 617 MHz using the GMRT and at and m using the JCMT. These are the first results for these two galaxies at these wavelengths. The main results are as follows.
For NGC 3044, high latitude emission is observed at 617 MHz, consistent with previous radio continuum results and some evidence is present at low intensities for vertical extensions at m also.
At the far ends of the major axis of NGC 3044, there appear to be disturbances which have resulted in 617 MHz emission extending away from the plane towards the north. The most most obvious of these begin on the far south-east end of the major axis, including some ’disconnected’ features, one of which we have named the non-thermal cloud (NTC). Order-of-magnitude calculations suggest that the NTC could have originated from activity related to star-formation in the galaxy’s disk. Another radio continuum extension is seen on the NW end of the major axis at which an HI supershell is known. Such disturbances will be more effective at ejecting material away from the plane if they are at large galactocentric radii where the disk density is lower.
Some high latitude 617 MHz emission is observed in NGC 4157 but we do not have the sensitivity to unambiguously detect halo dust emission at either m or m for this galaxy. A large radio continuum extension is seen towards the south beginning at the end of the north-eastern major axis in this galaxy and appears to correlate with high-latitude emission seen at m from the WISE satellite.
We could not fit a single temperature model to the sub-mm spectrum for either NGC 3044 or NGC 4157, but could fit both spectra with a two-temperature model. For NGC 3044, we find T K and T K and for NGC 4157, we find T K and T K. For the latter galaxy, we do not detect emission at the largest galactocentric radii. Dust masses are and for NGC 3044 and NGC 4157, respectively. There is more cold than warm dust in both galaxies.
We find a clear correlation between the 617 MHz and m emission for both NGC 3044 and NGC 4157. This correlation improves significantly if a smoothing kernel is applied to the m data to account for differences between the mean free path of a dust-heating photon and the diffusion length of CR electrons in the ISM. Simple timescale and length scale arguments suggest that such a smoothing kernel can indeed account for these differences.
With an applied smoothing kernel, the 617 MHz and m correlation becomes strongly non-linear. For the best data set and the one in which the m is strongly dominated by cold dust (i.e. NGC 3044), we find .
The non-linear relation between synchrotron emission and cold dust can be understood if the heating of the cold dust is the ISRF in which cooler stars (rather than hot young stars) dominate, leading to variations in cold dust emission that are dominated by density rather than temperature variations. Synchrotron emission depends on the magnetic field strength and CR electron generation, both of which depend on gas density via and the Schmidt law, respectively. With these assumptions, which agrees with the observed correlation.
Acknowledgments
This research has made use of the NASA/IPAC Extragalactic Database (NED) which is operated by the Jet Propulsion Laboratory, California Institute of Technology, under contract with the National Aeronautics and Space Administration. We are grateful to Dr. Rob Swaters for providing WHISP data and to Dr. Siow-Wang Lee for providing HI and CO(J=2-1) data. Thanks also to R. Rand for providing the H image. The CO(J=1-0) data were originally provided by G. Golla for comparative purposes. We are especially grateful to Loretta Dunne for insightful comments.
References
- Ade et al. (2011) Ade, P. A. R., et al. 2011, A&A, 536, 16
- Alton et al. (1998) Alton, P. B., et al. 1998, ApJ, 507, L125
- Alton et al. (2000) Alton, P. B., et al. 2000, A&A, 356, 795
- Ananthakrishnan (2005) Ananthakrishnan, S. 2005, Proc. of the Int. Cosmic Ray Conf., 10, 125
- Bell (2003) Bell, E. F. 2003, ApJ, 586, 794
- Bendo et al. (2002) Bendo, G. J., et al. 2002, AJ, 123, 3067
- Bicay & Helou (1990) Bicay, M. D., & Helou, G. 1990, ApJ, 362, 59
- Bigiel (2008) Bigiel, F. et al. 2008, AJ, 136, 2846
- Brar, Irwin & Saikia (2003) Brar, R. S., Irwin, J. A., & Saikia, D. J. 2003, MNRAS, 340, 269
- Bregman & Pildis (1994) Bregman, J. R., & Pildis, R. A. 1994, ApJ, 420, 570
- Chaboyer & Henriksen (1990) Chaboyer, B., & Henriksen, R. N. 1990, A&A, 236, 275
- Colbert et al. (1996) Colbert, E. J. M., et al. 1996, ApJ, 467, 551
- Collins et al. (2000) Collins, J. A., Rand, R. J., Duric, N., & Walterbos, R. A. M. 2000, ApJ, 536, 645
- Condon (1987) Condon, J. J. 1987, ApJS, 65, 485
- Condon et al. (1990) Condon, J. J., Helou, G., Sanders, D. B., & Soifer, B. T. 1990, ApJS, 73, 359
- Cutri et al. (2012) Cutri, R. M., et al. 2012, Explanatory Supplement to the WISE All-Sky Data Release Products http://wise2.ipac.caltech.edu/docs/release/allsky/expsup/index.html
- de Jong et al. (1985) de Jong, T., Klein, U., Wielibinski, R., & Wunderlich, E. 1985, A&A, 147, 6
- de Vaucouleurs et al. (1991) de Vaucouleurs, G., de Vaucouleurs, A., Corwin, H. G., Jr., et al. 1991, Third Reference Catalogue of Bright Galaxies (RC3) (Springer Verlag)
- Désert, Boulanger & Puget (1990) Désert, F.-X., Boulanger, F., & Puget, J. L. 1990, A&A, 237, 215
- di Francesco et al. (2008) di Francesco, J., et al. 2008, ApJS, 175, 277
- Dunne & Eales (2001) Dunne, L., & Eales, S. A. 2001, MNRAS, 327, 697
- Dunne et al. (2000) Dunne, L., et al. 2000, MNRAS, 315, 115
- Dupac et al. (2003) Dupac, X., et al. 2003, MNRAS, 344, 105
- Eales & Edmunds (1996) Eales, S. A., & Edmunds, M. G. 1996, MNRAS, 280, 1167
- Fraternali et al. (2002) Fraternali, F., Cappi, M., Sancisi, R., & Oosterloo, T. 2002, ApJ, 578, 109
- Garcia (1993) Garcia, A. M. 1993, A&AS, 100, 47
- Gil de Paz et al. (2007) Gil de Paz, A., et al. 2007, ApJS, 173, 185
- Gioia & Fabbiano (1987) Gioia, I. M., & Fabbiano, G. 1987, ApJS, 63, 771
- Groves et al. (2003) Groves, B. A., Jungyeon, C., Dopita, M., & Lazarian, A. 2003, PASA, 20, 252
- Hammell & Fesen (2008) Hammell, M. C., & Fesen, R. A. 2008, ApJS, 179, 195
- Heesen et al. (2011) Heesen, V., Beck, R., Krause, M., & Dettmar, R.-J. 2011, A&A, 535, 79
- Heesen et al. (2009) Heesen, V., Beck, R., Krause, M., & Dettmar, R.-J. 2009, A&A, 494, 563
- Helou et al. (1985) Helou, G., Soifer, B. T., & Rowan-Robinson, M. 1985, ApJ, 298, 7
- Helou & Bicay (1993) Helou, G., & Bicay, M. D. 1993, ApJ, 415, 93
- Henriksen (1991) Henriksen, R. N. 1991, ApJ, 377, 500
- Hippelein et al. (2003) Hippelein, H. et al. 2003, A&A, 407, 137
- Hoernes et al. (1998) Hoernes, P., Berkhuijsen, E. M., & Xu, C. 1998, A&A, 334, 57
- Holland et al. (1999) Holland, W. S., et al. 1999, MNRAS, 303, 659
- Howk & Savage (1999) Howk, J. C., & Savage, B. D. 1999, AJ, 117, 2077
- Hummel & van der Hulst (1989) Hummel, E., & van der Hulst, J. M. 1989, A&AS, 81, 51
- Hummel, Beck, & Dettmar (1991) Hummel, E., Beck, R., & Dettmar, R.-J. 1991, A&AS, 87, 309
- Ipavich (1975) Ipavich, F. M. 1975, ApJ, 196, 107
- Irwin et al. (2012) Irwin, J. A., et al. 2012, AJ, submitted
- Irwin, English & Sorathia (1999) Irwin, J. A., English, J., & Sorathia, B. 1999, AJ, 117, 2102
- Irwin & Saikia (2003) Irwin, J. A., & Saikia, D. J. 1999, MNRAS, 346, 977
- Irwin, Saikia & English (2000) Irwin, J. A., Saikia, D. J., & English, J. 2000, AJ, 119, 1592
- Irwin & Madden (2006) Irwin, J. A., & Madden, S. C. 2006, A&A, 445, 123
- Isobe et al. (1990) Isobe, T., Feigelson, E. D., Akritas, M. G., & Babu, G. J. 1990, ApJ, 364, 104
- James et al. (2002) James, A., Dunne, L., Eales, S., & Edmunds, M. G. 2002, MNRAS, 335, 753
- Jenness & Lightfoot (1999) Jenness, T., & Lightfoot, J. F. 1999, The SURF Programming Interface, Starlink System Note 72
- Kennedy (2009) Kennedy, H. J. 2009, Investigation of Neutral Hydrogen in Three Edge-on Spiral Galaxies, MSc Thesis, Queen’s University, Canada, available at http://hdl.handle.net/1974/5134
- Kennicutt (1998) Kennicutt, R. C., Jr. 1998, ARAA, 36, 189
- Kennicutt (2008) Kennicutt, R. C., Jr. 2008, Pathways Through an Eclectic Universe, ASP Conf. Series, Vol. 390, Ed. J. H. Knapen, T. J. Mahoney, & A. Vazdekis, San Francisco, ASP, p. 149
- Kennicutt & Evans (2012) Kennicutt, R. C., Jr., & Evans II, N. J. 2012, ARAA, 50, 531
- Komugi et al. (2008) Komugi, S., et al. 2008, ApJS, 178, 225
- Larson (1992) Larson, R. B. 1992, in Star Formation in Stellar Systems, ed. G. Tenorio-Tagle, M. Prieto, & F. Sánchez (Cambridge: Cambridge Univ. Press), 125
- Lee (1998) Lee, S.-W. 1998, The Interstellar Medium and Disk-Halo Interaction of the Edge-on Galaxies NGC 3044 and NGC 5775, PhD Thesis, Queen’s University, Canada
- Lee & Irwin (1997) Lee, S.-W., & Irwin, J. A. 1997, ApJ, 490, 247
- Lee et al. (2001) Lee, S.-W., et al. 2001, A&A, 377, 759
- Marengo et al. (1997) Marengo, M., et al. 1997, A&A, 322, 924
- Masi et al. (1995) Masi, S., et al. 1995, ApJ, 452, 253
- Marsh & Helou (1998) Marsh, K. A., & Helou, G. 1998, 493, 121
- Miller & Veilleux (2003) Miller, S. T., & Veilleux, S. 2003, ApJS, 148, 383
- Murphy et al. (2006a) Murphy, E. J., et al. 2006a, ApJ, 638, 157
- Murphy et al. (2006b) Murphy, E. J., et al. 2006b, ApJ, 651, L111; Erratum 2008, ApJ, 672, L85
- Murphy et al. (2008) Murphy, E. J., Helou, G., Kenney, J. D. P., Armus, L, & Braun, R. 2008, ApJ, 678, 828
- Murphy et al. (2009) Murphy, E. J., Kenney, J. D. P., Helou, G., Chung, A., & Howell, J. H. 2009, ApJ, 694, 1435
- Niklas & Beck (1997) Niklas, S., & Beck, R. 1997, A&A, 320, 54
- Noordermeer et al. (2005) Noordermeer, E., van der Hulst, J. M., Sancisi, R., Swaters, R. A., & van Albada, T. S. 2005, A&A, 442, 137
- Pierini et al. (2003) Pierini, D., Popescu, C. C., Tuffs, R. J., & Völk, H. J. 2003, A&A, 409, 907
- Rand et al. (2011) Rand, R. J., Wood, K., Benjamin, R. A., & Meidt, S. E. 2011, ApJ, 728, 163
- Rhee & van Albada (1996) Rhee, M.-H., & van Albada, T. S. 1996, A&AS, 115, 407
- Sanders & Mirabel (1996) Sanders, D. B., & Mirabel, I. F. 1996, ARAA, 34, 749
- Sanders et al. (2003) Sanders, D. B., et al. 2003, AJ, 126, 1607
- Seaquist et al. (2004) Seaquist, E., Yao, L, Dunne, L., & Cameron, H. 2004, MNRAS, 349, 1428
- Sofue (1987) Sofue, Y. 1987, PASJ, 39, 547
- Solomon & Sage (1988) Solomon, P. M., & Sage, L. J. 1988, ApJ, 334, 613
- Stevens & Gear (2000) Stevens, J. A., & Gear, W. K. 2000, MNRAS, 312, L5
- Swarup (1991) Swarup, G. 1991, Current Science, 60, 106
- Swarup et al. (1991) Swarup, G., et al. 1991, Current Science, 60, 95
- Tabatabaei et al. (2010a) Tabatabaei, F. S., Beck, R., & Berkhuijsen, E. 2010a, Highlights of Astronomy, Vol. 15, p. 417
- Tabatabaei et al. (2010b) Tabatabaei, F. S., & Berkhuijsen, E. 2010b, A&A, 517, 77
- Thompson, Quataert, & Murray (2009) Thompson, T. A., Quataert, E., & Murray, N. 2009, MNRAS, 397, 1410
- Tielens (2006) Tielens, A. G. G. M. 2006, The Physics and Chemistry of the Interstellar Medium, Cambridge University Press, Cambridge
- Troland & Heiles (1986) Troland, T. H., & Heiles, C. 1986, ApJ, 301, 339
- Tüllmann & Dettmar (2000) Tüllmann, R., & Dettmar, R.-J. 2000, A&A, 362, 119
- Tüllmann et al. (2006) Tüllmann, R., et al. 2006, A&A, 448, 43
- Tully (1988) Tully, R. B. 1988, Nearby Galaxies Catalog, (Cambridge University Press, Cambridge)
- Tully et al. (1996) Tully, R. B., et al. 1996, AJ, 112, 2471
- Verheijen & Sancisi (2001) Verheijen, M. A. W., & Sancisi, R. 2001, A&A, 370, 765
- Vinyaĭkin (2007) Vinyaĭkin, E. N. 2007, ARep, 51, 87
- Vlahakis et al. (2005) Vlahakis, C., Dunne, L., & Eales, S. 2005, MNRAS, 364, 1253
- Wang et al. (1995) Wang, Q. D., et al. 1995, ApJ, 439, 176
- Wang et al. (2001) Wang, Q., et al. 2001, ApJ, 555, L99
- Whaley et al. (2009) Whaley, C. H., Irwin, J. A., Madden, S. C., Galliano, F., & Bendo, G. J. 2009, MNRAS, 395, 97
- Willmer et al. (2009) Willmer, C. N. A., et al. 2009, AJ, 138, 146
- Wright et al. (2010) Wright, E. L. et al. 2010, AJ, 140, 1868
- Wunderlich & Klein (1988) Wunderlich, E., & Klein, U. 1988, A&A, 206, 47
- Young et al. (1995) Young, J. S., et al. 1995, ApJS, 98, 219
- Young et al. (1996) Young, J. S., et al. 1996, AJ, 112, 1903
- Yun, Reddy & Condon (2001) Yun, M. S., Reddy, N. A., & Condon, J. J. 2001, ApJ, 554, 803
- Zhu et al. (2007) Zhu, M., Gao. Y, Seaquist, E. R., & Dunne, L. 2007, AJ, 134, 118