Production of translationally cold barium monohalide ions
Abstract
We have produced sympathetically cooled barium monohalide ions \ceBaX+ (\ceX = \ceF, \ceCl, \ceBr) by reacting trapped, laser cooled \ceBa+ ions with room temperature gas phase neutral halogen-containing molecules. Reaction rates for two of these (\ceSF6 and \ceCH3Cl) have been measured and are in agreement with classical models. \ceBaX+ ions are promising candidates for cooling to the rovibrational ground state, and our method presents a straightforward way to produce these polar molecular ions.
pacs:
82.30.Fi, 82.20.Pm, 37.10.TyIn recent years, considerable progress has been made in extending laser cooling techniques to both neutral molecules Shuman et al. (2010); Manai et al. (2012); Stuhl et al. (2012); Hummon et al. (2013) and molecular ions Staanum et al. (2010); Nguyen et al. (2011); Bressel et al. (2012). Cold molecular ions are of particular interest for the study of chemical reactions in the quantum regime Willitsch et al. (2008a), electron electric dipole moment searches, Meyer and Bohn (2008); Cossel et al. (2012), testing for time variation of fundamental constants Flambaum and Kozlov (2007), and for use in cavity QED experiments Schuster et al. (2011). One particularly promising class of molecular ions for cooling and precision spectroscopy are alkaline earth monohalide ions which consist of two closed-shell atomic ions. These molecules, among others, can be cooled to the rovibrational ground state via collisions with ultracold neutral atoms Hudson (2009); Rellergert et al. (2013). One method for producing such ions, employed in Refs. Chen et al. (2011); Schowalter et al. (2012); Rellergert et al. (2013), is ablating an appropriate target. Several studies have produced other alkaline earth monohalides such as \ceCaF+ Harvey et al. (1997); Willitsch et al. (2008b); Gingell et al. (2010). Additionally, \ceBa+ is known to react with \ceHCl to form \ceBaCl+ Schowalter et al. (2012), but in this case, the presence of \ceHCl was an unintended byproduct formed by reaction of background gases and ablation products from a \ceBaCl2 target.
Here, we produce translationally cold \ceBaX+ ions (\ceX = \ceF, \ceCl, \ceBr) through reactions with neutral molecules at room temperature and trapped \ceBa+ ions at mK temperatures. We determine the reaction rate constants for the production of \ceBaF+ and \ceBaCl+, and we utilize both non-destructive motional resonance coupling and mass-selective ejection to verify the reaction products. Producing \ceBaX+ ions in this way is simple and allows for the study of different barium monohalide species without significant changes in the experimental setup.
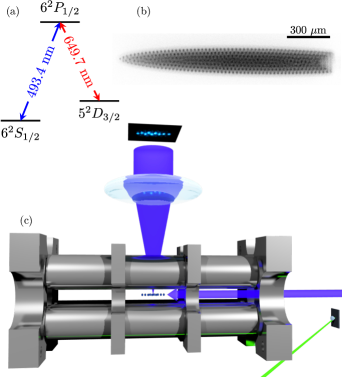
The experiment begins with Coulomb crystals of \ceBa+ ions formed in a linear Paul trap with radius mm and RF frequency MHz with RF applied to all four electrodes (Fig. 1). Typical peak-to-peak RF voltages are 100–400 V for trapping, and up to kV during loading. The barium ions are loaded by ablating a barium metal target in a similar manner as described previously Churchill et al. (2011). Ions are confined axially with end caps separated by 25 mm. Typical end cap voltages are 100–300 V. Cooling ( nm) and repumper ( nm) beams are introduced axially from one end of the trap. This causes an axial sorting of barium isotopes visible as an apparent asymmetry in the Coulomb crystal structure as shown in Fig. 1. We typically tune the cooling and repumper beams such that they are red detuned for maximum fluorescence of 138Ba+ since it is the most abundant isotope and therefore maximizes the fluorescence signal. The lasers are separately stabilized to temperature controlled cavities that are in turn locked to a 780 nm laser referenced to a \ceRb vapor cell (see Ref. Rohde et al. (2010) for a similar locking scheme).
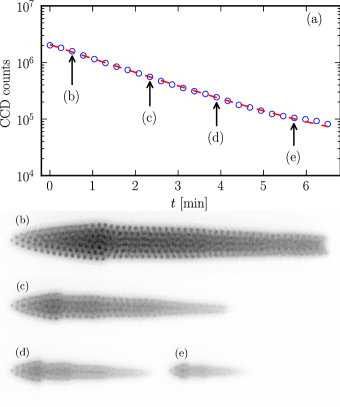
In order to create \ceBaX+ molecular ions, the reactants are leaked into the vacuum chamber at partial pressures of up to torr. At these pressures, the laser cooled ions remain in an ordered state. The reactions result in the loss of \ceBa+ ions and so a loss rate can be determined by measuring the total fluorescence over time (Fig. 2). The loss rates can then be transformed into reaction rate constants by measuring the loss rate at different pressures and extracting the slope of a linear fit to these data. We utilize \ceSF6, \ceCH3Cl, and \ceBr2 as reactants. \ceSF6 and \ceCH3Cl are in the gas phase at room temperature and are stored in a reservoir of about 500 mL at pressures of slightly more than 1 atm which is connected to the inlet of the leak valve. Bromine is a liquid at room temperature, but has a sufficiently high vapor pressure of \ceBr2 ( torr Lide (2007)) to use as a gas phase reactant. A few mL of liquid bromine is added to a small reservoir at rough vacuum which is connected to the leak valve inlet.
The simplest model for characterizing the rate of reactions between ions and neutral, nonpolar molecules is the Langevin model Gioumousis and Stevenson (1958). Assuming spherical symmetry and given the charge on the ion and polarizability of the neutral molecule, the Langevin reaction rate constant can be expressed in Gaussian-cgs units as
| (1) |
where is the reduced mass. Typical rates calculated from this model are of order cm3 s-1. The Langevin model is not comprehensive, but nevertheless serves as a useful estimate of reaction rates and many nonpolar molecules do indeed react at or near the predicted rate. For polar molecules, the Langevin rate must be corrected by taking into account the dipole moment . The corrected rate constant is expressed as Troe (1985)
| (2) |
where and is the component of the rate constant associated with a “locked in” dipole. There are several methods for estimating including the average dipole orientation theory Su and Bowers (1973), but to lowest order, by setting , Eq. (2) can be used to estimate an upper bound on the reaction rate.
In order to translate loss rate measurements into a reaction rate constant, we measure the loss rate of \ceBa+ ions at several different reactant gas pressures. The measured reaction rate constant is then the slope of a linear fit to the loss rate versus pressure data. We use a Varian UHV-24 ion gauge to measure pressures and apply appropriate correction factors in order to obtain a reading more suitable for the reactant introduced. This gives us corrected rate constants . Ultimately, since the ion gauge was not calibrated, the dominant source of error lies with the pressure measurements and thus the measured values are accurate only within a factor of 2 or 3.
To form \ceBaF+, we utilize \ceSF6. The expected reaction is
| (3) |
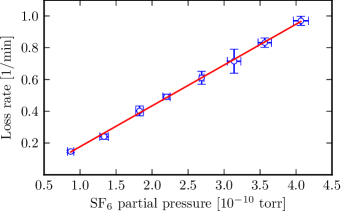
which from known thermochemistry is exothermic by 2.8 eV. In order to determine the reaction rate constant between \ceBa+ and \ceSF6, a series of measurements of the \ceBa+ loss rate were made at several different partial pressures of \ceSF6. A linear fit of the measured loss rates versus partial pressure then yields the reaction constant (Fig. 3) which is listed in Table 1. We find that the reaction between \ceBa+ and \ceSF6 proceeds in good agreement with the Langevin model.
| Reactant | ||||||
|---|---|---|---|---|---|---|
| \ceSF6 | 0.58 | 2.3 | 1.3 | 0.59 | — | — |
| \ceCH3Cl | 0.63 | 2.6 | 1.6 | 0.82 | 2.87 | |
| \ceBr2 | — | 3.8 | — | 0.70 | — | — |
| \ceI2 | — | 5.4 | — | 0.80 | — | — |
Energy considerations imply that Eq. (3) should be the dominant reaction between \ceBa+ and \ceSF6, but to verify this, we performed mass spectroscopic measurements on reaction products. One common method is to excite motional resonances of the trapped ions by applying an additional AC voltage to the trap electrodes. Ions are heated when in resonance with this applied voltage which results an increase of temperature for all trapped ions through their mutual Coulomb repulsion. This increased temperature changes the laser cooled ion fluorescence and thus can be used to determine the ion masses Roth et al. (2005, 2007); Landa et al. (2012). For a single ion, axial and radial frequencies are given respectively by and , where , is a unitless geometric constant, and is half the distance between the end caps. However, co-trapping ions of different species is well known to introduce shifts away from these frequencies which complicates attempts to use the AC resonance frequencies to determine the masses of the trap contents with good precision Baba and Waki (2002). Furthermore, the preceding expressions are derived assuming the trapping pseudopotential is quadratic in each dimension. This is generally a good approximation in the radial direction, but due to the geometry of our trap, the axial potential deviates from a quadratic approximation significantly for large Coulomb crystals. Nevertheless, frequency sweeps are still useful as they are nondestructive and provide information about the mass of the sympathetically cooled ions relative to that of the laser cooled ions. We drive radial modes by applying AC signals of several hundred mV to one of the trap electrodes. Typical results from frequency sweeps of Coulomb crystals composed of \ceBa+ and reaction products (\ceA+) are presented in Fig. 4.
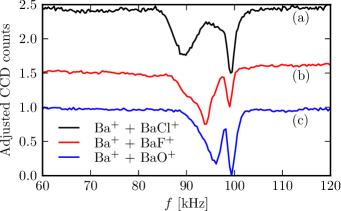
It should be noted that the mass of \ceBaF+ ( amu) is very near the mass of \ceSF6+ ( amu). Given the known frequency shift effects and fairly low mass resolution, frequency sweeps alone are not sufficient to preclude the possibility that the reaction between \ceBa+ and \ceSF6 is simple charge exchange. However, the ionization energy of \ceSF6 is known to be eV compared to 5.2 eV for \ceBa Lias (2011); Karlsson and Litzén (1999), making such a reaction energetically unfavorable. Furthermore, \ceSF6+ is expected to rapidly decay into \ceSF5+ which is lighter than \ce^138Ba+ by more than 10 amu Tachikawa (2000). Lighter sympathetically cooled ions are more tightly confined at a given RF voltage, and therefore form a light core at the center of the Coulomb crystal. Likewise, heavier sympathetically cooled ions form shells on the exterior of the Coulomb crystal. Since we only observe the latter crystal structures, we conclude all reaction products are heavier than \ceBa+.
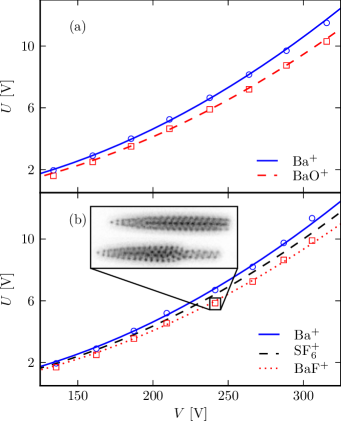
To further rule out the possibility of charge exchange between \ceBa+ and \ceSF6, we also performed a series of destructive measurements utilizing the Mathieu stability parameters and . By applying DC offset voltages to each RF electrode, a portion of the - stability boundary for heavy, sympathetically cooled \ceA+ ions can be determined by watching for a change in the crystal structure and a contraction of the crystal which appears as an overall shift of the fluorescing ions toward the center of the trap. These changes in the crystal indicate the ejection of the heavier ions thereby allowing for determination of their mass. \ceBa+ ions are first loaded into the trap, then allowed to react with \ceSF6 for several seconds until the crystal structure clearly indicates the presence of heavier sympathetically cooled ions. The RF voltage is then brought to a particular value of and DC offsets are pulsed with increasing voltage until the crystal structure changes and shifts towards the center of the trap, indicating the ejection of \ceA+ ions. This value of is recorded and the DC voltage is increased further in order to find the value of at which \ceBa+ is ejected. Overlaying these , pairs on top of the theoretical stability boundaries then gives us a more precise determination of the product mass than do AC frequency sweeps. Because the probe for measuring RF voltage is not well calibrated, the probe reading is multiplied by a scaling factor which is chosen by fitting the , pairs for \ceBa+ to its theoretical stability boundary. In order to test this method, we performed similar measurements on Coulomb crystals consisting of \ceBa+ and \ceBaO+ formed by leaking \ceO2 into the chamber. This utilizes the endothermic reaction which has been studied extensively elsewhere Murad (1982); Roth et al. (2008). The results of these measurements following both reactions \ceBa^+ + O2 and \ceBa^+ + SF6 are shown in Fig. 5. Given these results and the previously discussed energy considerations, we conclude that we are in fact producing \ceBaF+ by the reaction Eq. (3).
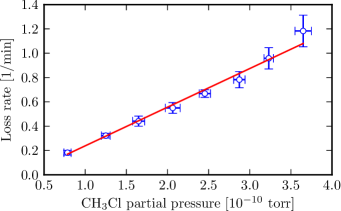
For the production of \ceBaCl+, \ceBa+ was reacted with \ceCH3Cl via the reaction
| (4) |
The rate constant was measured in the same manner as described above for reactions with \ceSF6. The results of the reaction rate measurement are shown in Fig. 6 and the associated rate constant compared with theory is listed in Table 1. As with the \ceBa+ + SF6 reaction, our measurements are in good agreement with the dipole-corrected Langevin model.
The AC frequency sweep in Fig. 4 shows that Eq. (4) is likely the dominant reaction between \ceBa+ and \ceCH3Cl. However, this data alone is not sufficient to entirely rule out some production of \ceBaH+ via the reaction
| (5) |
since the mass spectroscopic techniques here are not sufficient to resolve mass differences of 1 amu 111We were unable to locate sufficient data in the literature to estimate the reaction enthalpy for the reaction and therefore determine whether or not it would be energetically allowable. However, it is sufficiently heavier than \ceBa+ to be resolvable with AC frequency sweeps. Since no such resonances were observed, this reaction can be ruled out.. The reaction (5) is estimated to be endothermic by 2.3 eV which would preclude it from occurring with \ceBa+ in the ground state Lide (2007). However, \ceBa+ ions in the excited state are able to overcome this energy barrier such that Eq. (5) becomes exothermic by 0.2 eV. This implies that there is likely some amount of \ceBaH+ being produced. Future studies with improved mass resolution via time-of-flight mass spectrometry Schowalter et al. (2012) or high precision non-destructive techniques Drewsen et al. (2004) will be necessary to fully analyze reaction products.
BaBr+ is produced through the reaction
| (6) |
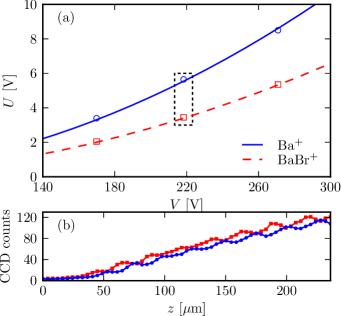
which is exothermic by about 2.2 eV. In order to get enough \ceBr2 in the vicinity of the trapped \ceBa+ ions, it was necessary to increase the leak rate considerably compared to what was required for \ceSF6 and \ceCH3Cl. This allowed other contaminants such as \ceO2, \ceCO2, and \ceH2O into the chamber simultaneously which also react with \ceBa+. However, the first two reactions are endothermic with the ground state Roth et al. (2008), and the last is barely exothermic Murad (1982). Thus by blocking the cooling beams, primarily \ceBaBr+ is produced. Measuring loss rates was not possible because of this, but it appeared to be much slower than with the other reactants. We suspect this was in part due to the liquid nature of \ceBr2 at room temperature combined with the fact that there was no direct line of sight between the leak valve and the trapped ions. Due to the slow apparent loss rate, producing enough \ceBaBr+ to obtain a good AC frequency sweep mass spectrum was not practical, so destructive measurements as in Fig. 5 were performed and are shown in Fig. 7. Because the number of product ions was very small compared to the number of \ceBa+ ions, ejection of reactants is noted by watching for a shift in the outermost ion towards the center rather than watching for a large change in crystal structure.
We also attempted to produce \ceBaI+ in a similar manner using the reaction
| (7) |
which is also exothermic by about 2.2 eV. \ceI2 is a solid at room temperature with a vapor pressure of around 300 mtorr. A sample of a few grams of \ceI2 was placed in a small reservoir evacuated to rough vacuum before being connected to the leak valve inlet. No \ceBaI+ production was observed, presumably for similar reasons as mentioned above. Future studies with a more optimal chamber geometry could allow for study of reaction (7) at room temperature.
In summary, we have demonstrated a simple method for the production of translationally cold \ceBaF+, \ceBaCl+, and \ceBaBr+ by reacting \ceBa+ ions with \ceSF6, \ceCH3Cl, and \ceBr2. Reaction rate constants between \ceBa+ and \ceSF6 and \ceCH3Cl were measured and found to be in good agreement with classical predictions within the limitations of pressure measurements. With some changes to the vacuum chamber, similar rate constant measurements could be made for the reactions of \ceBa+ with \ceI2 and \ceBr2.
Acknowledgements.
We thank Michael Schatz’s lab for the use of \ceSF6. We also gratefully acknowledge useful discussions with Richard Darst, James Goeders, and Ncamiso Khanyile. This work was supported by the National Science Foundation and the Office of Naval Research.References
- Shuman et al. (2010) E. S. Shuman, J. F. Barry, and D. DeMille, Nature 467, 820 (2010).
- Manai et al. (2012) I. Manai, R. Horchani, H. Lignier, P. Pillet, D. Comparat, A. Fioretti, and M. Allegrini, Phys. Rev. Lett. 109, 183001 (2012).
- Stuhl et al. (2012) B. K. Stuhl, M. T. Hummon, M. Yeo, G. Quéméner, J. L. Bohn, and J. Ye, Nature 492, 396 (2012).
- Hummon et al. (2013) M. T. Hummon, M. Yeo, B. K. Stuhl, A. L. Collopy, Y. Xia, and J. Ye, Phys. Rev. Lett. 110, 143001 (2013).
- Staanum et al. (2010) P. F. Staanum, K. Højbjerre, P. S. Skyt, A. K. Hansen, and M. Drewsen, Nat. Phys. 6, 271 (2010).
- Nguyen et al. (2011) J. H. V. Nguyen, C. R. Viteri, E. G. Hohenstein, C. D. Sherrill, K. R. Brown, and B. Odom, New J. Phys. 13, 063023 (2011).
- Bressel et al. (2012) U. Bressel, A. Borodin, J. Shen, M. Hansen, I. Ernsting, and S. Schiller, Phys. Rev. Lett. 108, 183003 (2012).
- Willitsch et al. (2008a) S. Willitsch, M. T. Bell, A. D. Gingell, and T. P. Softley, Phys. Chem. Chem. Phys. 10, 7200 (2008a).
- Meyer and Bohn (2008) E. R. Meyer and J. L. Bohn, Phys. Rev. A 78, 010502 (2008).
- Cossel et al. (2012) K. C. Cossel, D. N. Gresh, L. C. Sinclair, T. Coffey, L. V. Skripnikov, A. N. Petrov, N. S. Mosyagin, A. V. Titov, R. W. Field, E. R. Meyer, et al., Chem. Phys. Lett. 546, 1 (2012).
- Flambaum and Kozlov (2007) V. V. Flambaum and M. G. Kozlov, Phys. Rev. Lett. 99, 150801 (2007).
- Schuster et al. (2011) D. I. Schuster, L. S. Bishop, I. L. Chuang, D. DeMille, and R. J. Schoelkopf, Phys. Rev. A 83, 012311 (2011).
- Hudson (2009) E. R. Hudson, Phys. Rev. A 79, 032716 (2009).
- Rellergert et al. (2013) W. G. Rellergert, S. T. Sullivan, S. J. Schowalter, S. Kotochigova, K. Chen, and E. R. Hudson, Nature 495, 490 (2013).
- Chen et al. (2011) K. Chen, S. J. Schowalter, S. Kotochigova, A. Petrov, W. G. Rellergert, S. T. Sullivan, and E. R. Hudson, Phys. Rev. A 83, 030501 (2011).
- Schowalter et al. (2012) S. J. Schowalter, K. Chen, W. G. Rellergert, S. T. Sullivan, and E. R. Hudson, Rev. Sci. Instrum. 83, 043103 (2012).
- Harvey et al. (1997) J. N. Harvey, D. Schröder, W. Koch, D. Danovich, S. Shaik, and H. Schwarz, Chem. Phys. Lett. 273, 164 (1997).
- Willitsch et al. (2008b) S. Willitsch, M. T. Bell, A. D. Gingell, S. R. Procter, and T. P. Softley, Phys. Rev. Lett. 100, 043203 (2008b).
- Gingell et al. (2010) A. D. Gingell, M. T. Bell, J. M. Oldham, T. P. Softley, and J. N. Harvey, J. Chem. Phys. 133, 194302 (2010).
- Churchill et al. (2011) L. R. Churchill, M. V. DePalatis, and M. S. Chapman, Phys. Rev. A 83, 012710 (2011).
- Rohde et al. (2010) F. Rohde, M. Almendros, C. Schuck, J. Huwer, M. Hennrich, and J. Eschner, J. Phys. B: At., Mol. Opt. Phys. 43, 115401 (2010).
- Lide (2007) D. R. Lide, CRC Handbook of Chemistry and Physics (CRC Press, Boca Raton, FL, 2007), 88th ed.
- Gioumousis and Stevenson (1958) G. Gioumousis and D. P. Stevenson, J. Chem. Phys. 29, 294 (1958).
- Troe (1985) J. Troe, Chem. Phys. Lett. 122, 425 (1985).
- Su and Bowers (1973) T. Su and M. T. Bowers, J. Chem. Phys 58, 3027 (1973).
- Var (2004) UHV-24/UHV-24p Ionization Gauge Instruction Manual, Agilent Technologies, Rev. E ed. (2004).
- Karpas and Berant (1989) Z. Karpas and Z. Berant, J. Phys. Chem. 93, 3021 (1989).
- Olney et al. (1997) T. N. Olney, N. Cann, G. Cooper, and C. Brion, Chem. Phys. 223, 59 (1997).
- Maroulis et al. (1997) G. Maroulis, C. Makris, U. Hohm, and D. Goebel, J. Phys. Chem. A 101, 953 (1997).
- Maroulis and Makris (1997) G. Maroulis and C. Makris, Mol. Phys. 91, 333 (1997).
- R. D. Johnson, ed. (2011) R. D. Johnson, ed., NIST computational chemistry comparison and benchmark database (2011), release 15b, URL http://cccbdb.nist.gov/.
- Roth et al. (2005) B. Roth, A. Ostendorf, H. Wenz, and S. Schiller, J. Phys. B: At., Mol. Opt. Phys. 38, 3673 (2005).
- Roth et al. (2007) B. Roth, P. Blythe, and S. Schiller, Phys. Rev. A 75, 023402 (2007).
- Landa et al. (2012) H. Landa, M. Drewsen, B. Reznik, and A. Retzker, New J. Phys. 14, 093023 (2012).
- Baba and Waki (2002) T. Baba and I. Waki, J. Appl. Phys. 92, 4109 (2002).
- Lias (2011) S. G. Lias, in NIST Chemistry WebBook, edited by P. J. Linstrom and W. G. Mallard (National Institute of Standards and Technology, Gaithersburg MD, 20899, 2011), URL http://webbook.nist.gov.
- Karlsson and Litzén (1999) H. Karlsson and U. Litzén, Phys. Scr. 60, 321 (1999).
- Tachikawa (2000) H. Tachikawa, J. Phys. B: At., Mol. Opt. Phys. 33, 1725 (2000).
- Murad (1982) E. Murad, J. Chem. Phys. 77, 2057 (1982).
- Roth et al. (2008) B. Roth, D. Offenberg, C. B. Zhang, and S. Schiller, Phys. Rev. A 78, 042709 (2008).
- Drewsen et al. (2004) M. Drewsen, A. Mortensen, R. Martinussen, P. Staanum, and J. L. Sørensen, Phys. Rev. Lett. 93, 243201 (2004).