Aging of CKN: Modulus versus conductivity analysis
Abstract
It was recently reported that the electrical modulus peaks narrows upon annealing of the ionic system CKN [Paluch et al., Phys. Rev. Lett. 110, 015702 (2013)], which was interpreted as providing evidence of dynamic heterogeneity of this glass-forming liquid. An analysis of the same data in terms of the ac conductivity shows no shape changes, however. We discuss the relation between both findings and show further that the ac conductivity conforms to the prediction of the random barrier model (RBM) at all times during the annealing.
Ionic conduction in glasses and other disordered solids is a subject of growing interest due to applications in connection with solid-oxide fuel cells, electrochemical sensors, thin-film solid electrolytes in batteries and supercapacitors, electrochromic windows, oxygen-separation membranes, functional polymers, etc. At the same time ion conduction in disordered solids remains an area of basic research because a number of fundamental questions are still not settled Ingram (1987); Angell (1990); Maier (1995); Dyre et al. (2008).
In a recent Letter Paluch, Wojnarowska, and Hensel-Bielowka Paluch et al. (2013) presented data for (physical) aging of the ionic glass (CKN), for which the glass transition temperature is 335 K. Liquid CKN is an ionic glass former with a significant decoupling of the ionic motion from the structural relaxation, implying much faster ionic motion than estimated from the liquid’s viscosity via the Stokes-Einstein relation Pimenov et al. (1996). In other words, the conductivity relaxation time of liquid CKN is much shorter than the Maxwell relaxation time. This is in contrast to the recently intensely studied room temperature ionic liquids, for which anions and cations are of roughly the same size and, consequently, little or no decoupling is observed Sangoro et al. (2009, 2011).
The decoupling of ionic motion from the structural relaxation in CKN makes it simple to monitor aging by measuring the frequency-dependent conductivity. For most glass-forming liquids the alpha dielectric loss peak is closely linked to the structural relaxation Jakobsen et al. (2012), making it impossible to measure the entire alpha dielectric relaxation process under constant conditions in the glass phase because the sample changes its properties due to physical aging. Actually, aging has been studied by ac methods even for such glasses – either by monitoring the dielectric loss at much higher frequencies than the alpha loss-peak frequency Johari (1982); Alegria et al. (1995); Leheny and Nagel (1998); Cangialosi et al. (2005); Lunkenheimer et al. (2005); Hecksher et al. (2010) or by monitoring the beta process Johari (1982); Dyre and Olsen (2003) – but studying aging of CKN by ac methods is conceptually much simpler.
Recall that if is the angular frequency and the frequency-dependent complex conductivity, the complex electrical modulus is defined Macedo et al. (1972) by
| (1) |
Based on the observed narrowing of the loss modulus for CKN (compare Fig. 1(b)) and other ionic glasses the authors of Ref. Paluch et al., 2013 concluded that “… the changes in the conductivity relaxation process observed during isothermal aging … provide strong experimental evidence of the heterogeneous nature of deeply supercooled liquids.”
Some time ago there was an engaged debate in the literature about which method of data representation – modulus or conductivity – yields most insight into the physics of ionic conductors Almond and West (1983); Dyre (1991); Elliott (1994); Roling (1998); Ngai and Rendell (2000); Sidebottom et al. (2000). Below we present an analysis of the CKN data of Ref. Paluch et al., 2013 from the conductivity viewpoint and argue that no conclusion can be drawn about the absence or presence of dynamic heterogeneities. We show further that the data conform to the prediction of the random barrier model (RBM), a simple effectively zero-parameter model of ionic motion in highly disordered structures.
The CKN sample of Ref. Paluch et al., 2013 was first annealed at 353 K for 10 minutes, i.e., much above the glass transition temperature (335 K), and then quenched to 308 K at a rate of 10-15 K/min. Hereafter temperature was kept constant and was measured over the frequency range Hz every 15 minutes. Figure 1(a) shows a log-log plot of two sets of data for , one set obtained two hours after the glass was produced (red) and one set obtained 22 hours after (blue). Figure 1(b) shows the same data scaled to make the two maxima coincide. Though the effect is not large, annealing clearly leads to a narrowing of the modulus peak Roling (1998); Howell et al. (1974). If the peak is decomposed mathematically as a sum of Debye peaks, the corresponding relaxation time distribution narrows upon annealing.
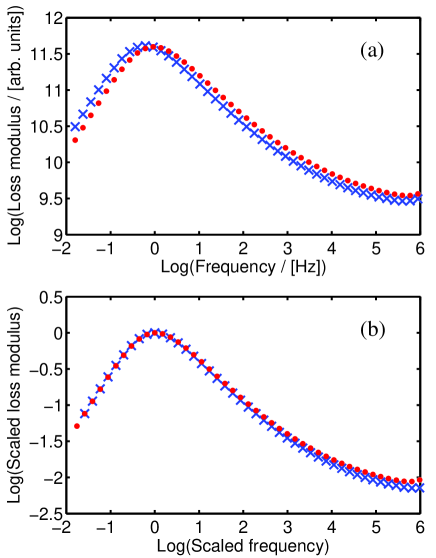
Figure 2 shows the conductivity analysis of the same data. In Fig. 2(a) we plot the real part of the conductivity as a function of frequency in a log-log plot. Upon annealing the conductivity decreases at all frequencies. One possible explanation could be that the density increases upon annealing, making it more difficult for the ions to move; however, we do not wish to speculate here about what is the physical mechanism behind the conductivity decrease Roling (1998). Figure 2(b) shows the same data relative to the dc conductivity plotted as a function of frequency scaled empirically to obtain the best overlap between the two curves. No shape change is observed. Such behavior is often observed in physical aging experiments, where it is referred to as time aging-time superposition Struik (1978); O’Connell and B.McKenna (1999); Hecksher et al. (2010). If interpreted in terms of a relaxation time distribution, time aging-time superposition implies that the distribution does not narrow upon annealing. How is one to understand this, given that the modulus relaxation time distribution does narrow?
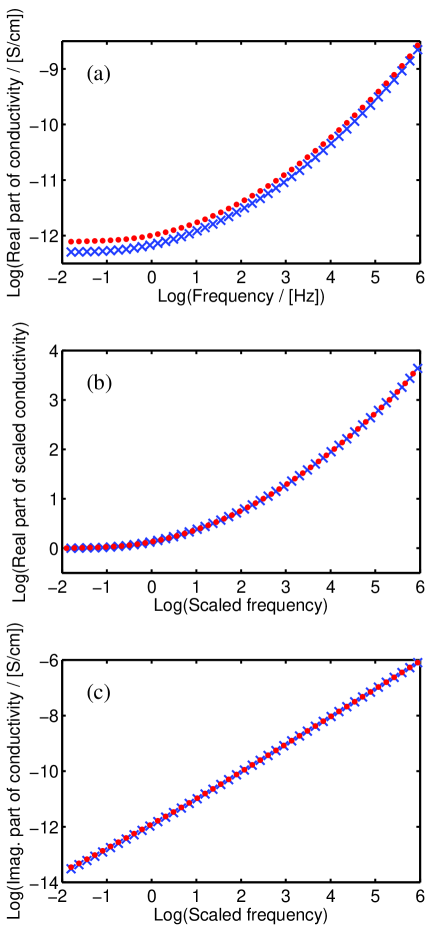
A clue is provided by the imaginary part of the ac conductivity plotted in Fig. 2(c). Note that 1) there is virtually no change upon annealing; 2) the imaginary part of is almost proportional to frequency; 3) at most frequencies the imaginary part is much larger than the real part. These observations show that the imaginary part of the ac conductivity over most of the frequency range monitored is dominated by the charge displacements coming from the instantaneous electronic polarization, which is quantified by the high-frequency dielectric constant . The electronic polarization is independent of the ion motion monitored by the real part of the conductivity. Because the conductivity appears in the denominator in Eq. (1), however, ion motion and polarization both influence . In fact, if is constant during annealing and the real part of conductivity decreases – as observed – the mathematics implies that the modulus peak must narrow Dyre (1991); Sidebottom et al. (2000).
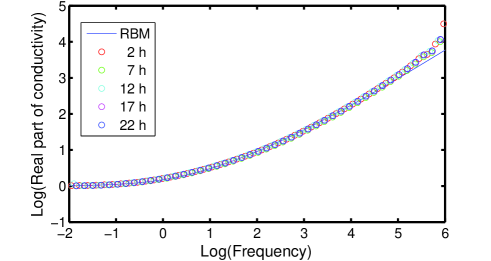
Figure 3 shows data for the real part of the scaled ac conductivity taken at five different times during the annealing at 308 K; the frequencies have been scaled empirically for best overlap in order to investigate whether or not the shape changes. The full curve is the prediction of the random barrier model (RBM) Dyre (1988); Schrøder and Dyre (2000), a simple model for ac conduction in disordered solids based on the following assumptions: 1) All ion-ion interactions including self-exclusion are ignored; 2) the ion sites have the same energy; 3) the ions move on a simple cubic lattice where only nearest-neighbor jumps are allowed; 4) the jump rates are determined by energy barriers that vary randomly and spatically uncorrelated. In the extreme disorder limit, i.e., when the width of the energy barrier distribution is much larger than , the scaled ac conductivity is independent of the barrier distribution Schrøder and Dyre (2000) – in this limit both dc and ac conduction are dominated by percolation Schrøder and Dyre (2008). In the extreme disorder limit the RBM is to a very good approximation described by the following equation for
| (2) |
In the derivation of this equation Schrøder and Dyre (2008) the number appears because it is half the exponent of the Alexander-Orbach conjecture Alexander and Orbach (1982) for the spectral dimension of the percolation cluster, a conjecture that is known to be almost correct in any number of dimensions Nakayama et al. (1994); Hughes (1996). Only at low frequencies where the conductivity is almost constant does Eq. (2) become inaccurate in describing the difference of the RBM; in this frequency range a more accurate approximate analytical expression for the ac conductivity is available Schrøder and Dyre (2008).
In summary, we have shown that a conductivity-based analysis of data for the ionic glass former CKN annealed below the glass transition temperature reveals no shape changes, i.e., the conductivity obeys time aging-time superposition. As time progresses the entire real part of the conductivity is displaced to lower values. This may reflect the sample compactifying slightly, but may also derive from a change in the effective number of mobile ions Dyre et al. (2008); Roling (1998). In any case, from the conductivity viewpoint the data do not support the interpretation of Ref. Paluch et al., 2013, according to which the measurements confirm “the existence of slow and fast subensembles in the glassy state [which] should also result in distinct aging rates for these different regions in the system.” In fact, the RBM fits data well at all times during the annealing, which shows that there is no need to invoke changes in the degree of static or dynamic heterogenities. – We do not wish suggest that viscous liquids and glasses are dynamically homogeneous Böhmer et al. (1996); Kob et al. (1997); Ediger (2000); Vollmayr-Lee et al. (2002); Berthier and Biroli (2011); Berthier et al. (2011). It seems difficult to imagine a realistic model of a disordered system with energy barriers that are large compared to without some sort of dynamic heterogeneity; for instance the RBM is a model for which spatial inhomogeneities are crucially important. The fundamental question is not whether dynamic heterogeneities exist, but whether these cause the observed physics or are an effect of the disorder, which is particularly pronounced for ultraviscous liquids and glasses.
Acknowledgements.
The author is indebted to Marian Paluch for making available the CKN data and to Tina Hecksher for technical assistance. The center for viscous liquid dynamics “Glass and Time” is sponsored by the Danish National Research Foundation via grant DNRF61.References
- Ingram (1987) M. D. Ingram, Phys. Chem. Glasses 28, 215 (1987).
- Angell (1990) C. A. Angell, Chem. Rev. 90, 523 (1990).
- Maier (1995) J. Maier, Prog. Solid State Chem. 23, 171 (1995).
- Dyre et al. (2008) J. C. Dyre, P. Maass, B. Roling, and D. L. Sidebottom, Rep. Prog. Phys. 72, 046501 (2008).
- Paluch et al. (2013) M. Paluch, Z. Wojnarowska, and S. Hensel-Bielowka, Phys. Rev. Lett. 110, 015702 (2013).
- Pimenov et al. (1996) A. Pimenov, P. Lunkenheimer, H. Rall, R. Kohlhaas, A. Loidl, and R. Böhmer, Phys. Rev. E 54, 676 (1996).
- Sangoro et al. (2009) J. R. Sangoro, C. Iacob, A. Serghei, C. Friedrich, and F. Kremer, Phys. Chem. Chem. Phys. 11, 913 (2009).
- Sangoro et al. (2011) J. R. Sangoro, C. Iacob, S. Naumov, R. Valiullin, H. Rexhausen, J. Hunger, R. Buchner, V. Strehmel, J. Kärger, and F. Kremer, Soft Matter 7, 1678 (2011).
- Jakobsen et al. (2012) B. Jakobsen, T. Hecksher, T. Christensen, N. B. Olsen, J. C. Dyre, and K. Niss, J. Chem. Phys. 136, 081102 (2012).
- Johari (1982) G. P. Johari, J. Chem. Phys. 77, 4619 (1982).
- Alegria et al. (1995) A. Alegria, E. Guerrica-Echevarria, L. Goitiandia, I. Telleria, and J. Colmenero, Macromolecules 28, 1516 (1995).
- Leheny and Nagel (1998) R. L. Leheny and S. R. Nagel, Phys. Rev. B 57, 5154 (1998).
- Cangialosi et al. (2005) D. Cangialosi, M. Wübbenhorst, J. Groenewold, E. Mendes, and S. J. Picken, J. Non-Cryst. Solids 351, 2605 (2005).
- Lunkenheimer et al. (2005) P. Lunkenheimer, R. Wehn, U. Schneider, and A. Loidl, Phys. Rev. Lett. 95, 055702 (2005).
- Hecksher et al. (2010) T. Hecksher, N. B. Olsen, K. Niss, and J. C. Dyre, J. Chem. Phys. 133, 174514 (2010).
- Dyre and Olsen (2003) J. C. Dyre and N. B. Olsen, Phys. Rev. Lett. 91, 155703 (2003).
- Macedo et al. (1972) P. B. Macedo, C. T. Moynihan, and R. Bose, Phys. Chem. Glasses 13, 171 (1972).
- Almond and West (1983) D. P. Almond and A. R. West, Solid State lon. 11, 57 (1983).
- Dyre (1991) J. C. Dyre, J. Non-Cryst. Solids 135, 219 (1991).
- Elliott (1994) S. R. Elliott, J. Non-Cryst. Solids 170, 97 (1994).
- Roling (1998) B. Roling, Solid State Ion. 105, 185 (1998).
- Ngai and Rendell (2000) K. L. Ngai and R. W. Rendell, Phys. Rev. B 61, 9393 (2000).
- Sidebottom et al. (2000) D. L. Sidebottom, B. Roling, and K. Funke, Phys. Rev. B 63, 024301 (2000).
- Howell et al. (1974) F. S. Howell, R. A. Bose, P. B. Macedo, and C. T. Moynihan, J. Phys. Chem. 78, 639 (1974).
- Struik (1978) L. C. E. Struik, Physical Aging in Amorphous Polymers and Other Materials (Elsevier, Amsterdam, 1978).
- O’Connell and B.McKenna (1999) P. A. O’Connell and G. B.McKenna, J. Chem. Phys. 110, 11054 (1999).
- Dyre (1988) J. C. Dyre, J. Appl. Phys. 64, 2456 (1988).
- Schrøder and Dyre (2000) T. B. Schrøder and J. C. Dyre, Rev. Mod. Phys. 72, 873 (2000).
- Schrøder and Dyre (2008) T. B. Schrøder and J. C. Dyre, Phys. Rev. Lett. 101, 025901 (2008).
- Alexander and Orbach (1982) S. Alexander and R. Orbach, J. Phys. (Paris) Lett. 43, 625 (1982).
- Nakayama et al. (1994) T. Nakayama, K. Yakubo, and R. L. Orbach, Rev. Mod. Phys. 66, 381 (1994).
- Hughes (1996) B. D. Hughes, Random Walks and Random Environments (Clarendon, Oxford, 1996).
- Böhmer et al. (1996) R. Böhmer, G. Hinze, G. Diezemann, B. Geil, and H. Sillescu, EPL 36, 55 (1996).
- Kob et al. (1997) W. Kob, C. Donati, S. J. Plimpton, P. H. Poole, and S. C. Glotzer, Phys. Rev. Lett. 79, 2827 (1997).
- Ediger (2000) M. D. Ediger, Ann. Rev. Phys. Chem. 51, 99 (2000).
- Vollmayr-Lee et al. (2002) K. Vollmayr-Lee, W. Kob, K. Binder, and A. Zippelius, J. Chem. Phys. 116, 5158 (2002).
- Berthier and Biroli (2011) L. Berthier and G. Biroli, Rev. Mod. Phys. 83, 587 (2011).
- Berthier et al. (2011) L. Berthier, G. Biroli, J.-P. Bouchaud, L. Cipelletti, and W. van Saarloos, eds., Dynamical Heterogeneities in Glasses, Colloids, and Granular Media. (Oxford Univ. Press, 2011).