Nova KT Eri 2009: Infrared studies of a very fast and small amplitude He/N nova.
Abstract
We present near-infrared spectroscopic and photometric observations of the nova KT Eridani taken during the first 100 days following its discovery in 2009 November. The spectra of the object have been taken from the Mount Abu Infrared Observatory using the Near-Infrared Imager/Spectrometer. The spectra, typical of the He/N class novae, show strong He i emission lines together with H i and O i emission features. The H i, Pa and Br spectral lines and the He i line at 2.0581 m show broad wings with a relatively narrow central component. The broad wings extend to 1900 km s-1 while the central component has FWHM of 2100 km s-1. The and near-infrared light curves show an additional small amplitude outburst near 40 days after optical maximum. The distance to the nova 0.1 kpc is derived using the MMRD relation and the estimated value of t2 = 5.7 0.3 days. The small value of t2 places KT Eri in the class of very fast novae. Using the value of the distance to the nova , we estimate the height of the nova to be 0.1 kpc below the galactic plane. We have also calculated the upper limit for the ejecta mass for KT Eri to be in the range 2.4 - 7.4 10-5M⊙. Kinematic evidence is presented from the shape of the line profiles for a possible bipolar flow. We analyze the temporal evolution of the continuum and also discuss the possibility of KT Eri being a recurrent nova.
keywords:
infrared: spectra - line : identification - stars : novae, cataclysmic variables - stars : individual (KT Eri) - techniques : spectroscopic1 Introduction
Nova KT Eridani has an interesting history pre-dating its optical discovery. Its discovery was reported several days after its actual outburst had commenced but in spite of this delay, recourse to archival material helped not only in pinpointing its exact date of eruption but also tracked its immediate post-outburst evolution as graphically as real-time nova observations usually do. The nova was discovered on 2009 November 25.536 UT by K. Itagaki at = 8.1 (Yamaoka & Itagaki 2009) with a 0.21m telescope patrol system. Itagaki also noted the presence of a faint object near the position of KT Eri in his archival patrol images. Yamaoka pointed out that the All Sky Automated Survey (ASAS-3) system (Pojmanski 1997) had detected KT Eri on 3 occasions prior to the discovery announcement of Yamaoka. These pre-discovery magnitudes along with additional detections are listed in Table 1. In addition Yamaoka suggested that the discovery of KT Eri might be the result of brightening of a 15th magnitude blue star, listed in many catalogues, with one of the identifications being USNO-B1.0 0798-0048707. Guido et al. (2009) confirmed the discovery of KT Eri using their CCD observations using a 0.25m reflector and pointed out the presence of a star of 15 mag close to the position of KT Eri on the DSS red plate of 1990 November 23 UT. The nature of KT Eri as a nova was confirmed by several low resolution optical spectra obtained during 2009 November 26.5 - 26.6 UT by Fujii, Arai & Isogai and Imamura (Maehara 2009). These spectra showed broad Balmer emission (FWHM of H 3200 - 3400 km s-1) together with prominent emission features of He I, N I, N II, Na I D, O I and Mg II leading Maehara to suggest that KT Eri is a nova of the He/N class.
Rudy et al. (2009) also suggested KT Eri to be a nova of He/N class on the basis of their near-infrared spectra obtained on 2009 November 26.4 UT spanning the spectral range of 0.9 to 2.5 m. The He I line at 1.083 m was already the strongest line in the spectrum with a P Cygni absorption extending to 3600 km s-1. The emission lines of H I, N I and O I were very strong and broad with FWHM 4000 km s-1. The reports of clear detection of KT Eri prior to its discovery has resulted in additional studies by different groups to obtain its pre-discovery light curves. Drake et al. (2009) carried out a search of the Catalina Sky Survey data covering the location of KT Eri during period 2005 January 17 to 2009 November 18. KT Eri was clearly seen in outburst in the images taken on 2009 November 18 and they pointed out that the outburst occurred after 2009 November 10.41 UT. The study of pre-discovery light curve has shown clear variations of approximately 1.8 magnitudes. The association of an unresolved fainter companion to the 15th magnitude star to be the progenitor of KT Eri would mean a very high level of variability. As this possibility is unlikely Drake et al. (2009) conclude that the 15th magnitude star is most likely associated with KT Eri.
Ragan et al. (2009) derived a distance of 6.5 kpc to KT Eri and pointed out that the 15th magnitude star located close to the KT Eri position in pre-discovery images is too bright to be its progenitor. McQuillin et al. (2012) and Hounsell et al. (2010) have obtained an impressive high cadence optical light curve of KT Eri before, during and after the outburst using data from SuperWASP (Pollacco et al. 2006) and the USAF/NASA Solar Mass Ejection Imager (SMEI) (Jackson et al. 2005) on board the Coriolis Satellite (Eyles 2003), respectively. The SMEI observations are spread over the period 2009 November 1.13 to 30.62 UT. The light curve, obtained by SMEI indicates that the initial rise of the nova is steep (rising 4.1 magnitudes over 2.7 days) with evidence of a pre-maximum halt occurring on 2009 November 13.90 0.04 UT at mSMEI 6. The duration of this halt would seem to be only a few hours, which is appropriate for the speed of the nova (e.g. Payne-Gaposchkin 1964). The nova reached maximum light on 2009 November 14.67 0.04 UT with an unfiltered SMEI apparent magnitude of mSMEI 5.42 0.02. It subsequently declined rapidly with a value of 6.6 days confirming KT Eri as a very fast nova. The SMEI observations are consistent with the observed high expansion velocities (FWHM 3400 km s-1) and assignment of He/N spectral class to KT Eri described earlier.
Nesci, Mickaelian & Rossi (2009) have used the pre-outburst spectrum of the suspected 15th magnitude progenitor available in the Digitized First Byurakan Survey of the field containing KT Eri to study its nature. The spectra taken on 1971 January 25 shows a strong UV continuum with several emission lines that include [Ne V] 3426, [Ne III] 3868 and a large blend around H. As these features are typical of cataclysmic variables, Nesci, Mickaelian & Rossi (2009) favour the identification of the 15th magnitude star with the actual progenitor of KT Eri and point out that the forbidden lines of [Ne III] & [Ne V] were also seen in the transient source CSS 081007: 030559+054715 (HV Cet) suggested to be a possible He/N nova located at high galactic latitude -43.7 deg (Prieto et al. 2008, Pejcha, Prieto & Denney 2008). A search for previous outbursts of KT Eri was done by Jurdana-Sepic et al. (2012) using the Harvard College Observatory archive plates spanning the period 1888 to 1962. As no earlier outbursts were found, they have suggested that if KT Eri is a recurrent nova, the recurrence time is likely to be on a time scale of centuries. Jurdana-Sepic et al. (2012) find a periodicity at quiescence of 737 days for the 15th magnitude progenitor that may arise from reflection effects and/or eclipses in the underlying binary system in KT Eri. KT Eri was detected later as a luminous soft X-ray source (Bode et al. 2010, Ness et al. 2010, Beardmore et al. 2010) and also detected at radio wavelengths (O’Brien et al. 2010).
| Date in UT | Magnitude | Observers | |
|---|---|---|---|
| 2009 November | |||
| 10.236 | 14.0 | ASAS | |
| 14.572 | 5.7 | Ootsuki | |
| 14.632 | 5.4 | Watanabe & Miyasaita | |
| 14.813 | 5.6 | Ootsuki & Ohshima | |
| 17.226 | 6.9 | Hankey | |
| 17.758 | 6.7 | Tanaka | |
| 17.807 | 6.6 | Kawamura | |
| 18.760 | 7.0 | Yamamoto | |
| 18.809 | 7.0 | Yamamoto | |
| 19.241 | 7.34 | ASAS | |
| 22.179 | 7.98 | ASAS | |
| 24.269 | 8.12 | ASAS |
2 Observations
Near-IR observations were obtained using the the 1.2m telescope of Mt. Abu Infrared Observatory from 2009 November 28 to 2010 March 3. The log of the spectroscopic and photometric observations is given in Table 2. The spectra were obtained at a resolution of 1000 using a Near-Infrared Imager/Spectrometer with a 256 256 HgCdTe NICMOS3 array. In each of the bands a set of spectra was taken with the nova off-set to two different positions along the slit which were subtracted from each other to remove sky and detector dark current contributions. Spectral calibration was done using the OH sky lines that register with the stellar spectra. The spectra of the comparison star SAO 131794 (spectral type A3 III; effective temperature 8600 K) were taken at similar airmass as that of KT Eri to ensure that the ratioing process (nova spectrum divided by the standard star spectrum) removes the telluric features reliably. To avoid artificially generated emission lines in the ratioed spectrum, the H I absorption lines in the spectra of standard star were removed before ratioing. The ratioed spectra were then multiplied by a blackbody curve corresponding to the standard star’s effective temperature to yield the final spectra.
| Date of | Days since | Integration time (s) | Integration time (s) | Nova Magnitude | ||||||
|---|---|---|---|---|---|---|---|---|---|---|
| Observation (UT) | optical maximum | J-band | H-band | K-band | J-band | H-band | K-band | J-band | H-band | K-band |
| Spectroscopic Observations | Photometric Observations | |||||||||
| 2009 Nov. 28.854 | 14.184 | 90 | 90 | 90 | 25 | 55 | 105 | 7.390.03 | 7.450.03 | 7.040.04 |
| 2009 Dec. 01.813 | 17.143 | 120 | 90 | 120 | 25 | 55 | 105 | 7.890.03 | 7.910.04 | 7.370.06 |
| 2009 Dec. 03.844 | 19.174 | – | – | – | 75 | 165 | 105 | 7.880.06 | 7.790.04 | 7.350.04 |
| 2009 Dec. 04.834 | 20.164 | 120 | 120 | 120 | – | – | – | – | – | – |
| 2009 Dec. 05.844 | 21.174 | 120 | 90 | 120 | 75 | 110 | 105 | 8.210.08 | 8.080.04 | 7.690.05 |
| 2009 Dec. 06.813 | 22.143 | 90 | 90 | 120 | – | – | – | – | – | – |
| 2009 Dec. 07.865 | 23.195 | 90 | 90 | 120 | 75 | 110 | 105 | 8.360.01 | 8.390.02 | 7.950.06 |
| 2009 Dec. 08.834 | 24.164 | 120 | 90 | 120 | – | – | – | – | – | – |
| 2009 Dec. 09.823 | 25.153 | 120 | 90 | 120 | 75 | 110 | 105 | 8.390.05 | 8.420.07 | 8.020.06 |
| 2009 Dec. 15.776 | 31.106 | 120 | 90 | 120 | 75 | 110 | 105 | 8.800.03 | 8.820.10 | 8.350.02 |
| 2009 Dec. 16.782 | 32.112 | 120 | 90 | 120 | – | – | – | – | – | – |
| 2009 Dec. 17.786 | 33.116 | – | – | – | 100 | 110 | 105 | 9.060.06 | 8.940.04 | 8.550.07 |
| 2009 Dec. 27.779 | 43.109 | – | – | – | 100 | 220 | 105 | 9.440.05 | 9.340.05 | 9.020.13 |
| 2009 Dec. 29.767 | 45.097 | – | – | – | 125 | 220 | 105 | 9.530.14 | 9.360.03 | 8.930.12 |
| 2009 Dec. 31.757 | 47.087 | – | – | – | 100 | 165 | 105 | 9.300.06 | 9.190.04 | 8.850.09 |
| 2010 Jan. 03.750 | 50.080 | – | – | – | 250 | 550 | 105 | 9.300.05 | 9.910.04 | 8.670.07 |
| 2010 Jan. 25.755 | 72.085 | – | – | – | 500 | 825 | 105 | 10.580.06 | 10.410.05 | 9.500.04 |
| 2010 Jan. 27.744 | 74.074 | – | – | – | 750 | 1100 | 105 | 10.650.02 | 10.510.03 | 9.510.10 |
| 2010 Feb. 28.735 | 106.065 | – | – | – | 600 | 660 | 63 | 11.230.08 | 11.010.08 | 9.990.10 |
| 2010 Mar. 01.725 | 106.790 | – | – | – | 600 | 660 | 63 | 11.260.04 | 11.050.10 | 9.890.10 |
| 2010 Mar. 03.734 | 108.799 | – | – | – | – | 825 | 63 | – | 11.050.10 | 9.890.10 |
Photometry in the bands was done in clear sky conditions using the NICMOS3 array in the imaging mode. Several frames, in 4 dithered positions, offset by 30 arcsec were obtained in all the bands. The sky frames, which are subtracted from the nova frames, were generated by median combining the dithered frames. The star SAO 131500 (spectral type A0, effective temperature 9800K), located close to the nova and having 2MASS magnitudes 7.35, 7.41 and 7.40, respectively, was used for photometric calibration. Further details of the data reduction are described in Banerjee & Ashok (2002). The data were reduced and analyzed using .
| Wavelength | Species | |
|---|---|---|
| (m) | ||
| 1.0830 | He i | |
| 1.0938 | Pa | |
| 1.1287 | O i | |
| 1.2818 | Pa | |
| 1.5256 | Br 19 | |
| 1.5341 | Br 18 | |
| 1.5439 | Br 17 | |
| 1.5557 | Br 16 | |
| 1.5701 | Br 15 | |
| 1.5881 | Br 14 | |
| 1.6109 | Br 13 | |
| 1.6407 | Br 12 | |
| 1.6806 | Br 11 | |
| 1.7002 | He i | |
| 1.7362 | Br 10 | |
| 1.9451 | Br 8 | |
| 2.0581 | He i | |
| 2.1120,2.1132 | He i | |
| 2.1656 | Br |
3 Results
Before presenting the results proper, we estimate some of the useful parameters of KT Eri like its reddening, distance and height relative to the galactic plane from an analysis of its light curve.
3.1 General characteristics of and light curves
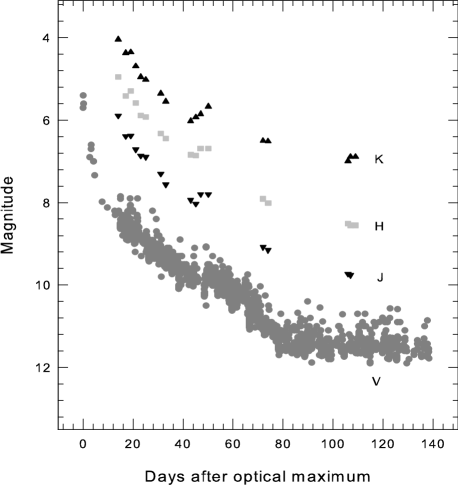
The light curves based on the band data from Table 1 and American Association of Variable Star Observers (AAVSO) and the magnitudes from Mt. Abu are presented in Fig. 1. The AAVSO data span the period 2009 November 27 to 2010 March 20. The pre-discovery observations presented in Table 1 from Yamaoka et al. (2009) are also used for the optical light curve. The epoch of optical maximum for KT Eri is taken as 2009 November 14.67 UT when it reached a value of = 5.4. This corrosponds to the value of 2009 November 14.67 0.04 UT obtained by Hounsell et al. (2010) using the SMEI data.
From a least square regression fit to the post maximum light curve we estimate and to be 5.7 0.3 d and 9 0.3, respectively, making KT Eri one of the fast He/N class of novae in recent years. Using the maximum magnitude versus rate of decline (MMRD) relation of della Valle & Livio (1995), we determine the absolute magnitude of the nova to be MV = -8.9 0.1. The reddening = 0.09, is derived from Schlegel et al. (1998) towards the nova’s direction for which AV = 0.29 for R = 3.1. Based on the above we obtain a value of the distance = 6.3 0.1 kpc to the nova. Using the value of we estimated the height = 3.3 0.1 kpc below the galactic plane. The high galactic latitude is consistent with the low reddening towards the nova. Taking a bolometric correction of -0.1 appropriate for the SED of novae which resemble A to F type supergiants near maximum light and the absolute magnitude MV = -8.9 determined above gives the the bolometric outburst luminosity of KT Eri to be LO 3.2 105 L⊙.
The optical and light curves show an additional small amplitude outburst near day 40 from the optical maximum. A plateau was also seen in the band light curve after 80 days from optical maximum. The duration of the plateau could be tracked for 60 days but its entire duration is difficult to assess as the nova went into conjunction with the Sun afterwards. The shape of the optical light curve of KT Eri presented in Fig. 1 has all the characteristics of a P class of nova as per the classification system presented by Strope, Schaefer & Henden (2010).
The observed value of the outburst amplitude of = 9.6 and = 5.7 days for KT Eri is well below the lower limit in the amplitude versus decline rate plot for classical novae presented by Warner (2008) which shows an expected value of = 12 to 15 for = 5.7 days. It is also interesting to note that the estimated value of , and are very much similar to those of the recurrent nova V745 Sco which had corresponding values of 6.2, 9.0 and 9.2, respectively (see Table 17, Schaefer 2010). So, if KT Eri is indeed a recurrent nova, then the system may be similar to V745 Sco and a possibility exists that the recurrence time for KT Eri may be expected to be around 50 years similar to the 52yr recurrence time for V745 Sco which had recorded outbursts in 1937 and 1989 (Schaefer 2010).
3.2 Line identification, evolution and general characteristics of the spectra
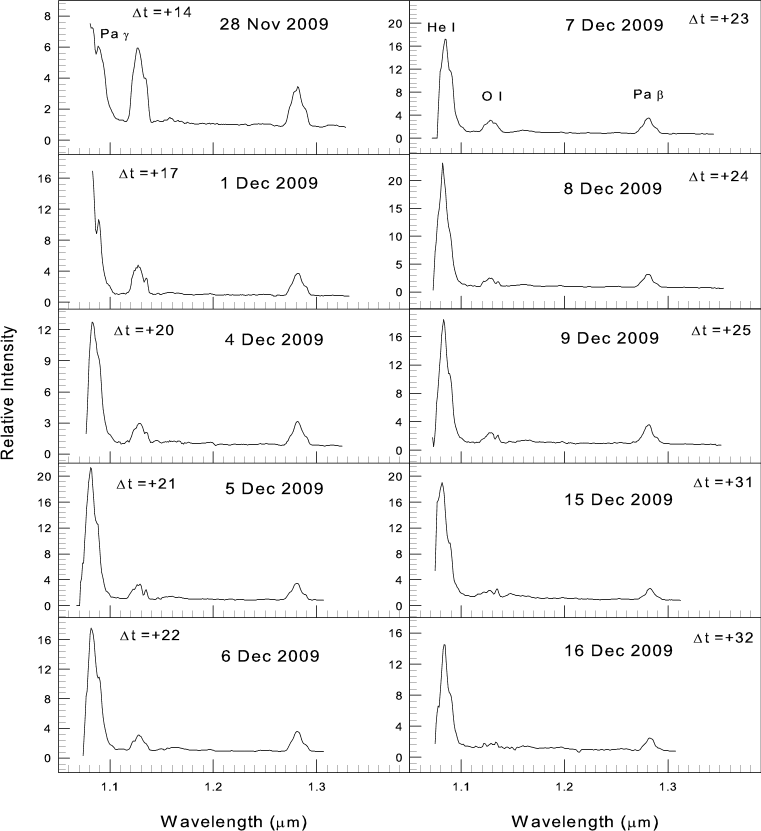
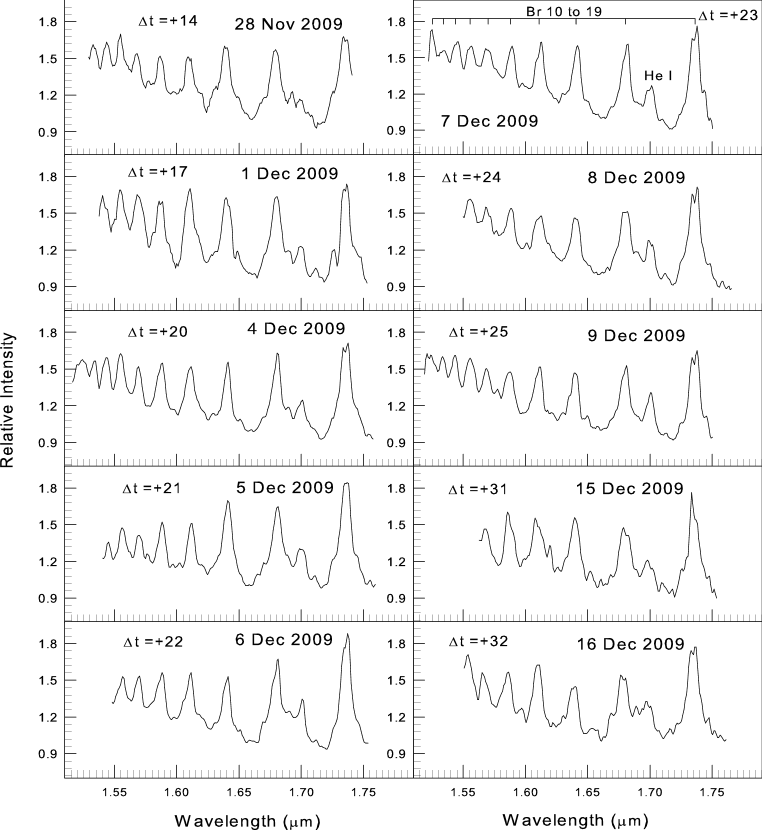
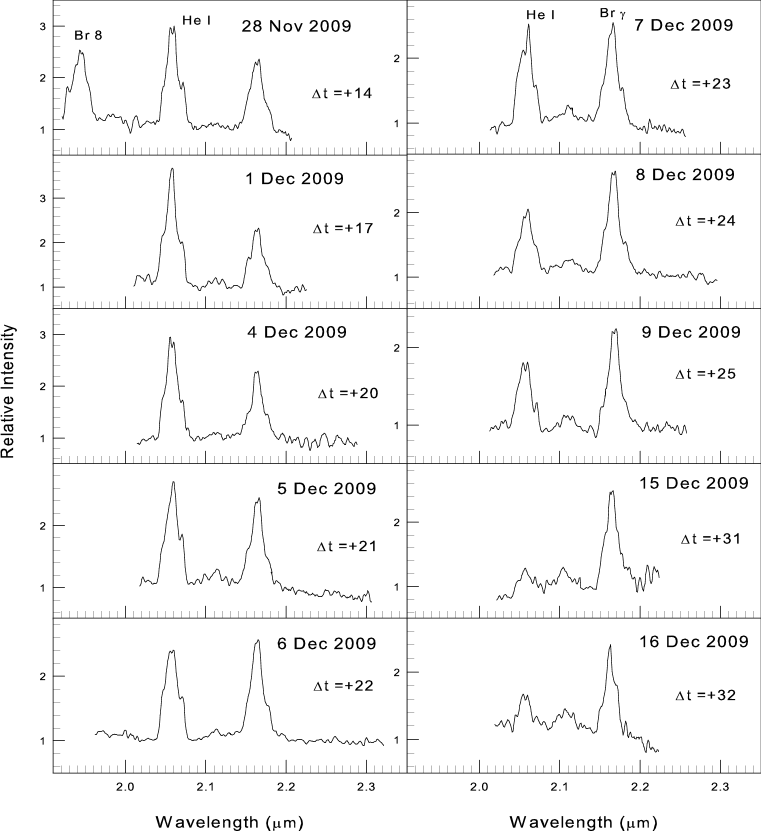
The spectra are presented in Figs 2 to 4 respectively; line identification is given in Table 3. The infrared observations presented here cover the phase after optical maximum with the first infrared spectra taken on 2009 November 28. In case of He/N class of novae a smaller number of spectral lines in the near-IR are normally seen as compared to the Fe II type of novae (Banerjee & Ashok 2012). Apart from this intrinsic difference between the two nova classes, the possibility exists of relatively weaker individual lines in He/N novae blending with each other due to large expansion velocities and becoming indistinguishable against the underlying continuum. The prominent lines seen in case of KT Eri are those due to H I, O I and He I. The typical FWHM of the H I lines range from 1900 to 2300 km s-1 with full width at zero intensity (FWZI) reaching a value of 4000 km s-1. A noticeable feature of these early spectra is the strong presence of lines due to He I. In the spectra taken on 2009 November 28 the He I lines at 1.0830 m, 1.7002 m, 2.0581 m, 2.1120 m and 2.1132 m are clearly seen. Although it is blended with Pa at 1.093 m, HeI 1.0830 m is strikingly strong in the spectra. These He I lines are seen to strengthen and become even stronger as the nova evolves.
No coronal lines are seen during the course of our observations. An upper limit can be set for the line flux, for e.g. for the [S IX] 1.2520 m line, of 4.6 10-19 Wcm-2 assuming that a detection could be claimed if the line was present at 5 of the observed continuum noise level (measured to have a standard deviation of 1) around the expected position of the line. This is based on the later spectra obtained in 2009 December. It is however difficult to set meaningful upper limits for other coronal lines generally seen in novae spectra because these are either not covered by us (e.g. lines from [Si VI] 1.964 m, [Si VII] 2.481 m and [Ca VIII] 2.322 m in the K band) or could be severely blended, if present, with other lines in the region (e.g. [Al IX] 2.040 m would be blended with the blue wing of the He I 2.0581 m; Br 10 line at 1.7362 m would blend with [P VIII] at the same position etc). Even the upper limit derived above for [S IX] 1.2520 m, assumes no contribution from He I 1.2534 m which occurs at almost the same wavelength.
There is also no indication of dust formation in the nova which is consistent with the absence of emission lines from low ionization species like Na and Mg which are potential harbingers of dust formation (Das et al. 2008; Banerjee & Ashok 2012).
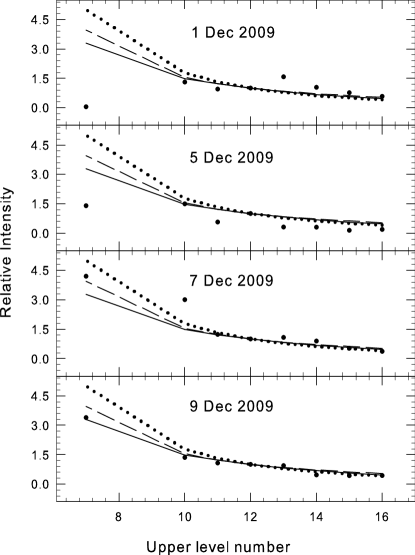
3.3 Recombination analysis of the H I lines and estimate of the ejecta mass
Recombination case B analysis for the H I lines was done for the observed spectra of all days. Representative results for four days (see Fig. 5) show the observed strength of the Brackett lines with respect to Br12 which is normalized to unity. Also shown are the predicted Case B values from Storey & Hummer (1995) if the lines are optically thin. The Case B values are for T = 104 K and for a few representative electron densities of ne = 108, 109 and 1011 cm-3. High electron densities are also considered because the ejecta material may be expected to be dense in the early stages after the outburst. Fig. 5 shows that the observed line intensities clearly deviate from case B values during the initial observations. Specifically, Br, which is expected to be relatively stronger, for any combination of electron density and temperature in the Case B scenario, than the other Br lines considered here is observed to be considerably weaker in the early observations. This is certainly due to large optical depths in the Br gamma line and possibly also in the other Brackett lines (e.g. Lynch et al. 2000). Such deviations from case B strengths, early after outburst, can be expected and have been observed in other novae too like V2491 Cyg and V597 Pup (Naik, Banerjee & Ashok 2009). However, 25 days after maximum on 2009 December 9 (fourth panel of Fig. 5) there is a clear-cut indication that case B conditions have begun to prevail implying the lines have become optically thin. For 2009 December 9, it is found that the observed data match well with the predicted values for the recombination case B values of T = 104 K and an electron density ne = 109 cm-3. We use additional arguments to constrain the electron density and thereby estimate the mass.
It is known from Hummer & Storey (1987) and Storey & Hummer (1995) that line center optical depth values can be significant when the electron densities become large. The value of the opacity factor for different Hi lines for transitions between levels at different temperatures and densities (equation 29 of Hummer & Storey (1987)) is tabulated in these studies. From the value of , the optical depth at line-center is given by = , where is the path length in cm. In our case, for the data of 2009 December 9, we take L = 4.84 - 7.26 1014 cm corresponding to the kinematic extent of the ejecta using an expansion velocity between 2000 - 3000 km s-1 (Ribeiro 2011; this work) and a time of 28 days since start of outburst. Slight variations in these numbers do not affect our analysis. Since the lines are optically thin on 2009 December 9, this means that must be less than 1. For = 104 K and = 109 cm-3, the corresponding value of the optical depth from Storey & Hummer (1995) is then found to be 0.016 for Br and this then decreases monotonically down the series to a value of = 0.003 for Br 19. At a higher density of = 1010 cm-3, the values increase sharply by approximately a factor of a few hundreds (since ) to 8 for Br and 0.31 for Br19. Hence, it is seen that the Br line (as also the other Br lines) is/are optically thin at a density of 109 cm-3 but becomes thick at 1010 cm-3. We therefore adopt = 109 cm-3 in our calculations. In applying the relation = given by Hummer & Storey (1987), it is assumed that the volume filling factor is unity. This assumption is also carried into the analysis below which only aims at setting an upper limit for the ejecta mass.
Following Banerjee et al. (2010), a constraint on the mass of the emitting gas can be obtained from:
| (1) |
where is the distance, mH the proton mass, the observed flux in a particular line, the corresponding case B emissivity; V is the volume of the emitting gas, which is [4/3 ], where , , and are the filling factor, velocity and time after outburst, respectively. Using the value of temperature and electron density we calculated the mass of the gas in the ejecta in the range 2.4 - 7.4 10-5M⊙. As the filling factor 1, this range is an upper limit for the mass of the ejecta.
3.4 Evidence for a bipolar flow
A significant finding that has emerged from the analysis of line-profile studies of KT Eri is the likely presence of a bipolar flow in the ejected material (Ribeiro 2011). Bipolar morphologies are commonly encountered in planetary nebulae and explained on the basis of the fast-winds from the hot PN nuclei interacting with a non-uniform circumstellar environment. In this anisotropic scenario, the pre-existing circumstellar material has a density enhancement in the equatorial plane which impedes the outflowing ejecta from expanding in the equatorial region while expanding relatively more freely in the polar direction. This leads to a constriction of the nebula with an hourglass shape. Kinematically, this would imply that the matter in the poles would flow out with a high velocity relative to the matter in the waist of the hourglass. It is possible that the secondary, which has colors suggestive of a cool giant (Jurdana-Sepic et al. 2012) has either through mass loss or a common envelope phase provided the necessary equatorial density contrast needed to create the bipolar morphology (Bond & Livio 1990). It is also becoming increasingly apparent with the aid of high-spatial resolution imaging that hourglass or bipolar morphologies could be commonplace in novae shells (Chesneau & Banerjee 2012). Striking examples of these are seen in the novae V1280 Sco (Chesneau et al. 2012), V445 Pup (Woudt & Steeghs 2005) and RS Oph (Bode et al. 2007, Harman et al. 2008).
The kinematic evidence for a bipolar flow in KT Eri is also seen from our near-IR data. To illustrate this, we present in Fig. 6, representative profiles of the Pa and Br lines on 2009 December 7.865 UT (similar analysis was also done for the data of 2009 December 6.813 and 8.834 UT). As can be seen, the profiles have a strong central component flanked by two weaker components. In both panels of Fig. 6, we have fitted the profile with three Gaussians viz. a central Gaussian for the core emission component and two Gaussians for the satellite components in the wings.
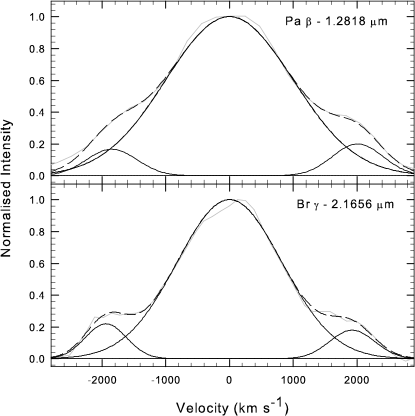
It is seen that a three-component Gaussian fits the data reasonably well. The fits for 2009 December 6, 7 8 indicate the presence of two high velocity components at mean radial velocities (averaged over the three days) of -1790 75 and 2080 60 km s-1 for Pa and at -1800 115 and 2040 150 km s-1 for the Br lines, respectively (these high velocity components appear to be associated with the faster structure reported by Bode et al. (2010)). The central components have full width at half-maximum (FWHM) of 2340 125 and 1930 85 km s-1 for the Pa and Br lines, respectively. We can interpret the results of Fig. 6 as follows viz. the core emission can be associated with the slower expanding material from the waist of the bipolar ejecta while the higher velocity satellite components are associated with the flow from the polar regions. A similar high velocity bipolar flow in the case of the 2006 outburst of the recurrent nova RS Oph was also deduced by Banerjee, Das & Ashok (2009) on the basis of broad observed wings in Pa and Br line profiles.
3.5 Evolution of the continuum
We analyze and discuss the evolution of the spectral continuum of KT Eri. At the time of outburst, a nova’s continuum is generally well described by a blackbody distribution from an optically thick pseudo-photosphere corresponding to a stellar spectral type A to F (Gehrz 1988). The spectral energy distribution (SED) then gradually evolves into a free-free continuum as the optical depth of the nova ejecta decreases (Ennis et al. 1977; Gehrz 1988). The evolution of the continuum of KT Eri is shown in Fig. 7 wherein we have shown representative spectra sampling the duration of our observations. The spectra in Fig. 7 were flux calibrated using the broad-band photometric observations presented in Table 2.
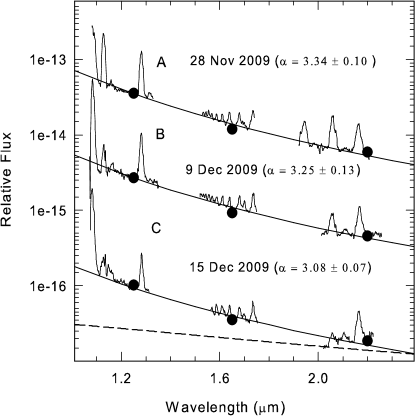
At the epoch of optical maximum, a blackbody fit which will have an index of = 4.0 at longer wavelengths, is expected to fit the continuum flux distribution. As our observations begin from day 14 after optical maximum, we have done power law fits, -α, to see the evolution of continuum spectra shown in Fig. 7. In the beginning of our observations i.e. on 2009 November 28 (14 d after optical maximum) and 2009 December 9, the continuum spectrum are well matched with fits having spectral indices of = 3.34 0.10 and = 3.25 0.13, respectively. The subsequent spectra taken on 2009 December 15 have become slightly flatter with the slope of = 3.08 0.07. As a comparison, we also show a plot (with dotted line in Fig. 7) of the expected slope for a case of pure free-free emission evaluated at a representative temperature of T = 10,000 K.
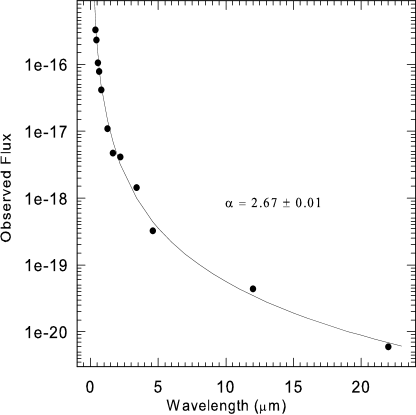
Proceeding further, we have also specifically tried to fit the SED for 2010 February 22 to 28, shown in Fig. 8, because of the availability of contemporaneous data at that time including WISE (Wide Field Infrared Survey Explorer) observations (Wright et al. 2010). Such data allows the SED to be fit over a much larger range in wavelength. In Fig. 8 we have used the data from AAVSO, data from Mt. Abu and WISE data in the and wavebands which are centered at 3.4, 4.6, 12 and 22 m respectively. The corrected flux values corresponding to all these various magnitudes are given in Table 4. What we find in Fig. 8 is that the continuum is remarkably well fit by a power law, with the spectral index further reduced to 2.67. The slow change in the slope of the continuum spectrum index with time is also evident in the case of other novae, for example, V4643 Sagittarii where it changed from a slope of about 3 to 2 within about three months (Ashok et al. 2006). However, in the case of another nova viz. V4633 Sagittarii (Lynch, Russel & Sitko 2001) the change in the slope of the continuum was found to be in the opposite direction, i.e. the slope changed from 2 to 2.7 in observations taken 525 and 850 days after outburst. Therefore, the evolution of the continuum in a nova’s development can be fairly complex as also remarked by Lynch, Russel & Sitko (2001).
It is also worth noting that the SED fit in Fig. 8 represents the behaviour of the nova in the plateau phase. The optical mid-plateau phase has been clearly seen earlier in a limited number of novae, notably in the recurrent novae RS Oph, U Sco and CI Aql (Hachisu, Kato Luna 2007 and references therein). It is usually associated with a super-soft X-ray phase (e.g. in RS Oph as described in Osborne et al. 2011) and is interpreted as being caused by the accretion disk being irradiated by the central hot white dwarf (Hachisu, Kato Luna 2007). The disk is bright as long as the white dwarf, which is rapidly shrinking and becoming hotter at this stage, is luminous because of a thin hydrogen shell still burning on its surface and it becomes dark when the shell-burning ends. The mid-plateau phase is poorly studied and a SED covering such a large extent in wavelength, possibly not available for any other nova, should be useful in interpreting this stage in a nova’s development. In the case of a steady-state accretion disk around a white-dwarf, the continuum radiation from the disk can be described by a 1/3 relation (Mayo, Wickramasinghe, Whelan 1980 and references therein) or equivalently -α where = 2.33. The observed spectral index of the SED is rather close to this value. However, the near-IR magnitudes of the suggested progenitor in quiescence indicate the secondary to be an evolved star (discussed later in section 4; Jurdana-Sepic et al. 2012) so its contribution should dominate over the emission component from the accretion disc. But it would be interesting to verify, more stringently, what fraction of the observed energy arises due to the irradiated accretion disk emitting the reprocessed radiation of the central WD.
| Date of Observation (UT) | Band | Flux (Wcmm-1) |
|---|---|---|
| 2010 Feb. 26.433 | 3.3 10-16 | |
| 2010 Feb. 26.428 | 2.3 10-16 | |
| 2010 Feb. 26.428 | 1.1 10-16 | |
| 2010 Feb. 26.431 | 7.8 10-17 | |
| 2010 Feb. 26.432 | 4.2 10-17 | |
| 2010 Feb. 28.735 | 1.1 10-17 | |
| 2010 Feb. 28.735 | 4.7 10-18 | |
| 2010 Feb. 28.735 | 4.1 10-18 | |
| 2010 Feb. 22.768 | 1.4 10-18 | |
| 2010 Feb. 22.768 | 3.2 10-19 | |
| 2010 Feb. 22.863 | 4.4 10-20 | |
| 2010 Feb. 22.982 | 5.9 10-21 |
4 Evolution of line profile widths: the recurrent nova possibility
The similarity of many of the pre- and post-outburst UV and optical properties of KT Eri with those of the recurrent novae has raised the question whether KT Eri could be a recurrent nova (Jurdana-Sepic et al. 2012, Hung, Chen & Walter 2011, Chen, Hung & Walter 2013). Jurdana-Sepic et al. (2012) have analyzed and listed many of these similarities in details. There are similarities in X-ray properties too. KT Eri is the second nova, after the recurrent nova RS Oph, to exhibit a 35 sec oscillation in its super soft X-ray emission (Beardmore et al. 2010, Ness et al. 2007, Nelson et al. 2008). Further, if the bright 15th magnitude star coincident with the nova’s position is its progenitor, its observed magnitude is suggestive of it being a bright evolved giant. It is recognized that of 10 known recurrent novae, at least eight are known to harbor evolved secondary stars rather than the main-sequence secondaries typical in classical novae (Darnley et al. 2012).
The present near-IR observations can, to some extent, test the suggestion made by Jurdana-Sepic et al. (2012) that the progenitor may be a cool giant star. These authors have utilized the 2MASS infrared magnitudes to study the properties of the secondary star in KT Eri as the IR colors are more sensitive to show signature of the secondary star. They have calculated the absolute magnitudes of the secondary star to be MJ = 0.48 0.03, MH = 0.05 0.05 and M = 0.00 0.07 and point out that these magnitudes are more in line with those of cool giant stars and that the magnitudes are significantly brighter than those of typical quiescent CNe (Darnley et al. 2011).
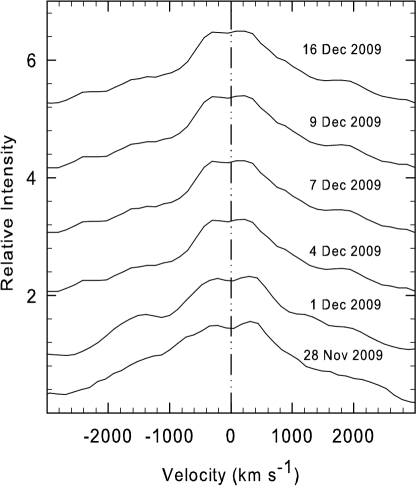
If KT Eri is indeed a RNe of the RS Oph type, harboring a red-giant companion, a significant or dramatic decrease in the width of the emission line profiles may be expected with time after outburst. As the secondary stars in the RS Oph type RNe lose mass at a high rate, the nova ejecta expelled with high velocity is rapidly decelerated as it moves through the wind of the companion. This deceleration results in a fast temporal decrease of the expansion velocity of the ejecta as clearly seen from IR lines in the case of the 2006 outburst of RS Oph (e.g Das, Banerjee & Ashok 2006). We looked for similar behavior in KT Eridani by studying the evolution of the FWHM of the Br line. The line profiles of Br for 6 days are shown in Fig. 9. These line profiles do not show significant changes during the period 2009 November 28 to 2009 December 16 implying a lack of deceleration during this period. There are no observations in the period between 2009 November 14 to 2009 November 28 to know whether the FWHMs decreased during this period, but it is expected that any deceleration if it took place, would persist for a much longer time (i.e beyond 28 November). This is what was seen in the near-IR in RS Oph (Das, Banerjee & Ashok 2006) and also in the optical and near-IR in the symbiotic nova V407 Cyg (Munari et al. 2011) whose secondary consists of a high mass losing Mira variable.
5 Summary
We have presented multi-epoch near-infrared spectroscopy and photometry of nova KT Eri which erupted in mid-November 2009. From the optical light curve, the distance to the nova, height below the galactic plane and outburst luminosity are estimated. The light curve classification for KT Eri is seen to be type based the plateau observed in its optical and near-IR light curve. The infrared spectra indicate that the nova is of the He/N type. Recombination analysis is used to estimate the mass of the gaseous component of the ejecta. Kinematic evidence is presented from the shape of the line profiles for a possible bipolar flow. We analyze the evolution of the continuum with time and also discuss the possibility of KT Eri being a recurrent nova.
6 Acknowledgments
The research work at Physical Research Laboratory is funded by the Department of Space, Government of India. This study acknowledges the use of AAVSO (American Association of Variable Star Observers) and WISE (Wide-field Infrared Survey Explorer) data. We thank the reviewer Prof. A. Evans, for his comments that have helped in improving the results presented here.
References
- Ashok (2006) Ashok N. M., Banerjee D. P. K., Varricatt W. P., Kamath U. S., 2006, MNRAS, 368, 592
- Banerjee (2012) Banerjee D. P. K., Ashok N. M., 2012, BASI, 40, 243
- Banerjee (2010) Banerjee, D. P. K. et al., 2010, MNRAS, 408, L71
- Banerjee (2009) Banerjee D. P. K., Das R. K., Ashok N. M., 2009, MNRAS, 399, 357
- Banerjee (2009) Banerjee D. P. K., Ashok N. M., 2002, A&A, 395, 161
- Beardmore (2010) Beardmore A. P. et al., 2010, The Astronomer’s Telegram, 2423, 1
- Bode (2007) Bode M. F., Harman D. J., O’Brien T. J., Bond H. E., Starrfield S., Darnley M. J., Evans A., Eyres S. P. S., 2007, ApJ, 665, L63
- Bode (2010) Bode M. F. et al., 2010, The Astronomer’s Telegram, 2392, 1
- Bond (1990) Bond H. E., Livio M., 1990, ApJ, 355, 568
- Chen (2013) Chen W. P., Hung L. W., Walter F. M., 2013, Proceedings of the International Astronomical Union, IAU Symposium, 290, 191
- Chesneau (2012) Chesneau O., Banerjee D.P.K., 2012, BASI, 40, 267
- Chesneau (2012) Chesneau O. et al., 2012, A&A, 545, 63
- Das (2006) Das R.K., Banerjee D.P.K., Ashok N.M., 2006, ApJ, 653, L141
- Das (2008) Das R.K., Banerjee D.P.K., Ashok N.M., Chesneau O., 2008, MNRAS, 391, 1874
- Darnley (2011) Darnley M. J., Ribeiro V. A. R. M., Bode M. F., Munari U., 2011, A&A, 530, 70
- Darnley (2012) Darnley M. J., Ribeiro V. A. R. M., Bode M. F., Hounsell R. A., Williams R. P., 2012, ApJ, 746, 61
- Drake (2009) Drake A.J. et al., 2009, The Astronomer’s Telegram, 2331, 1
- della (1995) della Valle M., Livio M., 1995, ApJ, 452, 704
- Ennis (1977) Ennis D., Beckwith S., Gatley I., Matthews K., Becklin E. E., Elias J., Neugebauer G., Willner S. P., 1977, ApJ, 214, 478
- Eyles (2003) Eyles C. J. et al., 2003, SoPh, 217, 319
- Gehrz (1988) Gehrz R.D., 1988, ARAA, 26, 377
- Guido (2009) Guido E., Sostero G., Maehara H., Fujii M., 2009, Central Bureau Electronic Telegrams, 2053, 1
- Hachisu (2007) Hachisu I., Kato M., Luna G. J. M., 2007, ApJ, 659, L153
- Harman (2008) Harman D. J. et al., 2008, Proceedings of the Astronomical Society of the Pacific Conference edited by Evans A., Bode M. F., O’Brien T. J. & Darnley M. J., San Francisco, 401, 246
- Hounsell (2010) Hounsell R. et al., 2010, ApJ, 724, 480
- Hummer (1987) Hummer, D. G., Storey, P. J., 1987, MNRAS, 224, 801
- Hung (2011) Hung L. W., Chen W. P., Walter F. M., 2011, ASP Conference Series, 451, 271
- Jackson (2005) Jackson B. V. et al., 2005, SolPhy, 224, 177
- Jurdana (2012) Jurdana-Sepic R., Ribeiro V. A. R. M., Darnley M. J., Munari U., Bode M. F., 2012, A&A, 537, 34
- Lynch (2000) Lynch D. K., Rudy R. J., Mazuk S., Puetter R. C., 2000, ApJ, 541, 791
- Lynch (2001) Lynch, D. K., Russel, R. W., Sitko, M. L., 2001, AJ, 122, 3313
- Maehara (2009) Maehara H., Arai A., Isogai M., 2009, Central Bureau Electronic Telegrams, 2055, 1
- Mayo (1980) Mayo S. K., Wickramasinghe D. T., Whelan J. A. J., 1980, MNRAS, 193, 793
- McQuillin (2012) McQuillin R., Evans A., Wilson D., Maxted P. F. L., Pollacco D., West R. G., Hounsell R. A., Bode M. F., 2012, MNRAS, 419, 330
- Munari (2011) Munari U. et al., 2011, MNRAS, 410, L52
- Naik (2009) Naik S., Banerjee D. P. K., Ashok N. M., 2009, MNRAS, 394, 1551
- Nelson (2008) Nelson T., Orio M., Cassinelli J. P., Still M., Leibowitz E., Mucciarelli P., 2008, ApJ, 673, 1067
- Ness (2007) Ness J. -U. et al., 2007, ApJ, 665, 1334
- Ness (2010) Ness J.-U., Drake J.J., Starrfield S., Bode M., Page K., Beardmore A., Osborne J.P., Schwarz G., 2010, The Astronomer’s Telegram, 2418, 1
- Nesci (2009) Nesci R., Mickaelian A., Rossi C., 2009, The Astronomer’s Telegram, 2338, 1
- O’Brien (2010) O’Brien T.J., Muxlow T.W.B., Stevens J., Datta A., Roy N., Eyres S.P.S., Bode M.F., 2010, The Astronomer’s Telegram, 2434, 1
- Osborne (2011) Osborne J. P. et al., 2011, ApJ, 727, 124
- Payne (1964) Payne-Gaposchkin C., 1964, The Galactic Novae, Dover, New York.
- Pejcha (2008) Pejcha O., Prieto J. L., Denney K., 2008, The Astronomer’s Telegram, 1825, 1
- Pojmanski (1997) Pojmanski G., 1997, Acta Astronomica, 47, 467
- Pollacco (2006) Pollacco D. et al., 2006, PASP, 118, 1407
- Prieto (2008) Prieto J. L., Denney K., Pejcha O., Wagner R. M., 2008, The Astronomer’s Telegram, 1835, 1
- Ragan (2009) Ragan E. et al., 2009, The Astronomer’s Telegram, 2327, 1
- Rebeiro (2011) Ribeiro V. A. R. M., 2011, Ph.D. Thesis, Liverpool John Moores University
- Rudy (2009) Rudy R. J., Prater T. R., Russell R. W., Puetter R. C., Perry R. B., 2009, Central Bureau Electronic Telegrams, 2055, 1
- Schaefer (2010) Schaefer B. E., 2010, ApJS, 187, 275
- Schlegel (1998) Schlegel D. J., Finkbeiner D. P., Davis M., 1998, ApJ, 500, 525
- Storey (1995) Storey P. J., Hummer D. G., 1995, MNRAS, 272, 41
- Strope (2010) Strope R. J., Schaefer E., Henden A. A., 2010, AJ, 140, 34
- Warner (2008) Warner B., 2008, in Bode M. F., Evans A., eds, Classical Novae, Cambridge Univ. Press, Cambridge, p. 21
- Woudt (2005) Woudt P. A., Steeghs D., 2005, ASP Conference Series, 330, 451
- Wright (2010) Wright E. L. et al., 2010, AJ, 140, 1868
- Yamaoka (2009) Yamaoka H., Itagaki K., 2009, Central Bureau Electronic Telegrams, 2050, 1
- Yamaoka (2009) Yamaoka H., Itagaki K., Guido E. et al., 2009, IAU Circ., 9098, 1