Bi-axial shear of confined colloidal suspensions: the structure and rheology of the vorticity-aligned string phase
Abstract
Using a novel bi-axial confocal rheoscope, we investigate the structure and rheology of sheared colloidal suspensions under confinement. Consistent with previous work [X. Cheng et al., Proc. Natl. Acad. Sci. U. S. A., 2011, 109, 63], we observe a vorticity-aligned string phase in moderate concentrated colloidal suspensions under uniaxial shear. Using bi-axial shear protocols, we directly manipulate the orientation and morphology of the string structures. Simultaneously, we measure the suspension rheology along both the flow and vorticity directions with a bi-axial force measurement device. Our results demonstrate that despite the highly anisotropic microstructure, the suspension viscosity remains isotropic and constant over the shear rates explored. These results suggest that hydrodynamic contributions dominate the suspension response. In addition they highlight the capabilities of bi-axial confocal rheoscopes for elucidating the relationship between microstructure and rheology in complex fluids.
I Introduction
Strong shear flow can break the symmetry of isotropic phases in complex fluids and induce a highly anisotropic structure Solomon ; Larson ; Vermant2010 . Examples include the out-of-equilibrium isotropic-nematic phase transition in sheared liquid crystals Jean ; Denis ; Elmar , the log-rolling cylindrical phase of micelles in amphiphilic films Arya ; Beth , and the shear-induced crystallization and buckling phases in concentrated colloidal suspensions Cohen ; Haw . The flow behavior of these fascinating phases has been intensively studied in rheological measurements using uniaxial shear Solomon ; Larson ; Vermant2010 ; Jean ; Denis ; Elmar ; Carlos ; Arya ; Beth ; Cohen ; Haw . However, this conventional method only measures the stress response along the flow direction. It cannot reveal the directionally dependent rheological properties of anisotropic phases. For measuring these quantities, a bi-axial shear protocol with the superimposed perturbation method is required Farage ; Vermant ; orthogonal . Combining such bi-axial shear protocols with direct imaging of the material microstructure holds the promise of enabling correlation between structure and anisotropic rheology in these structured materials.
With that end in mind, we construct a bi-axial confocal rheoscope by combining a dual-directional shear cell with a bi-axial force measurement device. This apparatus allows for manipulating the formation and the orientation of shear-induced structures while simultanesously measuring their anisotropic mechanical response, and imaging their structure Besseling ; Besseling2 ; xiang ; Lehigh ; Schmoller .
Here, we use this instrument to systematically investigate the structure and rheology of the vorticity-aligned string phase in sheared colloidal suspension under confinement. This phase is particularly interesting because it has a unique one-dimensional translational symmetry vermant2010a ; vermant2010b ; ackerson ; ackerson1990 ; Laun ; string ; Osuji , has been shown to arise from interesting hydrodynamic interactions between particles string , and has potential applications to nano-fabrication and bio-analysis spin ; Vermant2010 ; Baudry2006 . Until recently, prior research has focused on the string structure in bulk colloidal suspensions with visco-elastic polymeric solvents Solomon ; Vermant2010 ; vermant2010a ; vermant2010b ; ackerson ; ackerson1990 ; Laun . However, it has been found that even in a simple Newtonian fluid, suspended colloidal particles can assemble into a string structure when confined to a narrow gap that is a few particle-diameters thick string . In contrast to the flow-aligned string phase found in bulk colloidal suspensions with visco-elastic solvents, the confined strings orient along the vorticity direction normal to the plane of shear. The intriguing structure results from the unique interactions that arise from geometric constraint and hydrodynamic particle-particle and particle-wall couplings all of which are enhanced by confinement string . Although the structure of the vorticity-aligned string phase under confinement has been reported string , the flow behavior and stress response of this anisotropic phase are still poorly explored. With our bi-axial confocal rheoscope, we directly measure the rheology of the string phase along different directions. Furthermore, we demonstrate direct control over the isotropic-to-string phase transition using bi-axial shear flows.
II Experimental method
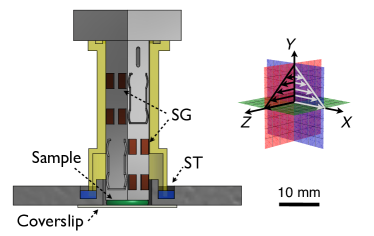
The schematic of the bi-axial shear cell is illustrated in Fig. 1. For each experimental run, 10 of suspension are loaded in a gap consisting of a coverslip and a silicon wafer with a 9m separation between them. Both plates are adjusted to be parallel within 0.0075∘ by turning three set screws. The coverslip is coupled to a multi-axis piezo (PI P-733) that can generate movements along all directions to apply bi-axial shear flows. The silicon wafer is attached to a bi-axial force measurement device (FMD) so that the shear stresses and are measured simultaneously. Here, , , and correspond to the flow, gradient, and vorticity axes of the primary shear flow. In the FMD, eight foil gauges - four for each direction - are wired as two independent Wheatstone bridges that enable stress measurement. All signals measured by the FMD are amplified by signal conditioning amplifiers (Vishay 2310B) then digitized for Fourier analysis. By mounting this bi-axial shear cell on a fast confocal microscope (Zeiss LSM 5 Live), we also image the microstructure while the suspension is sheared and the stress response is measured.
Our sample is comprised of silica particles with diameter m suspended in a 1:4 water-glycerin mixture. The solvent has a viscosity Pas and a refractive index of 1.442 that matches that of the particles. The suspension volume fraction is 0.39. We add 1.25mg/ml of fluorescein sodium salt to dye the solvent for confocal imaging.
The bi-axial shear flow imposed can be divided into two oscillatory shear flows
| (1) |
Here, corresponds to the strain amplitude, corresponds to the shear frequency, and corresponds to the phase angle difference between the primary flow, indicated by the subscipt 1 and secondary flow, indicated by the subscript 2.
III Results
III.1 Phase angle dependence: structure
In the phase angle experiment, we set two perpendicular flows at , and vary the phase angle over the range . Thus the shear rate along each axis is s-1, which corresponds to Pe. Here, Pe= is the Pclet number that characterizes the ratio of the shear rate to the relaxation rate of the sample.
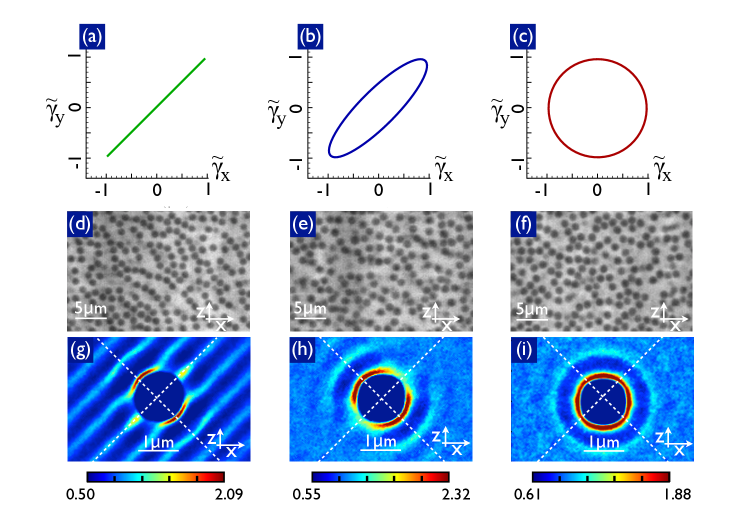
Fig. 2(a), (b) and (c) show the Lissajous curves for the imposed flows where and respectively. For , the shear strain trajectory is linear and aligned at 45∘ to the -axis. This linearly polarized shear flow is exactly the same as the uniaxial shear flow except with a different orientation (Fig. 2(a)). In Fig. 2(b) and (c), is elliptically polarized with and circularly polarized with respectively.
Previous measurements have shown that the string structures are most pronounced near the boundaries string . Thus, for each phase angle, we image the colloidal particles in the second layer 2.5m below the top stationary plate. We find that as changes from 0 to /2 the suspension structure transitions from a string morphology to one that is isotropic (Fig. 2(d-f)). To illustrate this transition we calculate the pair correlation functions (Fig. 2(g), (h) and (i)). Here is the normalized probability of finding a particle at vector with respect to another particle in the - plane. In Fig. 2(d), we find that when the suspension is subjected to a linearly polarized shear flow, demonstrates a highly anisotropic distribution at its first peak and exhibits stripes at larger . These stripes along with the anisotropic distribution of particle densities confirm that particles align along the vorticity direction and form string structures under uniaxial shear (Fig. 2(g)). This finding is consistent with previous results string . As increases to , the first peak of maintains a similar shape but with a broader peak width. Most stripes disappear and the anisotropy of the second and the third peaks of significantly decreases (Fig. 2(h)). Finally, for , is isotropic indicating that the suspension is characterized by liquid-like order Fig. 2(i).
To determine the degree of order we circularly integrate weighted by and construct the order parameter .
| (2) |
where is the pair correlation function in polar coordinate, and is the angle between and the flow direction. This order parameter is the real space analogue of the alignment factor, which has been used to quantify anisotropic suspension structures vermant2010a ; Maranzano2002 . is positive for flow-aligned structures and negative for vorticity-aligned structures. We calculate versus for ten different values of , and plot the data for four values in Fig. 3. We find that for , has two negative extremes located at and , corresponding to the vorticity-aligned structures. The sign of this functional form is opposite to the one found for flow-aligned structures vermant2010a ; Maranzano2002 . As increases, the oscillation of decreases and becomes flat at .
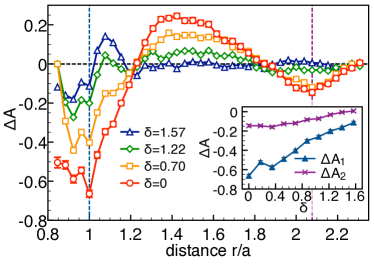
We measure at the first and second negative peaks and and plot them versus . We find that both and decay with increasing phase angle as illustrated in the inset of fig. 3. This gradual decrease indicates that the transition from the string phase to isotropic phase is continuous. We also find that is smaller than for all . The ratio characterizes the probability ratio of finding a two-particle chain to that of a three-particle chain aligned along the vorticity direction. In combination with the real space images, these data demonstrate that as is decreased, the particles form chains that are both long and kinked.
These trends are valid so long as the shear period is much smaller than the relaxation time. Stokesian Dynamics simulationsdiffusion ; diffusion2 ; Sierou and previous experimental resultsstring , show that for the applied shear rate, the diffusivity is enhanced by a factor of 200. Thus, the time for a sheared sample to reach steady state is around s where s is the relaxation time for the quiescent suspension. This shear-induced relaxation enables particles to form strings within about one shear cycle. Thus, for the circularly polarized shear flow (), if the radius of gyration and the period are both increased by a factor of 10 so that the shear rate is maintained, the string structures will still form but change their orientation with the imposed flow.
III.2 Phase angle dependence: rheology
We study the relation between the rheology and the anisotropic microstructure by measuring the stress responses along the -axis, , and the -axis, , simultaneously for different phase angles . We plot and versus in Fig. 4 (a). Despite the dramatic change in microstructure, we find no measureable difference between and and that both are independent of .
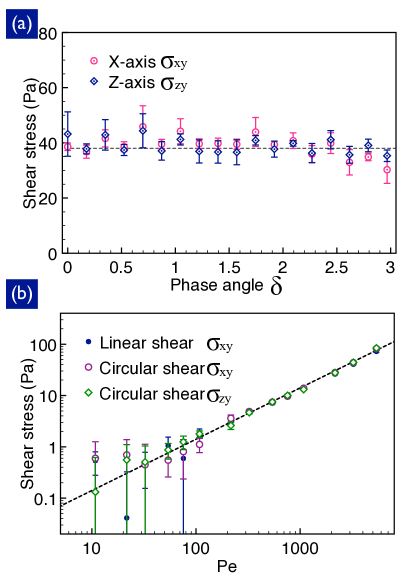
To measure the Pe-dependence of and we perform an amplitude sweep over the range while keeping the frequencies fixed at 31.4 . We plot and versus Pclet number for both linear and circular polariztions in Fig. 4(b). We find quantitatively similar dependencies for both polarizations. These data indicate that the shear induced in-plane structure does not alter the suspension rheology over this range of Pe.
III.3 Superposition spectroscopy
To probe the anisotropic rheological properties of the suspensions, we perform a superposition spectroscopy measurement Vermant ; orthogonal . This method has recently gained traction for measuring the shear thinning behavior of polymer meltsVermant ; orthogonal and colloidal glasses Ovarlez ; Farage , as well as slow relaxations in granular systemsLing-Nan . To perform these measurements we apply a supperposition of shear flows as described in Eq. 1 with frequencies for the primary flow and for the secondary flow. Simulatneously we measure the stress response along the -axis and the -axis using our bi-axial force measurement device.
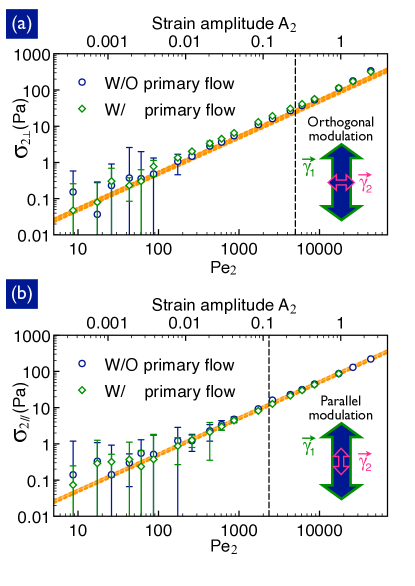
We conduct experiments using parallel and orthogonal modulations of the primary shear flow. For the orthogonal modulations, we set , and is varied. The primary flow is held fixed with Pe and is used to generate the string phase. The secondary flow is varied over the range to probe the suspension’s rheological response. For the parallel modulation, we set , , and is varied. The primary flow is held fixed with Pe and is used to generate the string phase. The secondary flow, which is now parallel to the primary flow, is varied over the range to probe the suspensions rheological response along the flow direction. In both cases we record the total stress for 500 cycles and then take a Fourier transform of the measurement to read out the response - , or at the frequency .
We plot for the orthogonal modulation (green diamonds) and for the parallel modulation (green diamonds) versus Pe in Fig. 5(a) and (b) respectively. We find that the measurements for both modulations are quantiatively similar. In both cases we find a linear dependence of stress on Pe indicating a Newtonian response. These results suggest that there may not be any effect of the structure on the suspension shear rheology. To test this hypothesis we conduct additional experiments in which the primary flow is absent (blue circles). We find that the stress measurements for these flows are quantitatively similar to those where the primary flow is applied. Collectively these results demonstrate that despite the formation of string structures the suspension response remains isotropic. In addition, we calculate the high frequency limit stress response for an isotropic suspension with using Cheng2002 :
| (3) |
We find that the predicted viscosity mPas gives a stress response (orange dashed lines in Fig. 5)that is in excellent agreement with the data. These results imply that for the range of Pe explored, the shear stress response is dominated by a hydrodynamic contribution that is independent of the shear induced suspension structure.
IV Conclusion
Using a bi-axial confocal rheoscope, we measured the rheological response of the vorticity-aligned string phase along the flow and vorticity directions. This apparatus enabled us to control the orientation and morphology of the sheared colloidal suspension under confinement. We showed that by varying the phase between the two shear directions the sample transitions from a string phase to an isotropic phase. By employing various bi-axial shear protocols, we found that despite it’s anisotropic structure, the string phase rheology is quantitatively similar to the that of the isotropic suspension. The result clearly shows that hydrodynamic interactions play a crucial role in the formation of the string phase and dominate its rheological response string . In addition, they demonstrate that for this volume fraction and degree of confinement, the hydrodynamic contribution to the shear stress is insensitive to the suspension microstructure. Whether such anisotropic structures lead to a normal stress difference remains unknown.
References
- (1) J. Vermant and M. J. Solomon, J. Phys. Condens. Matter, 2005, 17, 187-216.
- (2) M. Grzelczak, J. Vermant, E. M. Furst, and L. M. Liz-Marzn, ACS nano, 2010, 4, 3591-3605.
- (3) R. G. Larson, The Structure and Rheology of Complex Fluids, Oxford University Press, Oxford.
- (4) J. Berret, D. C. Roux and G. Porte, J. Phys. II France, 1994, 4, 1261-1279.
- (5) D. C. Roux , J. Berret , G. Porte, E. Peuvrel-Disdier , P. Lindner, 1995, 28, 1681-1687.
- (6) E. Fischer and P. T. Callaghan, Phys. Rev. E, 2001, 64, 011501-011501.
- (7) G. Arya and A. Z. Panagiotopoulos, Phys. Rev. Lett. 2005, 95, 188301-188301.
- (8) B. A. Schubert , E. W. Kaler , and N. J. Wagner, Langmuir, 2003, 19, 4079-4089.
- (9) I. Cohen, T. G. Mason, D. A. Weitz, Phys. Rev. Lett., 2004, 93, 046001-1.
- (10) M. D. Haw, W. C. K. Poon, and P. N. Pusey, Phys. Rev. E, 1998, 57, 6859-6864.
- (11) C. R. Lpez-Barrn, L. Porcar, A. P. R. Eberle, and N. J. Wagner, Phys. Rev. Lett., 2012, 108, 258301-258301.
- (12) T. F. F. Farage and J. M. Brader, J. Rheol., 2012, 56, 259-278.
- (13) J. Vermant, L. Walker, P. Moldenaers, J. Mewis, J. Non-Newtonian Fluid Mech., 1998, 79 173-189.
- (14) J. Vermant, P. Moldenaers, J. Mewis, M. Ellis and R. Garritano, Rev. Sci. Instrum., 1997, 68, 4090-4096.
- (15) K. M. Schmoller, P. Fernandez, R. C. Arevalo, D. L. Blair, and A. R. Bausch, Nature Communications, 2010, 1, 134.
- (16) X. Cheng, J. H. McCoy, J. N. Israelachvili and I. Cohen, Science, 2011, 333 1276-1279.
- (17) C. Gao, S. D. Kulkarni, J. F. Morris, J. F. Gilchrist, Phys. Rev. E Stat. Nonlin. Soft Matter Phys., (2010), 81, 041403.
- (18) R. Besseling, E. R. Weeks, A. B. Schofield, and W. C. K. Poon, Phys. Rev. Lett., 2007, 99, 028301.
- (19) R. Besseling, L. Isa, P. Ballesta, G. Petekidis, M. E. Cates, and W. C. K. Poon, Phys. Rev. Lett. 2010, 105, 268301.
- (20) R. Pasquino, F. Snijkers, N. Grizzuti, J. Vermant, Rheologica Acta, 2010, 49, 993-1001.
- (21) L. B. Chen, B. J. Ackerson and C. F. Zukoski, J. Rheol., 1994, 38, 193-216.
- (22) B. J. Ackerson, J. Rheol., 1990, 34, 553-590.
- (23) C. O. Osuji, D. A. Weitz, Soft Matter, 2008, 4, 1388-1392.
- (24) R. Pasquino, F. Snijkers, N. Grizzuti, and J. Vermant, Langmuir, 2010, 26, 3016-3019.
- (25) H. M. Laun, R. Bung, K. Hahn, E. Hdicke, R. Hingmann, F. Schmidt, S. Hess, W. Loose, O. Hess, and P. Lindner, J. Rheol., 1992, 36, 743-787.
- (26) X. Cheng, X. Xu, S. A. Rice, A. R. Dinner, and I. Cohen, Proc. Natl. Acad. Sci. U. S. A., 2011, 109, 63-67.
- (27) P. Jiang, M. J. McFarland, J. Am. Chem. Soc. 2004, 126, 13778-13786.
- (28) J. Baudry, C. Rouzeau, C. Goubault, C. Robic, L. Cohen-Tannoudji, A. Koenig, E. Bertrand, and J. Bibette, Proc. Natl. Acad. Sci. U. S. A., 2006, 103, 16076-16078.
- (29) D. R. Foss, and J. F. Brady, J. Fluid Mech., 1999, 401, 243-274.
- (30) A. Acrivos, J. Rheol., 1995, 39, 813-826.
- (31) A. Sierou, J. F. Brady, J. Fluid Mech., 2004, 506, 285-314.
- (32) B. J. Maranzano and N. J. Wagner, J. Chem. Phys., 2002, 117 10291-10302.
- (33) L. Zou, Phys. Rev. E, 2010, 81 031302.
- (34) G. Ovarlez, Q. Barral and P. Coussot, Nat. Materials, 2010 9 115 119.
- (35) Z. Cheng, J. Zhu, P. M. Chaikin, S. Phan and W. B. Russel, Phys. Rev. E, 2002, 65, 041405.
- (36) J. M. Brader, J. Phys. Condens. Matter, 2010, 22, 363101.
- (37) E. Guazzelli, J. F. Morris, A Physical Introduction to Suspension Dynamics, Cambridge University Press, Cambridge, England, 2012.
- (38) J. Mewis, N. J. Wagner, Colloidal Suspension Rheology, Cambridge University Press, Cambridge, England, 2012.