Resources of polarimetric sensitivity in spin noise spectroscopy
Abstract
We attract attention to the fact that the ultimate (shot-noise-limited) polarimetric sensitivity can be enhanced by orders of magnitude leaving the photon flux incident onto the photodetector on the same low level. This opportunity is of crucial importance for present-day spin noise spectroscopy, where a direct increase of sensitivity by increasing the probe beam power is strongly restricted by the admissible input power of the broadband photodetectors. The gain in sensitivity is achieved by replacing the 45∘ polarization geometry commonly used in conventional schemes with balanced detectors by geometries with stronger polarization extinction. The efficiency of these high-extinction polarization geometries with enhancement of the detected signal by more than an order of magnitude is demonstrated by measurements of the spin noise spectra of bulk :GaAs in the spectral range 835 – 918 nm. It is shown that the inevitable growth of the probe beam power with the sensitivity gain makes spin noise spectroscopy much more perturbative, but, at the same time, opens up fresh opportunities for studying nonlinear interactions of strong light fields with spin ensembles.
pacs:
05.40.-a, 72.25.Rb, 72.70.+mI Introduction
The Faraday-rotation-based spin noise spectroscopy (SNS) first proposed in 1981 AZ survives nowadays its second birth. For the last several years, due to a number of technical advancements, the performance of SNS has been crucially improved in terms of both its sensitivity and its bandwidth Romer ; Muller:2010a ; Crooker:2010 . The potential of this novel technique has been convincingly demonstrated in numerous experimental investigations (see, e.g., review [Muller:2010b, ]). The most impressive achievements were related to application of fast Fourier transform (FFT) spectrum analyzers, which made it possible to shorten the noise signal accumulation time by more than two orders of magnitude. As a result, the SNS technique becomes more and more popular as an efficient experimental tool for studying magnetic resonance and spin dynamics in atomic and solid-state systems OSN .
At the same time, this technique, based on detecting random statistical fluctuations of the spin-system implies measuring of extremely small angles of Faraday or Kerr rotation and, therefore, requires the highest polarimetric sensitivity. The polarimetric sensitivity of optical measurements, defined by the smallest detectable angle of polarization plane rotation, is known to be fundamentally limited by the photon noise of the laser source or, eventually, by the shot noise of the detector photocurrent. This shot-noise limited polarimetric sensitivity in the visible spectral range, being around rad, was achieved in the late seventies of the last century Aleks:1976 ; Jones and now serves as starting point of any experiment on SNS. The main resource of increasing the shot-noise-limited polarimetric sensitivity is related to the possible increase of probe beam power controlling the shot noise level. However, the broadband photodetectors used in the SNS (with a bandwidth of several hundreds of MHz) usually have small photosensitive areas and cannot endure light powers exceeding a few milliwatt. Thus, the possibility of increasing the sensitivity in the most straightforward way, by increasing the probe beam power in the scheme with a standard polarization beamsplitter, appears to be strongly limited. The question is whether one can enhance the polarimetric sensitivity leaving the photocurrent of the detector and, therefore, its shot noise on the same level. We show here that this task can be efficiently solved using schemes with a high level of polarization extinction.
Note that a similar experimental approach has been developed earlier Zap:1979 ; Zap:1982 and was mainly intended for suppression of the excess intensity noise in polarimetric measurements. We attract special attention to potentialities of high-extinction polarimetry because it allows one to increase the sensitivity by a few orders of magnitude through simplest, purely polarization-based, means and surprisingly, has remained up to date unexploited.
II Basic considerations
Let us remind, first of all, how polarimetric sensitivity varies with the angle between the polarization plane of light and the polarizing direction of the analyzer that converts polarization oscillations of the light into oscillations of its intensity. The standard polarization scheme employed in SNS (and, actually, in most high-precision laser polarimeters) uses a polarizing beamsplitter that combines two mutually orthogonal analyzers aligned at with respect to the polarization plane of the incident beam, see Fig. 3(a). The excess intensity noise of the laser source is then suppressed by subtracting the photosignals of the two outputs of the beamsplitter in a balanced detector. In this scheme, the polarization-to-intensity converters operate in the region of greatest steepness of the Malus law, which seems to be most favorable from the viewpoint of polarimetric sensitivity. This is, however, not exactly the case.
Consider an idealized situation when the polarizers are perfect (the Malus law is valid with unlimited accuracy), and the shot noise of the laser light is the only source of noise in the measuring system. Let us write the Malus law in the form
| (1) |
where and are the intensities of the incident and transmitted light, respectively, expressed in the number of photons (or photoelectrons) per second and is the azimuthal angle of the polarizing direction of the analyzer counted from the position of total polarization extinction (“crossed” position). Then, the intensity response to a small rotation of the polarization plane (i.e., amplitude of the signal ) is given by
| (2) |
while the shot noise at a given angle will be proportional to the square root of the transmitted light intensity
| (3) |
So, for the signal-to-noise ratio, we have
| (4) |
Thus, we see that, in this idealized model, the polarimetric sensitivity is the greatest for crossed position (at ) and remains practically the same at small (it varies as ). In particular, at , the sensitivity decreases only by a factor of compared with that at . This means, in turn, that in the framework of this simplified model, the restrictions imposed on the input light power of the photodetectors do not limit the polarimetric sensitivity of the setup: the light power on the detector can always be decreased with no loss of sensitivity (which is controlled only through ) by decreasing the angle . Moreover, when passing from the 45∘ geometry to stronger polarization extinction by decreasing the angle , we can considerably increase intensity of the probe beam (), leaving the light power on the detector () the same.
Of course, in reality, the situation is different. First of all, polarizers are not ideal. Their polarizing properties are characterized by some finite extinction ratio (, by definition, is the ratio at ), usually lying in the range of . So, at small , the Malus law is violated, and the above reasoning becomes inadequate for . Still, in many cases it is quite realistic to increase the probe beam intensity by a few orders of magnitude (leaving the photocurrent the same) and thus to increase the polarimetric sensitivity by one or two orders of magnitude in terms of the angles of Faraday rotation and by 2 - 4 orders of magnitude in terms of the Faraday rotation noise power, provided that the sample under study can withstand the appropriate light power density.
There is one more circumstance that distorts this idealized picture, but, at the same time, provides some additional advantages for the experimentalist. When the laser light exhibits excess intensity fluctuations (which is often the case), the above treatment needs to be corrected. Now, the harmful intensity noise will contain a statistical sum of the shot and the excess noise. It should be taken into account that the excess noise, unlike the shot noise, varies linearly with the light intensity, rather than in a square-root way. So, in the presence of excess intensity noise, we have
| (5) | |||||
Here, is the factor characterizing the amplitude of the excess intensity noise of the incident beam in units of the shot-noise amplitude. Figure 1 shows the dependence of on the angle for several values of the quantity .

It is important that due to different dependencies of the excess and the shot noise on light intensity (and, therefore, on ), there exists an angle for which the two contributions to the noise become comparable, and then, at smaller , the role of the excess noise becomes negligible. As seen from Eq. (5), this points are at , when the light intensity is attenuated through polarization crossing by a factor of . In other words, by crossing the analyzer with the light to be analyzed, we can, to a certain extent, suppress the excess noise of the laser source and thus increase the polarimetric sensitivity.
Summarizing the aforesaid, we conclude that by moving to the geometry of high polarization extinction (HPE) we achieve three goals: suppress the excess intensity noise of the laser source, reduce the input light power on the photodetector down to an acceptable level, and improve the sensitivity due to increased photon flux through the sample. Indeed, by increasing the light power of the probe beam by a factor of and leaving the input power on the detector the same, we can increase the amplitude of the polarimetric signal by a factor of and its power by a factor of . It means that it is possible to increase the detected signal of the noise power in the experiments on SNS by 2 - 3 orders of magnitude. In most cases this looks realistic because the nonperturbative detection of spin noise is usually performed in the region of transparency, where the absorption of the sample is negligibly small and the sample can be exposed to a high laser fluence.
III Polarimetric schemes
There are several ways how to realize a HPE geometry. The most straightforward implies detection of the light intensity behind the analyzer fixed at an appropriate small angle (nearly “crossed” geometry). A drawback of this simple scheme is that after the analyzer all the information about motion of the polarization plane of the incident beam appears to be converted to variations of the light intensity (and the photocurrent), and all resources of suppression of the excess intensity noise appear to be exhausted. There exist, however, polarization schemes that make it possible to additionally suppress the excess noise in the HPE geometry.
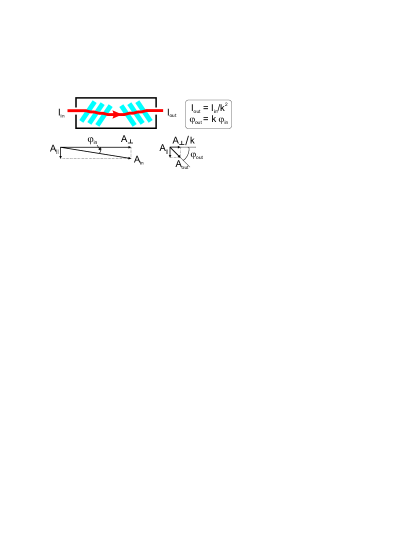
One of them is the so-called polarization pile method Zap:1979 ; Zap:1982 ; pile , when the polarization attenuation of the light beam is achieved by transmitting it through a properly aligned polarization pile, see Fig. 2. In this case, the detected small angle of the polarization plane rotation appears to be magnified by a factor equal to the square root of intensity attenuation. This operation, in accordance with the aforesaid, allows one to suppress the excess intensity noise, but retains the possibility to suppress it further with the aid of a balanced detector. This opportunity is important for noisy laser sources, because the polarization extinction, in reality, can suppress the excess noise only by 1 - 2 orders of magnitude, as opposed to 4 orders of magnitude of noise suppression accessible for a balanced detector Aleks:1976 ; Arg .
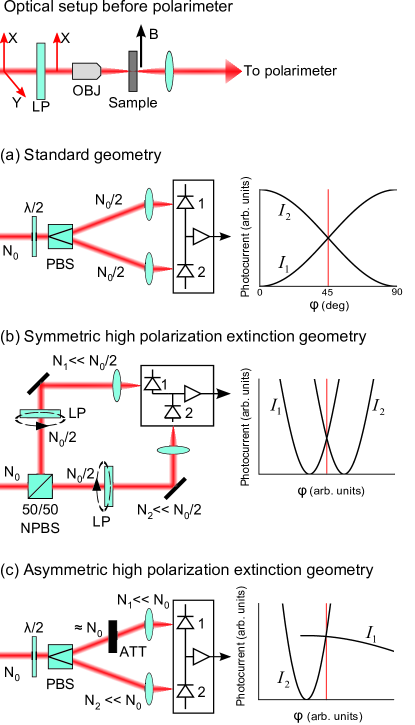
There are other polarization schemes that combine polarization extinction with excess noise subtraction. Figure 3 shows two possible arrangements of this kind, (b) and (c), together with the standard 45∘ scheme in Fig. 3(a).
For the symmetric case of the HPE geometry shown in Fig. 3(b), the analyzed laser beam is first split by a polarization-insensitive beamsplitter into two beams of equal intensity (50/50). Then both components are attenuated by polarizers and coupled to inputs of the balanced detector. This scheme, proposed earlier for suppressing the excess intensity noise (see Ref. [Zap:1982, ]), actually reproduces the standard scheme (a) with stronger polarization extinction in each of the two arms.
The other possible arrangement, Fig. 3(c), the asymmetric case of the HPE geometry, can be easily obtained from the standard 45∘ scheme (Fig. 3(a)), by setting the polarization beamsplitter into a strongly disbalanced position by using the -plate. The intensity in the arm with low polarization extinction is then attenuated by any optical filter to achieve the balance. This scheme is highly attractive due to its simplicity, because it can be easily obtained from the standard 45∘ geometry practically without changes in the setup. From the viewpoint of sensitivity, these two geometries ((b) symmetric and (c) asymmetric) are practically equivalent. More precisely, as can be shown by simple calculations, the signal-to-noise ratios for the two schemes are proportional to the factors:
| (6) | |||||
| (7) |
respectively, and differ at small (when the high-extinction polarimetry makes sense) by a factor of , in favor of the symmetric case.
In what follows, we demonstrate experimentally the efficiency of the HPE schemes and discuss the increasing perturbativeness of SNS with increasing light power density on the sample at high levels of polarization extinction. Since the main part of the measurements was performed using the “symmetric” scheme (Fig. 3(b)), we will call this geometry simply HPE, unless specified otherwise.
IV Experimental
The experiments were performed with a well-studied bulk sample of :GaAs (sample B in Ref. [CrookerPRBbulk, ]). The antireflection-coated single crystal, 170 m in thickness, with an electron density of cm-3 was mounted on the cold finger of a continuous flow helium cryostat at a temperature of 5 K. A linearly polarized light beam of a frequency-stabilized Ti:sapphire continuous-wave ring laser with the wavelength tuned below the GaAs bandgap ( nm) was focused onto the sample with a microscope objective (upper sketch in Fig. 3). The diameter of the light spot on the sample was estimated to be about 10 m. The light beam transmitted through the sample (see Fig. 3) passed through the beamsplitter (either polarizing or polarization-insensitive, depending on the type of the polarimetric scheme), and, after appropriate polarization treatment, was detected by a 650 MHz balanced photoreceiver (New Focus 1607). The output signal of the photoreceiver was amplified by 20 dB and sent through a 580 MHz low pass filter (to avoid any undersampling) to a fast digitizer (2 GS/s) with a 1 GHz FFT processing unit implemented on a field programmable gate array (FPGA). The system made it possible to process and average the Fourier spectrum of the noise power density in real time (for more details see Ref. [Crooker:2010, ]).
The Faraday rotation noise spectra were measured in a transverse magnetic field of 34 mT, so that the Larmor frequency of the electron spins (-factor ), corresponding to the central position of the spin noise resonance, lied in the range of 200 MHz. To extract the signal we interleaved the applied fields between 34 and 130 mT, so that the spin noise resonance at the higher field was shifted beyond the bandwidth of the detector, leaving the background noise unaffected. The calibrated signal () was obtained by dividing the spectrum with the noise resonance at 200 MHz () by the one with the resonance shifted to higher frequencies ():
| (8) |
Since the main contribution to the background noise power, for our conditions, comes from the shot noise, the signal calculated in this way directly gives the spin noise in units of the shot noise power.
If not otherwise stated, the light power at the input of the balanced detector was 1.5 mW per channel. The accumulation times in the measurements were varied between 1 and 3 minutes depending on the signal amplitude.
V Results and discussion
V.1 Standard geometry
Measurements of spin noise in the classical geometry (Fig. 3(a)) performed in the spectral range 835 - 865 nm were aimed at obtaining reference spectra for comparison with the results of application of the high-extinction polarization schemes.
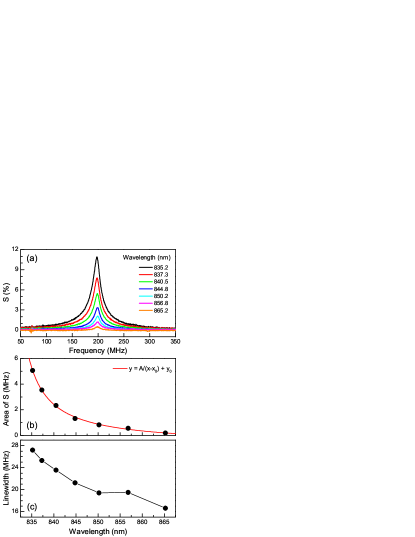
Figure 4 shows the evolution of the spin noise (SN) power spectrum (, see Eq. (8)) with the light wavelength (a), the wavelength dependences of the integrated signal (b), and the spin resonance linewidth (full width at half maximum) (c). As expected CrookerPRBbulk , the amplitude of the SN power rapidly decreases with increasing wavelength of the probe beam (approximately inversely proportional to the detuning from the band edge, see Fig. 4(b)). Starting with about 11 % of the spin noise power amplitude at 835 nm, we ended up with only 0.6 % at 865 nm, where the resonance peak could still be reliably detected with the used accumulation times. The only resource of sensitivity remaining in this polarimetric scheme is related to increasing the integration time , which may improve the signal-to-noise ratio in accordance with its square-root dependence on .
The linewidth was extracted by fitting the curves in Fig. 4(a) with a single Lorentzian. The increase in the linewidth from 16.6 MHz at 865 nm to 27.2 MHz at 835 nm qualitatively coincides with the known experimental data CrookerPRBbulk and thus reflects the perturbative effect of the probe beam. At the same time, the absolute values of the widths appear to be larger than reported in Ref. [CrookerPRBbulk, ]. We ascribe this difference to the smaller size of the spot created by the microscopic objective and, correspondingly, to a higher power density, which, in our experiment was about 6 kW/cm2 as compared with 1 kW/cm2 in Ref. [CrookerPRBbulk, ]. In addition, the light spot diameter of the laser beam was comparable with the diffusion length of electrons in this sample, which should be on the order of 10 m [DiffusionLength, ] and may additionally contribute to the line broadening.
V.2 High polarization extinction geometries
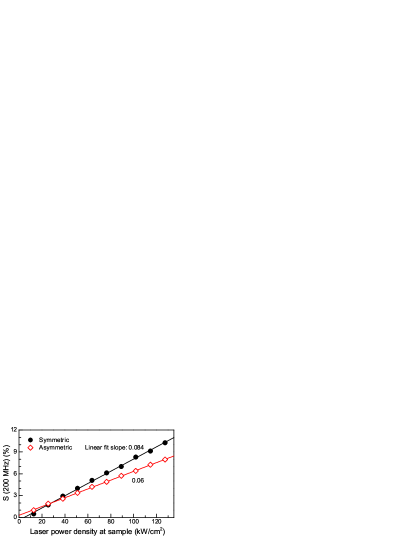
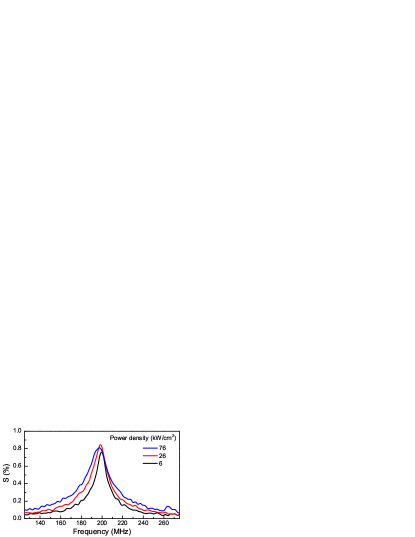
The HPE schemes imply increasing intensity of the laser probe with simultaneous polarization attenuation of the input light on the photodetector. So, for our first demonstration of efficiency of this technique in detecting SN spectra of :GaAs, we have chosen a wavelength of 865 nm, at which the SN resonance measured in standard geometry, at a laser power density of 6 kW/cm2 was below 1% of shot noise. Figure 5 shows the results of the measurements in the range of laser power density up to 130 kW/cm2 (corresponding to 100 mW for 10 m spot), measured before the sample.
One can see a drastic enhancement of the signal, from 1 to 10 , with increasing laser power by a factor of 10, Figs. 5(a) and 5(b). It is important, that this growth of the signal exactly corresponds to the growth of the signal-to-noise ratio, because the shot-noise level is controlled by the noise of the detector photocurrent, which, at a fixed incident power of 1.5 mW per channel, remains the same. It should be noted, that these measurements were made in the range of angles not smaller than 0.2 rad, i.e., still far from the limit imposed by the performance of the polarizers. In other words, the resources of polarimetric sensitivity, in these experiments, are far from being exhausted. The linear dependence of the SN signal on the laser power density in Fig. 5(b) fully corresponds to the description presented in Sec. II.

Of course, one should bear in mind that the gain in sensitivity does not come for free. The increasing polarization extinction is needed to attenuate the growing photon flux that probes the sample and may strongly perturb it. Indeed, the increase of the probe beam power increases the perturbative broadening of the spin resonance, noticeable even at lower intensities in this spectral range in the standard geometry (Fig. 4(c)). With increasing power density, the spin resonance linewidth varies approximately in a square-root way from 22.3 MHz at 13 kW/cm2 to 37 MHz at 130 kW/cm2, see Fig. 5(c). This broadening noticed in Ref. [CrookerPRBbulk, ] is presumably related to residual absorption of the :GaAs crystal, which remains essential even at large detuning. We also suspect that the square-root dependence of the spin resonance linewidth detected in the SN spectrum is not incidental and may reflect a linear dependence on the light field amplitude (or on the Rabi frequency), characteristic of certain processes of resonant interaction of a monochromatic wave with inhomogeneously broadened ensembles Khodovoi . This assumption can be confirmed or rejected only after additional experimental and theoretical studies.
Additional information about light-induced broadening of the spin-noise spectra and their behavior at large detuning was obtained from spectral measurements performed in a much wider range of wavelengths, accessible due to enhanced sensitivity. The measurements were performed in the HPE geometry at a laser power density of 76 kW/cm2. Starting at 835 nm, to have a direct comparison with the standard 45∘ scheme at the power density of 6 kW/cm2, it was possible to extend the wavelength range up to 918 nm, still having of signal amplitude (in units of the shot noise power). The results of these measurements, shown in Fig. 6(a), demonstrate, as we believe, in a spectacular way the potential of the new experimental approach.
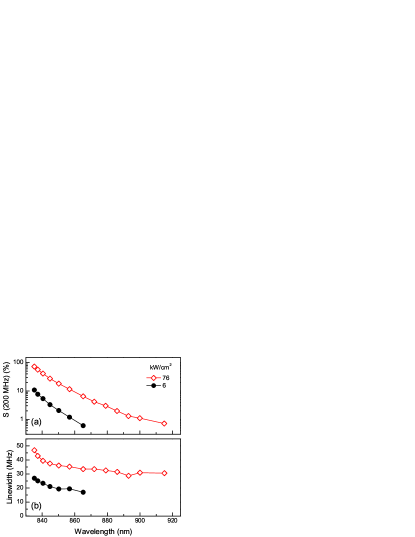
Under conditions of a fixed input power on the detector, the increase of the detected spin noise power in the high-extinction geometry, as was already mentioned, exactly corresponds to the increase in the signal-to-noise ratio. Due to increasing absorption at wavelengths shorter than 845 nm, the polarization extinction, needed to maintain the same laser power on the detector, slightly decreases, thus decreasing the gain in sensitivity. This, however, did not distort noticeably the results of the measurements in the short-wavelength region where the signal amplitude, , measured in this geometry exceeded .
Figure 6(b) shows the dependence of the linewidth versus wavelength over a wide spectral range. Along with the total increase of broadening at higher laser power densities, we see, in a more impressive form, the characteristic spectral dependence of the broadening effect. A remarkable feature of this dependence is that it becomes practically wavelength-independent at longer wavelengths. It also correlates with the assumption that the light-induced broadening of the SN spectra is related to the effects of non-resonant perturbation of the spin-system through optical absorption, rather than to resonant effects, which should become sensitive to detuning.
For completeness of the methodological analysis of polarimetric sensitivity, we performed measurements in both HPE geometries considered above – symmetric (Fig. 3(b)) and asymmetric (Fig. 3(c)). The results of the measurements shown in Fig. 7 completely agree with our previous conclusions. As mentioned above (see Eqs. (6) and (7)), at small , the signal-to-noise ratio in the symmetric scheme appears to be higher by a factor of than in the asymmetric scheme. As the laser power is decreased, the angle is increased to keep the power on the diodes constant. This corresponds to a lower level of polarization extinction, where the approximation of small is violated, and starting from rad (when ) the asymmetric geometry becomes more preferable. Indeed, in the vicinity of this angle, which corresponds to a probe power density of 30 kW/cm2, the two experimental dependencies, approximated by straight lines, intersect. At these angles, however, the HPE geometry, which implies strong polarization attenuation of the light intensity, looses its sense.
V.3 Thermal effects
To evaluate possible thermal effects in the apparent enhancement of the SN signal (which we attributed entirely to enhancement of polarimetric sensitivity) we performed a simple experiment: in the measurements made in the standard 45∘ scheme, we varied the light intensity on the sample keeping the intensity before the beamsplitter on the same level (3 mW). In this case, we have no polarization enhancement, and, in the absence of any optical nonlinearity, all the spectra recorded in this way should be identical. The results of these measurements presented in Fig. 8 show, however, an increase in the linewidth for higher laser powers without any essential changes in the amplitude of the signal. It means, that even if the sample were heated by the high laser power, this could not lead to the observed dramatic changes in the signal magnitude, as shown in Fig. 5(a).
Additional information about the role of thermal effects in formation of the SN spectra was obtained from studies of the temperature dependence in the range 3 – 25 K. The measurements were performed with the laser beam power density on the sample varying from 6 to 76 kW/cm2. The results are presented in Fig. 9.
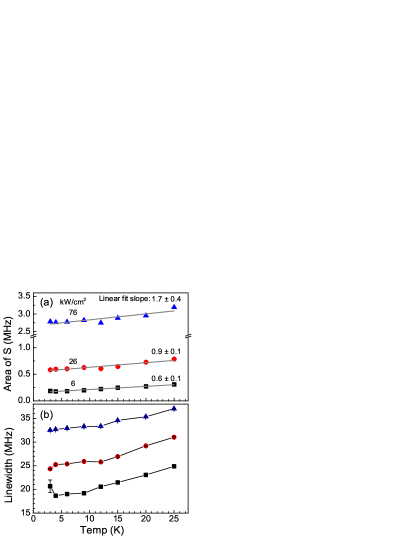
For our sample, it is known that only a fraction of the total number of electrons within the thermal energy around the Fermi energy can fluctuate CrookerPRBbulk . As seen from Fig. 9(a) the SN area for all power densities depends linearly on temperature, having very similar slopes. It is therefore reasonable to assume, that the increased laser power does not induce local heating of the electron system, which would increase the contributing range (i.e. the number) of fluctuating electrons, and therefore reduce the effect of the external temperature increase.
At high laser powers, the SN area increases much more than any temperature in the studied temperature range may provide, as one can see from Fig. 9(a). One can also see from Fig. 9(b) that the linewidth of 32 MHz observed at 76 kW/cm2 at 4 K, could be achieved with 6 kW/cm2 at around 50 K only. So, it seems highly probable that the nature of the light-induced perturbation of the SN spectrum in this case is not related to effects of thermal heating, while the responsible mechanism remains obscure.
VI Conclusions
In this paper we have shown how application of HPE geometries may widen the possibilities of the Faraday-rotation-based spin noise spectroscopy. The main merit of the HPE schemes arises from the opportunity to increase the intensity of the probe laser beam and, correspondingly, to increase the ultimate polarimetric sensitivity controlled by the photon noise, without increasing the photon flux incident on the photodetector. This additional degree of freedom, which is absent in the commonly applied 45∘ polarization geometry, affects simultaneously two characteristics of the measurement system: it enhances the polarimetric sensitivity and increases the level of perturbation of the spin-system by the probe beam. The SNS technique, evidently, ceases to be “nonperturbative”, but acquires new qualities, which it initially was not intended for: It turns into a tool for studying processes of nonlinear interaction of strong optical fields with spin-systems. We demonstrate here this possibility by experimental studies of SN spectra of :GaAs.
We consider the proposed experimental approach to be highly important for the further development of spin noise spectroscopy and for broadening the scope of its application. Suffice it to say that the gain in sensitivity provided by the HPE schemes may be as high as that achieved with the advent of FFT spectrum analyzers, which had brought a real breakthrough into the field of the spin noise spectroscopy. Now, in combination with the most advanced methods of data acquisition, SNS will be able to considerably widen the range of objects for study and the scope of physical problems amenable to this technique.
Acknowledgements
The authors thank S. A. Crooker for fruitful discussions and for providing the sample. This research was supported by the Deutsche Forschungsgemeinschaft and BMBF. The financial support from the Russian Ministry of Education and Science (contract No. 11.G34.31.0067 with SPbSU and leading scientist A. V. Kavokin) is acknowledged. V. S. Z. acknowledges support through a Gambrinus fellowship of TU Dortmund University.
References
- (1) E. B. Aleksandrov and V. S. Zapasskii, J. Exp. Teor. Phys. 54, 64 (1981).
- (2) M. Römer, J. Hübner, and M. Oestreich, Rev. Sci. Instrum. 78, 103903 (2007).
- (3) M. Römer, H. Bernien, G. Müller, D. Schuh, J. Hübner, and M. Oestreich, Phys. Rev. B 81, 075216 (2010).
- (4) S. A. Crooker, J. Brandt, C. Sandfort, A. Greilich, D. R. Yakovlev, D. Reuter, A. D. Wieck, and M. Bayer, Phys. Rev. Lett. 104, 036601 (2010).
- (5) G. Müller, M. Oestreich, M. Römer, and J. Hübner, Physica E 43, 569 (2010).
- (6) V. S. Zapasskii, A. Greilich, S. A. Crooker, Yan Li, G. G. Kozlov, D. R. Yakovlev, D. Reuter, A. D. Wieck, and M. Bayer, Phys. Rev. Lett. 110, 176601 (2013).
- (7) E. B. Aleksandrov and V. S. Zapasskii, Opt. Spectrosc. 41, 502 (1976).
- (8) R. V. Jones, Proc. Roy. Soc. 349, 423 (1976).
- (9) V. S. Zapasskii, Opt. Spectrosc. 47, 450 (1979).
- (10) V. S. Zapasskii, J. Appl. Spectrosc. 37, 857 (1982).
- (11) M. Lintz, J. Guena, M.-A. Bouchiat, and D. Chauvat, Rev. Sci. Instrum. 76, 043102 (2005).
- (12) V. S. Zapasskii, Opt. Spectrosc. 52, 667 (1982).
- (13) S. A. Crooker, L. Cheng, and D. L. Smith, Phys. Rev. B. 79, 035208 (2009).
- (14) M. Furis, D. L. Smith, S. Kos, E. S. Garlid, K. S. M. Reddy, C. J. Palmstrøm, P. A. Crowell, and S. A. Crooker, New J. Phys. 9, 347 (2007).
- (15) V. G. Abramov, O. V. Konsyanyinov, N. N. Kostin, and V. A. Khodovoi, Sov. Phys. JETP 26, 503 (1968).