The Hierarchical Origins of Observed Galaxy Morphology
Abstract
Galaxies grow primarily via accretion-driven star formation in discs and merger-driven growth of bulges. These processes are implicit in semi-analytical models of galaxy formation, with bulge growth in particular relating directly to the hierarchical build-up of halos and their galaxies. In this paper, we consider several implementations of two semi-analytical models. Focusing on implementations in which bulges are formed during mergers only, we examine the fractions of elliptical galaxies and both passive and star-forming disk galaxies as functions of stellar and halo mass, for central and satellite systems. This is compared to an observational cross-matched SDSS RC3 (SDSSRC3) sample of galaxies with accurate visual morphological classifications and . The models qualitatively reproduce the observed increase of elliptical fraction with stellar mass, and with halo mass for central galaxies, supporting the idea that observed ellipticals form during major mergers. However, the overall elliptical fraction produced by the models is much too high compared with the data. Since the “passive” – i.e. non-star-forming – fractions are approximately reproduced, and since the fraction which are star-forming disc galaxies is also reproduced, the problem is that the models overproduce ellipticals at the expense of passive S0 and spiral galaxies. Bulge-growth implementations (tuned to reproduce simulations) which allow the survival of residual discs in major mergers still destroy too much of the disc. Increasing the lifetime of satellites, or allowing significant disc regrowth around merger remnants, merely increases the fraction of star-forming disc galaxies. Instead, it seems necessary to reduce the mass ratios of merging galaxies, so that most mergers produce modest bulge growth in disc-galaxy remnants instead of ellipticals. This could be a natural consequence of tidal stripping of stars from infalling satellite galaxies, a process not considered in our models. However, a high efficiency of quenching during and/or subsequent to minor mergers is still required to keep the passive fraction high.
1 Introduction
Galaxy morphology has long been known to correlate strongly with local environment (Melnick & Sargent, 1977; Dressler, 1980; Postman & Geller, 1984; Wilman et al., 2009; Bamford et al., 2009; Wilman & Erwin, 2012) and stellar mass (Bamford et al., 2009; Vulcani et al., 2011a; Wilman & Erwin, 2012). This relates both to the structural components of galaxies (bulge, disc, spiral arms, bar, Hubble, 1926) and to star formation (correlated with spiral structure, with low or zero star formation rates in early type galaxies, Sandage & Visvanathan, 1978; Sellwood, 2011).
Simulations show that elliptical galaxies and classical (pressure-supported) bulges in galaxies can be formed when galaxies merge (e.g. Barnes, 1988; Springel, Di Matteo & Hernquist, 2005). In a hierarchical, cold dark matter dominated universe, dark matter halos build up through regular mergers and smooth accretion (Lacey & Cole, 1993; Genel et al., 2010; Wang et al., 2011). Galaxies which have grown at the centre of merging halos will then orbit within the conglomerate global potential, experience tidal stripping, and eventually, through dynamical friction, sink towards the bottom of the remnant halo where they will merge. At this point a classical bulge or elliptical galaxy may form through violent relaxation (Lynden-Bell, 1967). The implication is that elliptical and classical bulge formation relates directly to the hierarchical growth of structure in the universe. As such, the abundance, mass and environmental dependence of ellipticals and classical bulges can be quantified in the context of dark matter simulations, provided halos and their merger trees can be realistically populated with galaxies.
Semi-analytic models of galaxy formation (e.g. White & Frenk, 1991; Bower et al., 2006; Monaco, Fontanot & Taffoni, 2007; De Lucia & Blaizot, 2007) provide a self-consistent, physically motivated framework to understand the hierarchical evolution of galaxies, and connect this to their morphological evolution. Physically motivated prescriptions for cooling and heating of gas and its conversion to stars are applied to halo merger trees, tracking the star formation and merger-related growth of galaxies (See Baugh, 2006, for a review of these techniques). This framework provides an ideal way to examine the resultant distribution of galaxy properties such as stellar mass (), bulge to total ratio () and star formation rates (SFR), as well as their dependance on each other, and on environment at a given redshift slice. Comparison with observations then allows one to place constraints on the physical processes governing the baryonic assembly and merger-induced (classical) bulge growth in galaxies.
This paper presents such a comparison. We have considered several bulge formation implementations which have been applied to two models of galaxy formation (De Lucia et al., 2011, hereafter DL11). As described by DL11, these models provide us with an ideal tool to examine how dynamical friction, bulge growth and star formation histories bring about a model galaxy’s and SFR at , and their dependence on stellar and halo mass. Our models have also been applied to compare the predicted abundance of bulgeless galaxies to their observed abundance (Fontanot et al., 2011a) and the differences in merger history of elliptical-rich clusters to that in elliptical-poor clusters (De Lucia, Fontanot & Wilman, 2012). In DL11 we find that the alternate method of forming bulges via the instability of discs is currently ill-constrained in models. This motivates our choice in this paper to emphasize model implementations in which the disc instability mode is switched off, and bulges only grow during mergers.
In Section 2 we present our models, outlining the key physical processes important for this analysis. We have also constructed a local sample of galaxies with visual morphological classifications (Wilman & Erwin, 2012, hereon WE12), and with well defined stellar masses and environments. This sample is presented in Section 3. In Section 4 we examine the distribution of model galaxies in versus , compared with recent observations. Then in Section 5.1 we examine the dependence of elliptical fraction, separately for central and satellite galaxies, on stellar and halo mass. In Section 5.2 we examine the fraction of star-forming disc, and passive disc galaxies in the same way, and in Section 5.3 we examine the total passive fraction. The results presented in Section 5 motivate our interpretation of how observed galaxy morphology and star formation are imprinted by hierarchical growth, and of the remaining deficiencies in the physical prescriptions of our models. This interpretation is presented in Section 6. We summarize and discuss the prospects for improving our models in Section 7.
2 Models
We examine the origin of galaxy morphology in the context of two independently developed semi-analytic models of galaxy formation. These are the Munich model, as implemented by De Lucia & Blaizot (2007) and generalized to WMAP3 cosmological parameters, as discussed by Wang et al. (2008) (we refer the reader to this model as WDL08), and the morgana model (Monaco, Fontanot & Taffoni, 2007) adapted to a WMAP3 cosmology by Lo Faro et al. (2009). Comparisons between these models have been presented in Fontanot et al. (2009), Fontanot et al. (2011b), De Lucia et al. (2010) and DL11, and we refer the reader to these papers for more details.
WDL08 assumes a cosmology with , , , and while morgana assumes , , , and . For the purposes of this paper, these small differences in cosmology have a negligible effect on results.
In this Section we consider the aspects most pertinent to galaxy morphology and therefore the results presented in this paper. These include the bulge formation implementations (Section 2.1) and survival time of satellites (Section 2.2). We also briefly overview key results from DL11, relevant to our analysis (Section 2.3).
2.1 Bulge Formation Implementations
Models assume gas to cool onto a disc, which then forms a stellar disc via star formation. The formation of bulges requires the loss of angular momentum, which happens either when galaxies merge or when discs become unstable.
DL11 (to which we refer for further details) presented three implementations for bulge formation, each applied to both WDL08 and morgana models. The standard implementations are those applied by default to both models, in which bulges form via both disc instabilities and galaxy mergers. The pure mergers implementations exclude disc instabilities so that we can isolate the effects of galaxy mergers.
In a major merger (baryonic mass ratio ) the standard and pure-merger implementations put all pre-existing stars into the bulge of the remnant galaxy, thus forming an elliptical with by definition. The cold gas from both progenitors fuels a starburst which adds to this bulge mass. The galaxy can then grow a new disc at later times from gas accreted onto the remnant.
Disc instabilities are treated differently in the two models. When the instability criterium is met (see DL11), WDL08 transfers just enough stellar mass to the bulge to restore stability, while morgana transfers half of the baryonic mass to the bulge. This leads to a much stronger role for disc instabilities in the formation of massive bulges in morgana than in WDL08, with the standard bulge growth implementations.
Both models include the option of using the HOP09 implementation, which are a modification of the pure-mergers case, tuned to the results of idealized merger simulations from Hopkins et al. (2009). The two major differences between this and the standard pure-merger approach relate to the treatment of stars and gas in a major merger. A fraction of the stellar disc from the more massive (primary) progenitor survives the merger. Also, only a fraction of the cold gas from the primary progenitor goes into the starburst; the remaining gas is retained by the disc of the remnant where normal star formation subsequently takes place. The starbursting gas fraction decreases with increasing total gas fraction and increases with increasing mass ratio. These implementations tend to leave residual stellar and gas discs which would be completely destroyed during a major merger in the standard or pure-merger prescriptions.
2.2 Satellite survival time
Once a smaller halo is accreted onto a larger one it becomes a subhalo, and the galaxy at its centre is now considered a satellite of the parent halo. Dynamical friction draws the subhalo towards the parent halo’s core. As the subhalo moves into regions of higher surrounding density, tidal stripping becomes more effective. This reduces the subhalo mass, and increases the efficiency of dynamical friction: these two effects are intertwined. Eventually the satellite galaxy reaches the centre of the parent halo, where it merges with the central galaxy. We denote the time from accretion of the subhalo (when the galaxy becomes a satellite) until the galaxies merge the satellite survival time or .
This timescale is clearly important: shorter timescales will lead to more mergers and fewer satellites, and less time for satellite-specific processes to act. However, it varies significantly between different numerical determinations.
WDL08 defines merger trees for subhaloes, that are identified in the N-body simulation using the algorithm subfind (Springel et al., 2001). The merger trees are then constructed using a dedicated software that is the same developed to analyse the Millennium Simulation. Subhaloes are tracked until they are tidally stripped to a point at which they can no longer be resolved. The semi-analytic model then assigns a residual survival time to the “orphaned” satellite galaxy according to a dynamical friction formula.
In morgana, the code pinocchio (Monaco, Theuns & Taffoni, 2002; Taffoni, Monaco & Theuns, 2002) which is based on Lagrangian perturbation theory, is used to construct mass assemly histores of dark matter halos which are then populated using the morgana semi-analytic model. As pinocchio does not follow the evolution of substructures, a (slightly updated) version of the fitting formulae provided by Taffoni et al. (2003) are applied to compute . This interpolates between the cases of a ’live satellite’ (in which the subhalo experiences significant mass loss) and a ’rigid satellite’ (with no mass loss). In the version of morgana used in this paper, stellar stripping is not included. Initial orbital parameters for satellite galaxies are randomly extracted from suitable distributions. In contrast to WDL08, the clock for satellite survival (and its orbit) is reset after every DM halo major merger.
De Lucia et al. (2010) examined the implied dynamical friction timescales of these and other models as a function of the progenitor mass ratio , and found them to be widely variant. In particular, massive satellites with survive for an order of magnitude longer by WDL08 than for morgana.
In DL11, we examined the effects of a longer dynamical friction time for morgana by using the longer dynamical friction timescale from WDL08. We shall also consider this adaptation of the morgana model in this paper. However, we emphasize that this version of the morgana model has not been recalibrated to fit other observables, and so these results should be interpreted with caution. We also stress that even when adopting the same formula used in WDL08 in morgana, satellite survival times will not be identical because of different assumptions adopted in the two models. For details, we refer the reader to De Lucia et al. (2010).
2.3 DL11: A Summary of Results
In DL11 we found a strong correlation between galaxy bulge fraction () and stellar mass, and between bulge fraction and halo mass for central galaxies, such that central galaxies of halos are bulge-dominated. This is a direct consequence of the richer merger history for more massive galaxies which live at the centre of a more massive halo.
We examined the different channels for bulge growth, and found that major mergers dominate bulge growth of galaxies, while minor mergers produce comparible bulge mass in more massive galaxies. However, the vast majority of bulge-dominated () galaxies acquired their high bulge fractions through major mergers. In the standard implementations for bulge growth, disc instabilities dominate the formation of bulges in intermediate mass galaxies () and can also lead the the formation of bulge-dominated galaxies at high redshift in the morgana model.
In our models, bulge-dominated galaxies can grow a new stellar disc: hot gas cools to form a new cold gas disc which then forms new stars. DL11 showed that this disc regrowth rate is highest in intermediate mass galaxies () and increases with redshift. The fraction of bulge-dominated central galaxies regrowing a disc depends on the model. The fraction of morgana central galaxies experiencing regrowth increases with time to almost at , while the corresponding fraction for WDL08 decreases to at for , with lower fractions at high mass. Although large numbers of galaxies experience disc regrowth, the rate of regrowth is modest, particularly at low redshift. Both models implement a radio-mode AGN feedback, but this is particularly efficient in the WDL08 model. This suppresses the cooling of the hot gas with an efficiency which is a strong function of halo mass. Thus the most massive galaxies which live at the centre of the most massive halos, especially at low redshift, experience a stronger feedback and less regrowth of their discs.
3 The SDSSRC3 sample
While there now exist large samples of classified galaxies in the local Universe, our goals require the identification of galaxies with significant discs: this means it is essential to separate elliptical from S0 morphological types. This division was not considered, for example, in the initial Galaxy Zoo classification scheme (Lintott et al., 2008; Bamford et al., 2009).
In WE12 (Wilman & Erwin, 2012) we constructed a sample of galaxies with robust morphological classification based upon the New York University Value Added Galaxy Catalog (NYU-VAGC, Blanton et al., 2005) who matched the SDSS DR4 (Sloan Digital Sky Survey Data Release 4, Adelman-McCarthy et al., 2006) to the Third Reference Catalog of Bright Galaxies (RC3, de Vaucouleurs et al., 1991). This provides Hubble-type morphological classifications for 1194 galaxies with B-magnitudes , including 165 galaxies which we have re-classified and 55 which are classified for the first time (based on SDSS imaging). As described by WE12, we weight galaxies to correct for the RC3 selection bias as a function of -band magnitude and the radius containing 50% of the Petrosian flux in r-band, and to correct for Malmquist bias ().
We calculated stellar masses for each galaxy using the color-based mass-to-light () ratios of Zibetti, Charlot & Rix (2009), using SDSS colors and -band absolute magnitudes (including the necessary k-corrections). Stellar masses have been corrected for over-subtraction of the SDSS sky background, which is significant for galaxies larger than , where is the radius containing half the -band Petrosian flux (Blanton et al., 2011).
In WE12 we examine the galaxy population limited to , corresponding to a red galaxy with a stellar mass . For this paper we have checked that for galaxies , the morphological composition is almost identical with or without an additional cut in luminosity at . To keep interpretation simple, we have chosen to apply just the cut in stellar mass. This leaves us with 854 galaxies in the sample.
We take halo masses from the Sample II group catalog of Yang et al. (2007) constructed from the SDSS-DR4. We refer the reader to Yang et al. (2007) and WE12 for a full description of this catalogue and its application to our sample. In brief: a friends-of-friends linking algorithm is used to assign galaxies to groups, which are then assigned halo masses based upon the rank order in terms of the group total stellar mass of all galaxies brighter than an evolution and k-corrected r-band absolute magnitude of . An isolated galaxy with this limiting luminosity is assigned a halo mass of , which is therefore the Yang et al. (2007) halo mass limit, while an isolated early-type galaxy with a stellar mass has a halo mass of , which therefore sets our halo mass limit.
Galaxies with the highest stellar mass in each group are distinguished from the rest of the group population under the assumption that they live at the bottom of the group’s potential well (central galaxies), whilst the remainder orbit within this potential (satellite galaxies). Whilst the reality of group dynamics is likely more complicated (see e.g. Skibba et al., 2010), this provides a suitable comparison sample for our model population for which central and satellite galaxies are treated differently. Of the 854 galaxies meeting the stellar mass cut () 810 have estimated halo masses from Yang et al. (2007), of which 665 are centrals and 145 are satellites. In any group catalogue, there will be some misclassification of infalling central galaxies as satellites, or massive satellite galaxies as centrals. This will only serve to reduce differences between the satellite and central population in observations when compared to the models.
Central galaxies can be found in halos down to the sample limit of . A satellite galaxy of the same stellar mass has at least one more massive galaxy in the halo – as discussed in Section 2.8 of WE12, early-type satellites can reside in halos down to .
Table 1 presents the morphological classifications for our SDSSRC3 sample.
| Name | RA | Dec | z | log | RC3 Morphology | WE12 Morphology |
|---|---|---|---|---|---|---|
| IC25 | 7.800383 | -0.407338 | 0.0194 | 10.52 | .L?…. | .L?…. |
| NGC223 | 10.566143 | 0.845477 | 0.0179 | 10.89 | PSBR0*. | PSBR0*. |
| NGC548 | 21.510454 | -1.225612 | 0.0180 | 10.70 | .E+..*. | .E….. |
| UGC1072 | 22.433275 | -1.241424 | 0.0173 | 10.90 | .L….. | .L….. |
| UGC1120 | 23.510277 | -1.075758 | 0.0155 | 10.62 | .SB.2P/ | .SB.2P/ |
| NGC1194 | 45.954587 | -1.103726 | 0.0136 | 11.21 | .LA.+*. | .P….. |
| NGC359 | 16.070688 | -0.764911 | 0.0179 | 10.95 | .L..-*. | .E….. |
| NGC364 | 16.170124 | -0.802756 | 0.0171 | 11.14 | RLBS0*. | RLBS0*. |
| UGC1698 | 33.082046 | -0.811519 | 0.0408 | 11.47 | PSBR1*. | PSBR1*. |
| NGC856 | 33.409837 | -0.717291 | 0.0201 | 11.04 | PSAT0*. | PSAT0*. |
Luminosity distances are computed assuming a CDM cosmology with , and .
3.1 Passive Galaxies
Although WE12 paid particular attention to the relative fractions of S0 galaxies versus those of spirals and ellipticals, there is no way to identify which model galaxies with discs currently have spiral structure (the key feature distinguishing spirals from S0s). Instead, we will concentrate in this paper on 1) identifying which galaxies are elliptical; and 2) distinguishing which disc galaxies are active and which are passive in terms of current star-formation activity.
To define star formation activity, we use the MPA-JHU DR7 calibration of total specific star formation rates (SSFR, the rate of star formation per unit stellar mass) for SDSS galaxies.111http://www.mpa-garching.mpg.de/SDSS/DR7/ The total SSFR is computed based on the fiber spectroscopy plus a correction which attempts to estimate the star formation outside the fiber aperture.
Emission lines can only be used to calibrate SSFR where there is no additional source of ionizing radiation. The MPA-JHU catalogue includes spectral classification of galaxies, defined using emission line ratios. This classification – based on the versus BPT diagram (Baldwin, Phillips & Terlevich, 1981) – affects how the SSFR is estimated. Galaxies are defined in this scheme as star-forming if they lie on the tight locus of normally star-forming galaxies (Kauffmann et al., 2003). Galaxies with a harder radiation field (higher ratios of and ) are further subdivided depending on whether the line ratios are within the range of Kewley et al. (2001) starburst models. Those which are, are labelled composite while galaxies with the hardest radiation fields are labelled AGN. As illustrated in Figure 9 of WE12, some of these have Seyfert nuclei, but most contain Low Ionization Nuclear Emission-line Regions (LINERS).
Using the fiber spectroscopy, the star formation rate for galaxies spectroscopically classified as star-forming is estimated from emission-line modelling. For galaxies with AGN or composite spectra, and galaxies with no emission lines, the star formation rate is instead estimated using the D4000n feature (the strength of the break in the spectrum at 4000Å). The strength of this break depends upon the presence of young ( old) stars which add flux to the blue part of the spectrum, weakening the break. This can be compared to the very young ( old) massive stars which are hot enough to ionize the surrounding gas which then emits light via recombination lines (such as H). Clearly these two methods trace star formation on very different timescales.
The MPA-JHU DR7 calibrations include an improved method for aperture corrections compared to the published DR2 version (Brinchmann et al., 2004). Star formation rates outside the SDSS fibre are estimated by modelling the observed broad-band colours.
We choose to define galaxies with SSFR yr-1 ( Gyr-1, i.e. below the past averaged star formation rate at ) as passive, for the purposes of comparison with the model galaxies. This level is consistent with definitions of “passive” commonly used in the literature (e.g. Weinmann et al., 2010; McGee et al., 2011).
We now take a moment to consider the distribution of observed galaxies in derived SSFR, spectral classification, EW[H] and morphology. The full distribution is complex and an accurate picture of massive galaxy evolution requires consideration of these and more parameters. For this purpose we provide a census of this population below. Readers only concerned with the fraction of galaxies with SSFR yr-1 can skip to the last paragraph of this section.
Our method of defining “passive” versus star-forming (in terms of SSFR) should not be assumed to translate into a simple case of “passive = no emission lines”, and one should not assume that spirals are automatically “star-forming”. Figure 1 shows SSFR versus H equivalent width (EW[H]) for the SDSSRC3 galaxies, which are keyed by their morphology (circles for ellipticals, triangles for S0s, and stars for spirals) and their MPA-JHU DR7 spectra classifications (blue for star-forming, red for H nondetections at the 2 level222Errors are scaled up by a factor 2.473 as calibrated by Brinchmann et al. (2004) using repeated measurements of the same galaxy., green for AGN, and cyan for composite). The EW[H] measurements come from the MPA-JHU DR7 fiber calibration which corrects the emission flux for underlying stellar absorption. We set emission to be positive, and apply a minor correction of Å to put the peak for passive galaxies at Å.
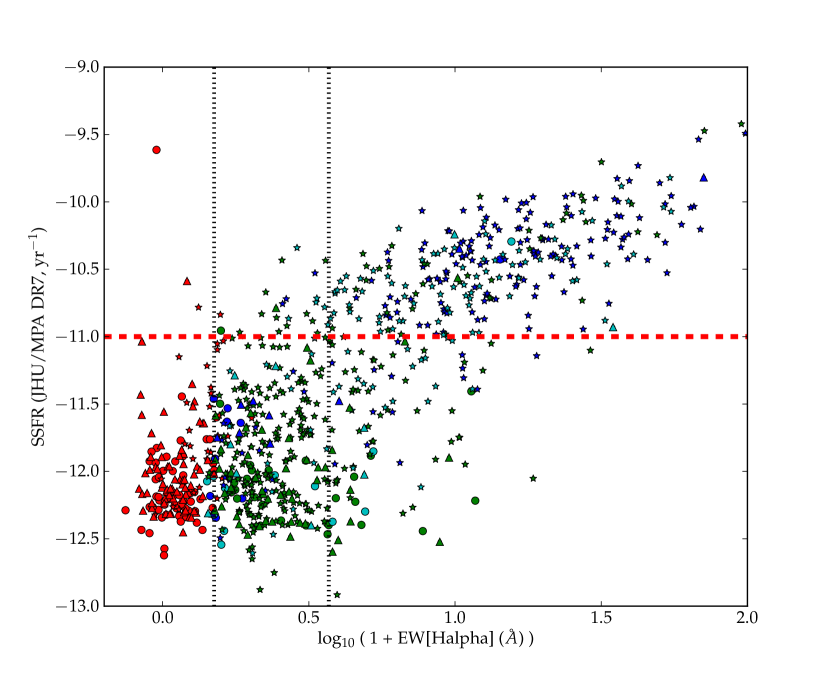
What Figure 1 demonstrates is that while almost all ellipticals and S0s are “passive” in terms of our SSFR threshold, so are many emission-line spiral galaxies. In fact, of the SDSSRC3 spiral galaxies are passive.
The red symbols (159 galaxies lacking significant H emission) are mostly ellipticals (59) and S0s (69) but also some spirals (31). Just four have SSFR yr-1.
Galaxies with SSFR yr-1 mostly have significant detections of the H emission line (289 out of 293) and are almost all spiral galaxies (280 of the 293, ), spectrally classified as either star-forming, composite or AGN galaxies. There is a strong, if rather broad correlation between SSFR and EW[H].
Fully of the passive galaxies have detectable H emission (406 galaxies); of these, (308) are classified as AGN. Ionizing radiation from old stellar populations may be enough to explain H emission in galaxies with EW[H]Å(Cid Fernandes et al., 2011, vertical dotted line at 2.7Å)333The line is plotted at 2.7Å to account for our correction of EW[H] by Å. and AGN-like line ratios. This may account for up to of “AGN” in passive galaxies with detectable H emission.
(297) of passive galaxies with detectable H emission have spiral morphology. However, many passive elliptical (46) and S0 (63) galaxies also have significant detections of the H emission line. These are typically at low SSFR ( yr-1) and EW[H]Å(consistent with ionizing radiation from old stellar populations).
Spiral galaxies contribute of the passive galaxies just below our division: i.e. with yr SSFR yr-1. These spirals contribute of all passive spiral galaxies demonstrating that the fraction of passive spirals is very sensitive to the definition of “passive”. In other words, quenching of galaxies doesn’t necessarily mean that star formation rates go to zero: some galaxies continue forming stars at lower rates. The emission line ratios of such galaxies lead to them being predominantly classified as either AGN or composite.
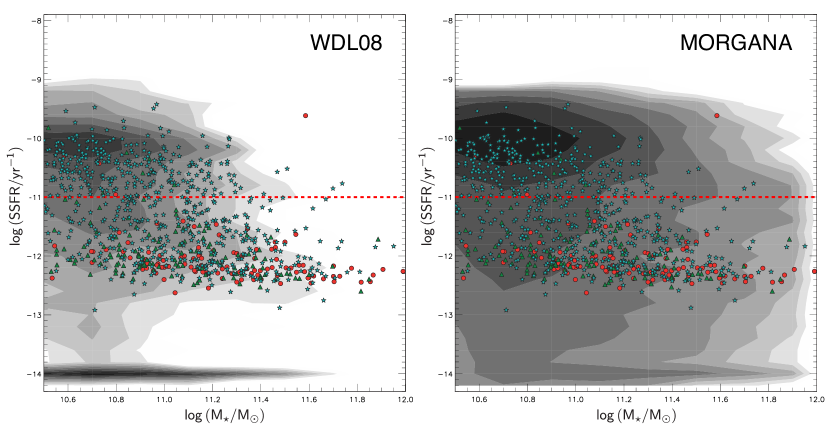
Figure 2 shows the distribution of SSFR of all galaxies versus stellar mass () at for each model (contours) with the pure merger implementation for bulge growth, with the SDSSRC3 sample overplotted (symbols). The distribution of model galaxies in this plane does not change significantly with the particular bulge growth implementation used, producing a star-forming population for which SSFR is roughly independent of stellar mass, with a typical SSFR yr Gyr-1. This corresponds to a mass-doubling rate of around the Hubble time and is dex above the SSFR for the average star forming SDSSRC3 galaxy. Both models and observations exhibit a drop in number density at around our division of SSFR yr-1. Below this cut, the SSFR of SDSSRC3 passive galaxies are limited to a minimum SSFR – yr-1, representing a limit to the template fitting procedure of Brinchmann et al. (2004). For clarity of presentation, we display all model galaxies with SSFR yr-1 as having SSFR yr-1; this includes galaxies in WDL08 which have zero SSFR ( of WDL08 galaxies). In contrast, all morgana galaxies are forming some stars, with very few at or below our limiting SSFR yr-1 value.
4 Bulge to Total ratios
Detailed photometric decompositions with the resolution necessary to distinguish and accuractely characterize discs and bulges – and especially to distinguish classical (pressure-supported, sersic parameter ) from pseudo (rotating, flat, ) -type bulges – are not available for large samples of galaxies. One high quality, volume-limited dataset is provided by Fisher & Drory (2011). They provide decompositions at m of all relatively massive, non-edge-on galaxies within the local volume, including classifications of bulges as either “classical” or “pseudo”. The mass to light ratio varies very little with the stellar population at m, and so at m is a reasonable proxy for in stellar mass.
Elliptical galaxies are assumed to have . It is difficult to discern disc components in galaxies classified as ellipticals: if any disc exists, it will typically be embedded in the bulge, and comprise only a few percent of the galaxy’s stars (e.g. Scorza et al., 1998). Disc galaxies (S0s and spirals) have a much higher mass fraction in their discs, with in the range 0–0.5 for spirals (with increasing numbers to low ) and 0–0.7 for S0s. This is confirmed with larger samples of nearby disk galaxies (e.g. Weinzirl et al., 2009; Laurikainen et al., 2010).
Figure 3 compares the stellar mass ratios () of model galaxies with the equivalent m luminosity ratios of Fisher & Drory (2011). Six panels are presented, one for each bulge formation implementation applied to each model. Contours describe the full distribution of model galaxies in vs stellar mass ().
Whereas classical bulges are thought to form via galaxy mergers, pseudo-bulges likely result from disc instabilities (Kormendy & Kennicutt, 2004). We can therefore link our different channels of bulge formation to the observed category of bulge. Comparing to our pure merger and HOP09 implementations (middle and lower panels), we plot the classical bulge to total ratio (i.e. only for bulges classified by Fisher & Drory (2011) as “classical”). In the standard model (upper panels), bulges form via both mergers and disc instabilities, and so we compare to the total (pseudoclassical) bulge to total ratio from Fisher & Drory (2011).
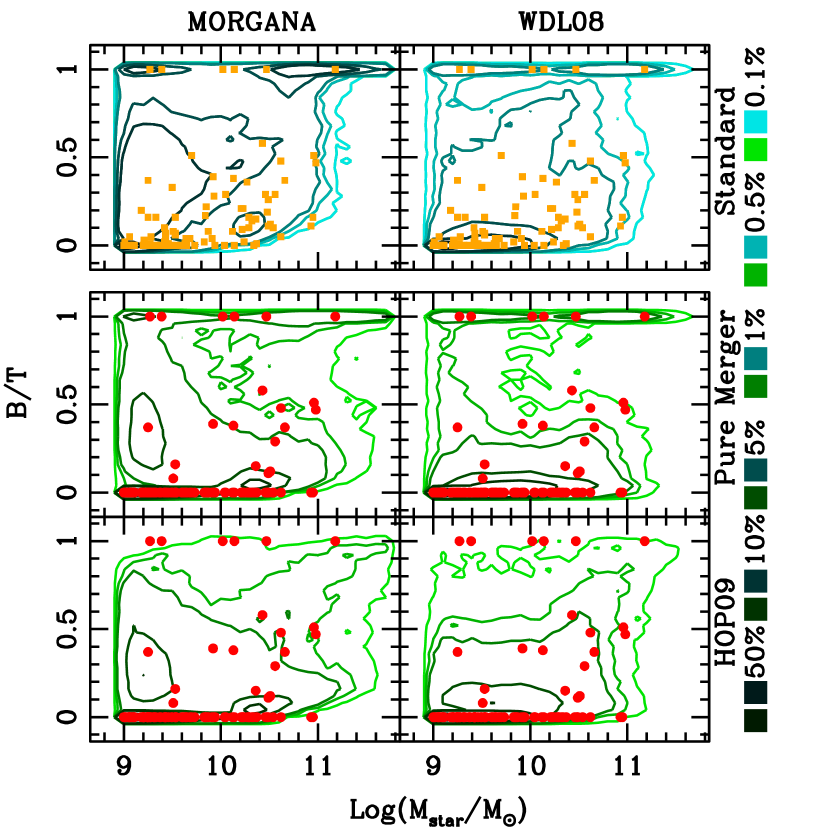
The pure mergers implementations predict a bimodal distribution of for . It peaks at (ellipticals) and then there is a gap at . For , the fraction increases with decreasing such that there is a significant population of almost “bulgeless” galaxies. In Fontanot et al. (2011a) we find a reasonable match for pure merger models to the fraction of observed classical-bulgeless galaxies as a function of stellar mass, comparing with data from Fisher & Drory (2011) and from Kormendy et al. (2010). Now we also see that the full distribution of is well matched. We note that the fraction of bulgeless galaxies is well matched at all masses, even at (Fontanot et al., 2011a) despite the low number of observed galaxies with significant bulges at this mass.
The gap in the distribution of for galaxies in the pure mergers implementations results from the total destruction of discs in major mergers. The HOP09 implementation allows a fraction of stellar and gas discs to survive even major mergers. This results in fewer galaxies, with major merger remnants overpopulating the region, so that the distribution is more continuous. While we cannot rule out the existence of minor embedded discs in some elliptical galaxies, we can say that these residual discs are not those in galaxies with , as found in local spirals and S0s (Laurikainen et al., 2010).
To compare with our observed sample, we define model elliptical galaxies as those with . This is sufficient to distinguish a typical observed disc galaxy from an elliptical. Pure merger and HOP09 implementations provide similar elliptical fractions with this cut, and so we simplify our analysis from here onwards by considering only the pure mergers implementation. A cut at (e.g.) (as in DL11) results in fewer “ellipticals” in the HOP09 implementations than with the pure mergers implementations.
Despite problems modelling disc instabilities, the distribution of with the standard implementations are reasonably well matched to the classical plus pseudo bulge fractions in Figure 3 (upper panels), although both models produce massive bulges via disc instabilities (including galaxies within morgana) which is inconsistent with the low mass of most observed pseudo-bulges.
We prefer to focus on the better constrained merger channel for bulge growth in the next Sections. However, for consistency with the literature, we also include plots showing the behaviour of the standard models in Appendix A.
5 Morphological Fractions vs Stellar and Halo Mass
In this section, we examine the fraction of galaxies of different morphological type. For reference, we publish the total integrated fractions in Table 2. SDSSRC3 types include visually classified ellipticals, and visually classified S0sspirals (disc galaxies) defined to be passive or star-forming. Model fractions are computed with each bulge growth implementation, and include ellipticals () and disc galaxies () defined to be passive or star-forming. The division between passive and star-forming is made at (Section 3.1).
| Observations | f(E) | f(passive disc) | f(star-forming disc) |
|---|---|---|---|
| SDSSRC3 | |||
| Modelimplementation | f(E) | f(passive disc) | f(star-forming disc) |
| WDL08 | |||
| Standard | |||
| Pure merger | |||
| HOP09 | |||
| MORGANA | |||
| Standard | |||
| Pure merger | |||
| HOP09 | |||
| MORGANA longer | |||
| Standard | |||
| Pure merger | |||
| HOP09 |
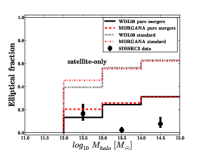
We shall now examine how morphological fractions depend upon stellar and halo mass, separately for central and satellite galaxies. SDSSRC3 data is compared with the pure merger implementation for bulge growth applied to both WDL08 and morgana models, and to the morgana model with longer satellite survival times. Results for the standard bulge growth implementations (including disc instabilities) are presented in Appendix A.
5.1 Elliptical Fraction
As described in Section 4, model ellipticals are defined to have . We now compare their abundance with that of visually classified SDSSRC3 ellipticals.
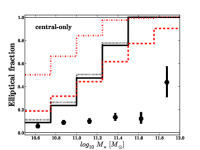
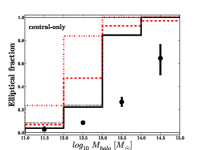
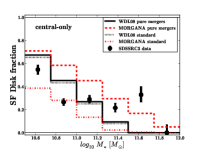
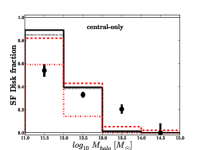
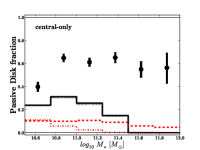
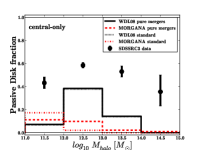
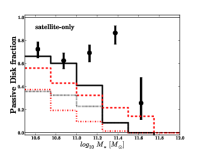
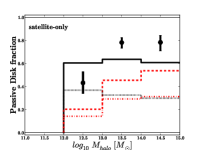
Figure 4 shows how the fraction of galaxies which have elliptical morphology depends upon stellar mass (, left panels) and halo mass (, right panels), independently for central galaxies only (upper panels) or satellite galaxies only (lower panels). Each figure shows the observed fraction of SDSSRC3 galaxies visually classified as ellipticals – black points with 1 binomial errors based on the Wilson (1927) approximation444As described by WE12, we estimate the uncertainties by first rescaling all (weighted) counts so that the total counts are equal to the original (unweighted) total counts in a given bin, and then computing the Wilson confidence limits using the rescaled counts. – to be constrasted with the models. Model elliptical fractions are presented for the pure mergers implementation for WDL08 (solid black line) and morgana (dashed red line) models and the morgana model with longer satellite survival times (dot-dashed blue line). We do not show statistical errors on model fractions to improve clarity: these are much smaller than those for observed fractions, or differences between implementations.
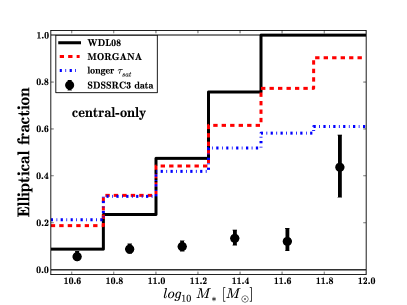
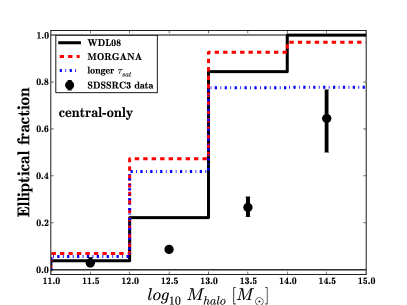
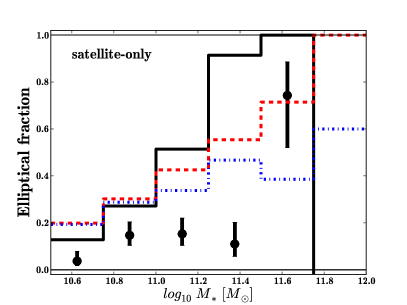
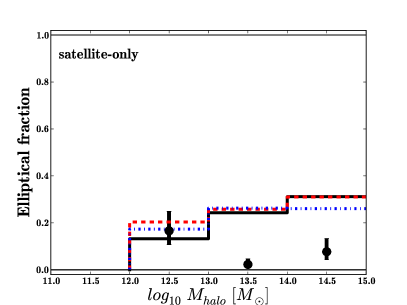
Figure 4 shows that the fraction of model ellipticals increases with stellar mass for both central and satellite galaxies for all models. This is also true of the observed elliptical fraction, although this fraction remains low except in the highest mass bin. Trends with halo mass are also qualitatively comparible: the fraction of elliptical galaxies in both models and observations increases with halo mass for central galaxies, but remains low for satellites.
The stellar mass and bulge fractions of central galaxies grow with their haloes as shown in DL11: halos merge, leading eventually to the merger of their central galaxies, and thence to the formation of bulges and (particularly in the case of major mergers) elliptical galaxies. Since the probability that a galaxy has acquired an elliptical morphology derives from its own growth history, it correlates with its stellar mass in all cases, but with the parent halo mass only for a central galaxy.
Despite this success, both Figure 4 and Table 2 make it clear that the fraction of elliptical galaxies produced by the models is significantly higher than the observed fraction across our range of and . Ellipticals are overproduced by the models. This is even more true if ellipticals can also be formed via disc instabilities (see Appendix A). In fact, model elliptical galaxies are formed fairly ubiquitously at the centre of halos merely as a consequence of their hierarchical growth and subsequent merger history, in direct conflict with observations. This poses a serious challenge for semi-analytic models which we shall try to address in Section 6.
5.2 Star-Forming and Passive Disc Galaxy Fraction
We now turn to disc galaxies. Model disc galaxies () are compared to the observed spiralS0 population. We separately compare the abundance of star-forming, and passive disc galaxies, divided at (see Section 3.1).
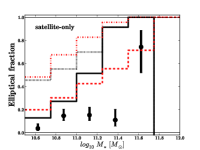
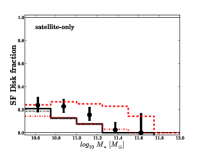
Figure 5 examines the fraction of star-forming disc galaxies, with the same format as Figure 4. This fraction declines with both stellar and halo mass for both centrals and satellites in a way which is qualitatively well matched to the data (except possibly for centrals versus ). The only clear discrepancy is that all models overproduce star-forming disc galaxies at the centre of halos. Altogether, morgana produces more star-forming disc galaxies than WDL08, especially with the longer and at high mass. However, comparison to data suggests no clear preference between the models with current statistics.
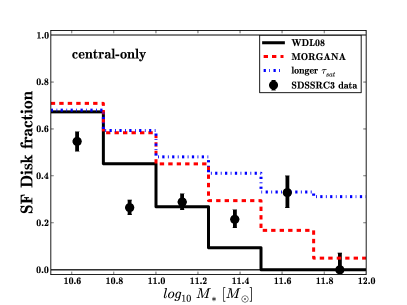
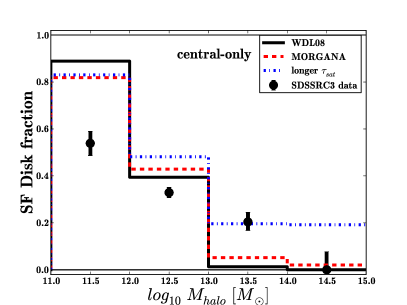
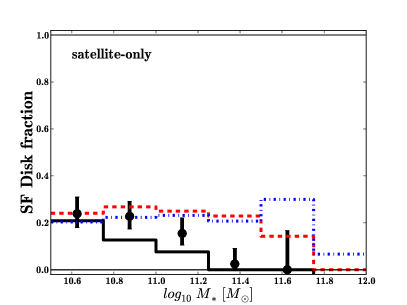
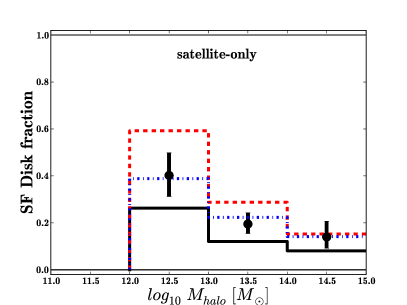
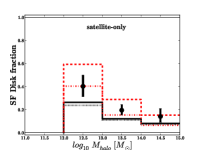
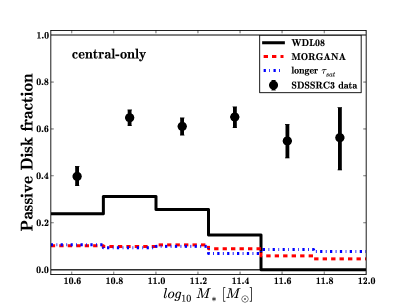
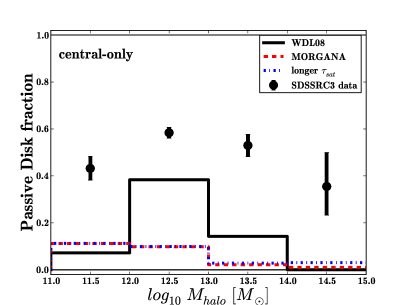
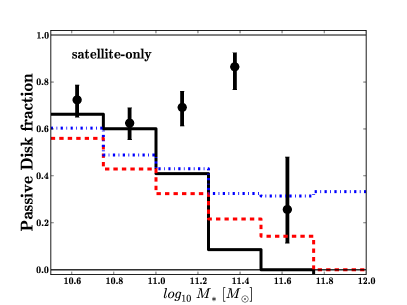
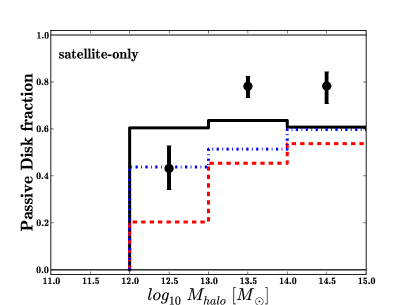
Figure 6 shows the same information for passive disc galaxies. All models produce far too few passive disc galaxies. This is especially true for centrals and at high mass. At the centre of halos the underproduced passive disc fraction is due to the overproduction of star-forming disc galaxies, and can be explained if star formation is in reality more easily suppressed in such halos, although resolution effects can also be important. In all other environments, our models produce roughly the right fraction of star-forming disc galaxies but too many ellipticals. Thus, an underproduction of passive disc galaxies is inevitable. The longer version of morgana does not greatly affect the fraction of passive disc galaxies at the centre of halos. Instead, it produces more central star-forming disc galaxies. Therefore, changing does not seem to reduce the discrepancy with observations.
5.3 Total Passive Fraction
We have seen that the fraction of star-forming disc galaxies is reasonably well reproduced by our models (Figure 5). We have also seen that ellipticals are overproduced by the models at the expense of passive disc galaxies. Therefore our models produce the correct total passive (or star-forming) fraction of galaxies, but get the distribution of passive galaxies wrong: i.e. too many are converted into ellipticals. To see this more explicitly, we examine the total passive fraction of galaxies (with no selection on ) in Figure 7.
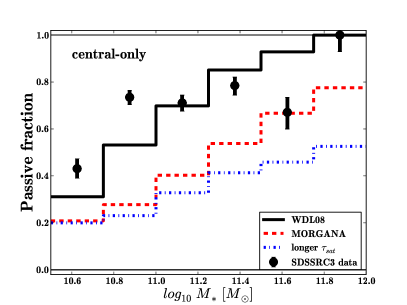
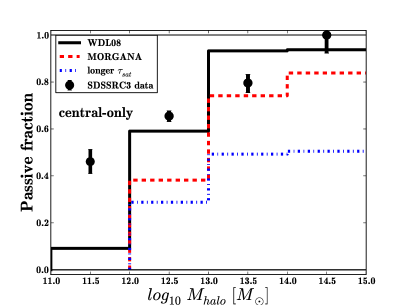
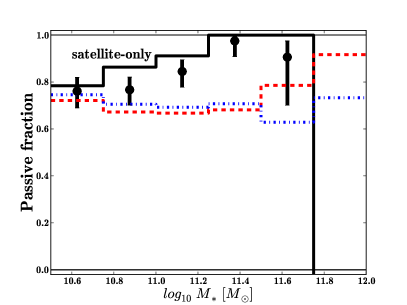
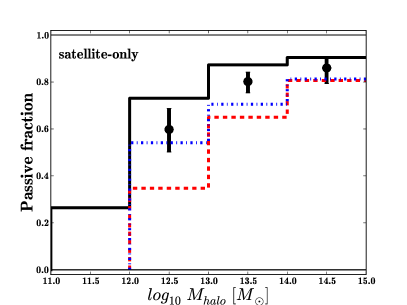
Figure 7 shows that the total passive fractions of both central and satellite galaxies are generally in good agreement with the models. The largest discrepancy is the underproduction of passive galaxies at the centre of low mass halos, previously noted to lead to an overproduction of star-forming disc galaxies (Section 5.2). Otherwise, our models produce roughly the right total passive fractions, increasing with stellar and halo mass. Passive fractions are slightly lower for morgana and especially with a longer , than for the WDL08 model: current data appears to slightly favour the higher passive fractions produced by WDL08.
Comparing the passive fractions of central galaxies to those of satellite galaxies indicates that model satellites are more often passive than centrals of the same mass, particularly at lower stellar mass. This is due to the modelling of strangulation which assumes complete and instantaneous stripping of hot gas from satellite galaxies upon their accretion onto a parent halo. This leads to the quenching of star formation once the existing cold gas is exhausted. However, at the stellar masses we are probing, passive fractions are globally high. This means our dynamic range to see differences between central and satellite passive fractions is limited. Observed fractions have larger statistical errors, and the satellite passive fraction is only notably higher than that for centrals in the lowest mass bin (). Our sample’s high stellar mass limit is likely the main reason why we fail to reproduce the much discussed overproduction of passive satellite galaxies in group halos by semi-analytic models (e.g. Font et al., 2008; Weinmann et al., 2010) – this effect is most clearly seen at lower stellar mass.
6 Interpretation
Our models create roughly the right number of passive galaxies (in the stellar mass range probed). However, these passive galaxies too often have elliptical morphology ().
We shall now consider the evidence: When did our model ellipticals experience their last major merger? What is the ultimate fate of satellite galaxies? How does quenching of star formation in central galaxies proceed, and how is this related to the growth of bulges? We shall use these questions to tease out the degrees of freedom in our models which should ultimately help reconcile the model population with the observed galaxy population.
6.1 Hierarchical Growth and the Last Major Merger
Both and star formation rates of galaxies depend sensitively on their full history of hierarchical growth. The most significant transformation of a galaxy’s morphology happens during a major merger, and the more recent that merger, the greater the probability that the galaxy will be observed with elliptical morphology.
6.1.1 The Last Major Merger
Figure 8 shows the distribution of the time in Gyr since the last major merger for all massive () galaxies that are ellipticals () at in our models with the pure merger bulge formation implementations. There are more ellipticals in morgana than WDL08 which accounts for the different normalization, but the redshift distribution of the last major merger for the two models is very similar. This contrasts with the redshift at which the ellipticals acquired their morphology which for most ellipticals is much higher in morgana than in WDL08 (Figure 9 of DL11). Some of the ellipticals formed by morgana which had no recent major merger () never acquire an elliptical morphology at all in the version with longer . This is likely the reason that a longer leads to more star-forming disc galaxies: without a major merger, gas continues to cool and fuel disc growth, while AGN feedback remains inefficient (see section 6.3 for more on AGN feedback and its relation to merger induced bulge growth). This is particularly true in morgana, where few passive, central disc galaxies are formed (figure 6).
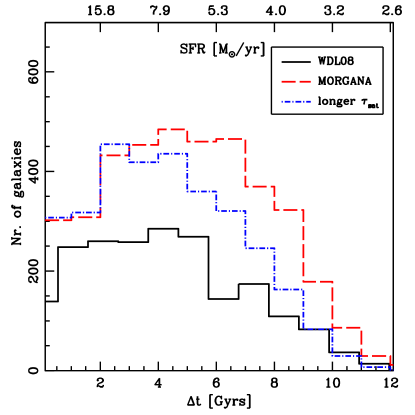
In all models the bulk of ellipticals experienced their last major merger at (). Table 2 shows that the global elliptical fraction is overproduced by our models with pure merger bulge growth implementations by factors of , and , respectively, for WDL08, morgana and morgana with the longer . In both models, there have been enough major mergers since – () to create all the ellipticals observed in the Universe! A longer model does nothing to change this situation.
It is therefore clear that it is not enough to reduce the major merger rate at high redshift: The rate of major mergers at low redshift is also too high.
6.1.2 Post-Merger Disc Regrowth
Our models maintain the bimodal distribution through relatively recent elliptical formation plus suppressed cooling via AGN feedback. A relaxed feedback prescription would allow gas to cool more easily onto newly formed elliptical galaxies, where it would reform stellar discs.
On the upper axis of Figure 8 we explore the average disc star formation rates (SFR) which would be necessary for each elliptical galaxy which has just experienced (its last) major merger to reform a disc of mass in . This is the limiting case which allows us to transform a elliptical galaxy with into a galaxy by .
An elliptical formed at () requires an average (initial ). This is within the scatter of the typical observed at that redshift (e.g. Feulner et al., 2005; Noeske et al., 2007). To quote a more extreme case: to build a galaxy with at we require an average since , or since , corresponding to and respectively. This is still within reason for a star-forming galaxy, even at .
However, we cannot simply relax the feedback prescription and allow this kind of disk regrowth to reduce the elliptical population. In Section 6.3 we shall examine the tight relationship between bulge growth and the quenching of star formation, grounded in theory and observation, and qualitatively present in our models. This relationship tells us that ellipticals do not continue forming stars at a rate typical of galaxies living on the star-forming sequence. And indeed, our observations tell us that we need to form more passive disc galaxies: the models already form enough star-forming ones. As an extension to this, any elliptical galaxy which slowly regrows its disc will spend a long period of time with . As we have seen in Figure 3 (also see Weinzirl et al. (2009); Laurikainen et al. (2010)), such galaxies are rare – most star forming galaxies have . Finally, even with the of a typical star-forming galaxy, an elliptical will not grow a massive enough disc in the time since (since when there are enough major mergers to form the entire observed elliptical population, section 6.1). Thus, disk regrowth cannot compensate for the problem of too many elliptical-forming major-merger events, particularly at low redshift.
6.1.3 Disc Survival in Major Mergers
In our HOP09 implementation of both models, calibrated to numerical simulations, major mergers do not entirely destroy discs (Hopkins et al., 2009, see also Bournaud, Jog & Combes 2007). We have shown in Section 4 that with this implementation, residual discs in major merger remnants are typically less than by stellar mass. This is insufficient to explain the observed high fraction of disc galaxies which have typically much lower (Figure 3, see also Laurikainen et al., 2010). For this reason we ignored this implementation in later analysis. However, it is worth noting that under the right circumstances (e.g. high redshift mergers with high gas fractions) or with additional physics (e.g. self-consistent merger-induced heating of stellar discs; pre-merger stripping – see Section 6.2.1 – etc.), a similar implementation might prove more fruitful.
6.2 The Fate of Satellites
There remains the option of changing the fate of satellite galaxies. Our models assume that galaxies spend a certain amount of time as satellites () and are then accreted onto the central galaxy; the resulting merger will produce an elliptical if the mass ratio is high enough. In a minor merger the bulge growth depends upon the mass ratio. We now consider various ways in which satellite galaxies might differently evolve before the merger, leading to a different amount of bulge growth.
6.2.1 Stellar and Gas Stripping
McCavana et al. (2012) examine tidal disruption timescales in dark-matter-only cosmological simulations. These are typically shorter than timescales for satellite-central coalescence for mass ratios . Although stellar profiles are more concentrated than dark matter, the frequency and mass ratio of minor mergers might be significantly lower than predicted: using simulations populated using a sub-halo abundance matching technique Wetzel & White (2010) suggest that a high fraction of satellite galaxies disrupt into the diffuse component and may never merge with the central galaxy.
Our ellipticals form predominantly via major mergers. Massive satellites with short satellite survival times might suffer tidal stripping (unbinding) of outer disc stars, even while the inner stars survive (Villalobos et al., 2012); this can serve to reduce the mass ratio of the merger and thus reduce bulge growth. Tidal stripping can operate via individual, strong interactions with other galaxies, or via multiple weak interactions with galaxies plus the global halo potential. The stripped stars may form an diffuse intrahalo component, or, if stripping occurs close to the central galaxy, they may eventually be accreted via a stellar stream. Alternatively, some fraction of stars may be removed to the diffuse component during the merger event, as discussed by Monaco et al. (2006).555This is an option in morgana but has not been applied in our version. This component would almost certainly be reaccreted onto the remnant.
Previous work has emphasized that the growth of brightest cluster galaxies (BCGs) is weaker than predicted by semi-analytic models (Whiley et al., 2008; Collins et al., 2009; Stott et al., 2010) although recent estimates accounting for progenitor bias suggest the discrepancy is not as great as previously thought (Lidman et al., 2012). Tidal stripping of satellite galaxies, which puts stars into the intracluster light component (ICL), is the proposed solution.
Using stacking analysis Zibetti et al. (2005) find of optical cluster light is in an intracluster component (ICL), while McGee & Balogh (2010) find values of by looking for hostless supernovae in galaxy groups. In either case, a large fraction of the stars formed in satellite galaxies can end up in the diffuse medium and not in the central galaxy.
The hot and cold gaseous components of satellite galaxies can also be stripped via tidal effects and/or ram pressure, suppressing formation of new stars in the satellite, and reducing mass ratios (see e.g. Wang & Kauffmann, 2008; Zavala et al., 2012). As with stellar stripping, the result is less bulge growth, and thus fewer ellipticals. Less gas is available to fuel either a merger-induced starburst, or a new post-merger disc. While other effects are not included in models, the hot gas is assumed to be stripped instantaneously when a galaxy is accreted as a satellite, leading to to a fairly rapid suppression of star formation. Relative to this, inclusion of other gas stripping effects would not make much difference to the final mass of the satellite galaxies (e.g. Lanzoni et al., 2005).
To reduce the rate of major mergers at low redshift, tidal stripping of stars should be taken into account. This will reduce the final population of elliptical galaxies.
6.2.2 Satellite-Satellite Mergers
The WDL08 model tracks the evolution of halos after their accretion onto a parent halo – they become subhalos, and their central and satellite galaxies become subhalo centrals and satellites. Subhalo-satellite galaxies are able to merge with the subhalo-central galaxy: in the context of the main halo, these can be regarded as satellite-satellite mergers; morgana does not consider this process.
We have taken all satellite elliptical galaxies from the pure merger implementation of WDL08 with stellar mass at . We then ask what was the bulge to total ratio of their main progenitor at the time that they first became satellites (, i.e. the time at which their halo was accreted onto a more massive one, and became a subhalo). Figure 9 shows the distribution of (solid, black line).
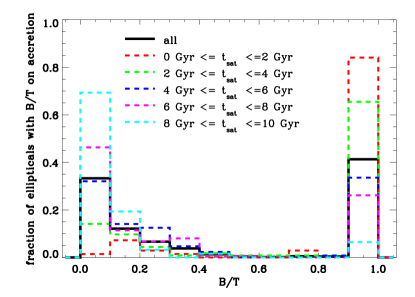
Only of satellites had . The other became ellipticals in mergers between satellites. We examine how this depends upon how long a galaxy has been a satellite, . These distributions (dashed, coloured lines) clearly show that those which were more recently accreted are more likely to have , while those which have been satellites for some time (up to ) are increasingly more likely to have been accreted as disc-dominated galaxies and to have experienced subsequent bulge growth.
The importance of mergers between satellites needs to be better constrained through realistic cosmological simulations tracing substructure. Theoretically, one would expect such mergers to take place in subhalos located in the outer regions of their parent halos (e.g. Wetzel, Cohn & White, 2009). However, the evolving tidal effects on the subhalo and the galaxies within it have not yet been fully explored.
The SDSSRC3 sample is representative, spanning all environments. The fraction of satellite galaxies which are ellipticals is low (), especially in our most massive halos (). However, a much larger elliptical fraction () is measured for galaxies in a sample of massive clusters from the WIde-field Nearby Galaxy clusters Survey (WINGS) (Vulcani et al., 2011b). The dependence on cluster mass, and significant variance between clusters (see De Lucia, Fontanot & Wilman, 2012) makes it difficult to constrain the frequency of mergers between satellite galaxies. Visually identified major mergers between satellite galaxies living in rich clusters may help.
Although the direct product of a major satellite-satellite merger is a satellite elliptical, this will have a larger mass than its progenitors and can subsequently merge with the central galaxy with a shorter dynamical friction timescale and a larger mass ratio. Nonetheless, the total number of satellite ellipticals is small, especially in the intermediate mass halos where most major mergers with the central galaxy take place (DL11). Therefore this will be a secondary effect.
6.3 Quenching of Star Formation in Central Galaxies
As we have seen, part of the problem we face is that we need the models to produce fewer elliptical galaxies while simultaneously ensuring that the overall passive fraction (figure 7) is still correctly reproduced. Figure 6 shows that the existing models underpredict passive, central disc galaxies, while figure 5 shows the abundance of star-forming, central disc galaxy population is about right.
In practice, we expect that any solution which reduces the central elliptical abundance will mean a simultaneous increase in the population of central disc galaxies. For example, tidal stripping effects can (as suggested in section 6.2.1) reduce the frequency and mass ratio of mergers, which would diminish the overall merger history and thus the of remnant central galaxies. The population of central disc galaxies would then consist of all existing model central disc galaxies plus an extra population of preserved central disc galaxies (which in the current models end up as ellipticals).
If these extra central disc galaxies follow the same pattern as the existing population of central disc galaxies, then too many of them will be star-forming and the overall passive fraction will not match the observations. These preserved central disc galaxies should thus be predominantly passive. One possible solution flows from the reasonable hypothesis that these galaxies – given that they acquire elliptical morphology in the existing models – have a richer merger history (and live in regions which are on average more biased) than is the case for the existing model central disc galaxies. Therefore the distribution of these preserved disc galaxies is likely to be biased towards higher values than is true for the existing disc population.
There is good observational motivation to believe that star formation is more likely to be quenched in higher galaxies than in low galaxies. In the local universe, early-type galaxies with significant bulges host only low levels of star formation (SFR , Shapiro et al., 2010) and cold gas (Saintonge et al., 2012; Kauffmann et al., 2012). At higher redshifts, galaxies with significant bulges (as indicated by higher global Sérsic indices) are more likely to be passive (Wuyts et al., 2011). Indeed, a significant bulge may be a requirement for a central galaxy to become passive (Bell et al., 2012; Cheung et al., 2012).
A correlation between and passive fraction exists in our models as an indirect consequence of the mergers which drive bulge growth. Massive galaxies in the centres of massive halos have star formation quenched when their cold gas reservoir is exhausted by a merger-induced starburst, and gas cooling at later times is inhibited by “radio-mode” AGN feedback. The strength and duty cycle of the radio-mode heating depend upon the details of the model, and quite different prescriptions are applied by the WDL08 model (Croton et al., 2006) and by morgana (Fontanot et al., 2006); a quantitative comparison of the effects of these different prescriptions on the properties of host galaxies has been presented in Fontanot et al. (2011b).
To see how the of a galaxy is correlated in practice with the quenching of star formation in our models, we examine the relationship between the fraction of passive central galaxies and their ratio in figure 10. The upper panel of this figure displays the overall distribution of for our model galaxies. The vast majority of model galaxies are found in two main regimes of : one below and one above . Given that we are dealing with just the pure-mergers versions of our models, the reason for this distribution is not hard to identify. Major mergers automatically result in remnants with . A single minor merger involving (intially) bulgeless galaxies, on the other hand, cannot produce a remnant with more than in WDL08, because the bulge mass in the remnant comes entirely from the satellite galaxy (which, for minor mergers, has mass ratio ). In morgana the resulting bulge mass is supplemented by rapid star formation in cold gas from the satellite, but this typically adds little to the final bulge mass at low redshift. So galaxies with require a history of multiple significant minor mergers – or else a major merger followed by substantial disc regrowth. But disc regrowth is not significant in our models, as can be seen by the lack of galaxies with and the high passive fraction at high .
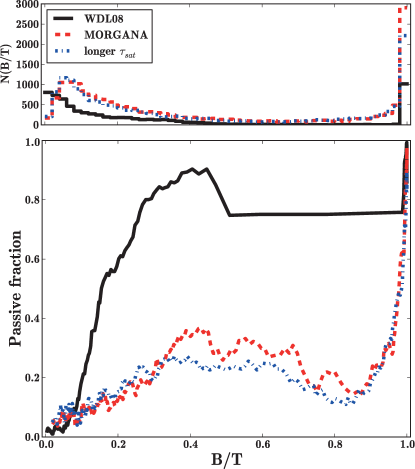
The main (lower) panel of figure 10 shows how the fraction of model central galaxies which are passive depends upon . Within each of the two populated regimes, which we shall call the minor merger regime () and the major merger regime (), the fraction of central galaxies which are passive increases with in both models. However, for , disc galaxies are quenched much more efficiently in the WDL08 model than in morgana. This is consistent with figure 6, which shows that WDL08 produces more passive disc galaxies than morgana in the halo mass range .
The challenge will be to adapt the merger and/or star formation histories of our galaxies such that many no longer become ellipticals, while still retaining the suppression of star formation which goes along with those mergers. The likelihood that preserved central disc galaxies will tend to have moderate-to-high values – due, as suggested above, to their residing predominantly in halos with rich merger histories – may help in this regard. As figure 10 indicates, however, this is a more plausible solution for the WDL08 model: if the adapted central disc galaxies are assumed to have (for example) , then of these will be passive in the WDL08 model, but only will be passive in morgana. The morgana model clearly requires more efficient suppression of star formation in the minor merger regime for central disc galaxies.
7 Summary and Prospects
We have presented the morphological composition of central and satellite galaxy populations at for both observed and semi-analytic mock samples. We divide our samples into elliptical and disc galaxies, and also into passive and actively star-forming galaxies, which means we are effectively examining the co-evolution of bulge to total ratio () and star formation rate. To understand the role of galaxy mergers, we concentrate primarily on the pure mergers bulge formation implementations, applied to both WDL08 and morgana models, as presented by DL11.
Analysis of as a function of shows that the pure-mergers bulge-formation implementation produces two peaks: one at and one at with a significant tail up to ; this is consistent with recent decompositions of local galaxies (Fisher & Drory, 2011). Our alternative HOP09 implementations – based on the simulations of Hopkins et al. (2009) and described by DL11 – produce almost no galaxies with ; instead, they produce a significant number of galaxies with , more than are seen in the nearby universe.
For a reference morphological catalogue of nearby galaxies, we used the SDSSRC3 sample described by WE12, setting a stellar mass limit at . Significantly, this catalogue separates ellipticals from S0 galaxies, enabling us to identify galaxies hosting significant discs. We compared the observed fraction of elliptical galaxies with the fraction of model galaxies, and the observed fractions of disc (S0 or spiral) galaxies, subdivided into passive and star-forming, with the equivalent model disc galaxies (). We have defined passive galaxies to be those with specific star formation rates below ; the rest we consider to be star-forming. To examine the imprint of hierarchical growth, we have studied the fraction of each morphological type separately for central and satellite galaxies, and as a function of both stellar and halo mass.
Both models get the total fraction of passive galaxies, and the fraction of star-forming disc galaxies, about right for galaxies as a function of stellar and halo mass, for both central and satellite galaxies. The only exception is for halos of mass , where both models overproduce star forming disc galaxies at the centre of halos. In our models, cooling and accretion of star-forming gas is very efficient in halos of this mass, and heating sources are too weak to quench the cooling flow. Resolution effects also impact our ability to trace the merger trees of such halos.
The model elliptical fraction increases with stellar mass for both central and satellite galaxies, but a strong increase with halo mass is only seen for central galaxies. This is in qualitative agreement with observations, consistent with the picture that ellipticals are predominantly formed at the centre of halos, and that their formation tracks the hierarchical growth of the halo, and the stellar mass of the galaxy.
Despite this success, both models overproduce elliptical galaxies by a factor of a few. They do this at the expense of passive disc galaxies. I.e., while the models get the passive fraction about right in the stellar mass range studied, far too many of these become ellipticals with .
This is not highly sensitive to any potential misclassification of satellite galaxies as centrals, because there is little difference between central and satellite morphological fractions at fixed stellar mass.
Based on our work, we can identify two requirements for the evolution of central galaxies which should be met by an improved model. First, a majority of the galaxies which (in the models) currently undergo major mergers and become ellipticals would need to either retain or reform a significant () disc component. Second, star formation in these galaxies must nonetheless be quenched.
To reduce the formation of ellipticals, we have considered several options. The HOP09 bulge growth implementations yield residual discs which survive major mergers, but these are too low mass relative to the bulge (so that ). Post-merger regrowth of discs would produce too many present-day star-forming disc galaxies with significant bulges (), rather than the required passive disc population. Increasing the survival time for satellites in morgana does reduce the elliptical population, but this also increases the population of star-forming disc galaxies instead of the passive disc fraction.
Most ellipticals in both models experienced their last major merger after z . Simulations suggest it is feasible for both gas and stars to be stripped from many satellite galaxies before they merge with the parent halo’s central galaxy (e.g. McCavana et al., 2012; Villalobos et al., 2012). This would lead to a reduction of the merger mass ratio, and thus yield more minor mergers instead of major mergers for central galaxies, especially at lower redshifts where more galaxies live in more massive halos.
Current semi-analytic models (including ours) overproduce low mass galaxies at (Fontana et al., 2006; Fontanot et al., 2007; Lo Faro et al., 2009; Marchesini et al., 2009; Fontanot et al., 2009; Weinmann et al., 2012). While we have as yet no working solution to this problem, it may effect our predictions: i.e. the star formation history of low mass galaxies has implications for the mass function of satellites as a function of time, and therefore on the rate and mass ratio of mergers.
Examination of the correlation between and passive fraction shows that both models are increasingly efficient at quenching star formation in central galaxies as increases (in the regime where most disc galaxies are found). If changes which produce more disc galaxies instead of ellipticals also tend to produce disc galaxies with significant bulges (e.g., ) – a plausible supposition, given that these galaxies currently have significant merger histories, and turning major mergers into minor mergers will still yield disc galaxies with significant bulges – then many of these should still be passive, something which is needed to match the observations. Since morgana is significantly less effective at quenching disc galaxies than WDL08, the morgana models will still require more efficient quenching of star formation in the regime than they currently achieve.
We conclude that as models of bulge growth and the quenching of star formation are inextricably intertwined, a physical model must get both and star formation rates correct. In reality, is difficult to define observationally, and so progress can be made by considering galaxies at the extreme ends of the distribution: bulgeless galaxies (Fontanot et al., 2011a) and elliptical galaxies (this paper). A complete picture of the quenching of star formation in central galaxies requires matching the observed dependence of the passive galaxy fraction on , and .
Acknowledgments
DW acknowledges the support of the Max Planck Gesellschaft. FF acknowledges financial support from the Klaus Tschira Foundation and the Deutsche Forschungsgemeinschaft through Transregio 33, “The Dark Universe”. Some of the calculations were carried out on the “Magny” cluster of the Heidelberger Institute für Theoretische Studien. GDL acknowledges financial support from the European Research Council under the European Community’s Seventh Framework Programme (FP7/2007-2013)/ERC grant agreement n. 202781. PE was supported by the Deutsche Forschungsgemeinschaft through Priority Programme 1177 “Galaxy Evolution”. PM has been partially supported by a Fondo di Ricerca di Ateneo grant of Università di Trieste.
Funding for the creation and distribution of the SDSS Archive has been provided by the Alfred P. Sloan Foundation, the Participating Institutions, the National Aeronautics and Space Administration, the National Science Foundation, the U.S. Department of Energy, the Japanese Monbukagakusho, and the Max Planck Society. The SDSS Web site is http://www.sdss.org/.
The SDSS is managed by the Astrophysical Research Consortium (ARC) for the Participating Institutions. The Participating Institutions are The University of Chicago, Fermilab, the Institute for Advanced Study, the Japan Participation Group, The Johns Hopkins University, the Korean Scientist Group, Los Alamos National Laboratory, the Max-Planck-Institute for Astronomy (MPIA), the Max-Planck-Institute for Astrophysics (MPA), New Mexico State University, University of Pittsburgh, University of Portsmouth, Princeton University, the United States Naval Observatory, and the University of Washington.
We would like to thank Alessandra Beifiori for comments which helped to improve the manuscript and the many others with whom we have held interesting discussions about the results. We thank the anonymous referee for their interest and comments.
References
- Adelman-McCarthy et al. (2006) Adelman-McCarthy J. K. et al., 2006, ApJS, 162, 38
- Baldwin, Phillips & Terlevich (1981) Baldwin J. A., Phillips M. M., Terlevich R., 1981, PASP, 93, 5
- Bamford et al. (2009) Bamford S. P. et al., 2009, MNRAS, 393, 1324
- Barnes (1988) Barnes J. E., 1988, ApJ, 331, 699
- Baugh (2006) Baugh C. M., 2006, Reports on Progress in Physics, 69, 3101
- Bell et al. (2012) Bell E. F. et al., 2012, ApJ, 753, 167
- Blanton et al. (2011) Blanton M. R., Kazin E., Muna D., Weaver B. A., Price-Whelan A., 2011, AJ, 142, 31
- Blanton et al. (2005) Blanton M. R. et al., 2005, AJ, 129, 2562
- Bournaud, Jog & Combes (2007) Bournaud F., Jog C. J., Combes F., 2007, A&A, 476, 1179
- Bower et al. (2006) Bower R. G., Benson A. J., Malbon R., Helly J. C., Frenk C. S., Baugh C. M., Cole S., Lacey C. G., 2006, MNRAS, 370, 645
- Brinchmann et al. (2004) Brinchmann J., Charlot S., White S. D. M., Tremonti C., Kauffmann G., Heckman T., Brinkmann J., 2004, MNRAS, 351, 1151
- Cheung et al. (2012) Cheung E. et al., 2012, ApJ, 760, 131
- Cid Fernandes et al. (2011) Cid Fernandes R., Stasi ska G., Mateus A., Vale Asari N., 2011, MNRAS, 413, 1687
- Collins et al. (2009) Collins C. A. et al., 2009, Nature, 458, 603
- Croton et al. (2006) Croton D. J. et al., 2006, MNRAS, 365, 11
- De Lucia & Blaizot (2007) De Lucia G., Blaizot J., 2007, MNRAS, 375, 2
- De Lucia et al. (2010) De Lucia G., Boylan-Kolchin M., Benson A. J., Fontanot F., Monaco P., 2010, MNRAS, 406, 1533
- De Lucia, Fontanot & Wilman (2012) De Lucia G., Fontanot F., Wilman D., 2012, MNRAS, 419, 1324
- De Lucia et al. (2011) De Lucia G., Fontanot F., Wilman D., Monaco P., 2011, MNRAS, 517
- de Vaucouleurs et al. (1991) de Vaucouleurs G., de Vaucouleurs A., Corwin, Jr. H. G., Buta R. J., Paturel G., Fouque P., 1991, Third Reference Catalogue of Bright Galaxies, de Vaucouleurs, G., de Vaucouleurs, A., Corwin, H. G., Jr., Buta, R. J., Paturel, G., & Fouque, P., ed.
- Dressler (1980) Dressler A., 1980, ApJ, 236, 351
- Feulner et al. (2005) Feulner G., Gabasch A., Salvato M., Drory N., Hopp U., Bender R., 2005, ApJ, 633, L9
- Fisher & Drory (2011) Fisher D. B., Drory N., 2011, ApJ, 733, L47
- Font et al. (2008) Font A. S. et al., 2008, MNRAS, 389, 1619
- Fontana et al. (2006) Fontana A. et al., 2006, A&A, 459, 745
- Fontanot et al. (2009) Fontanot F., De Lucia G., Monaco P., Somerville R. S., Santini P., 2009, MNRAS, 397, 1776
- Fontanot et al. (2011a) Fontanot F., De Lucia G., Wilman D., Monaco P., 2011a, MNRAS, 416, 409
- Fontanot et al. (2006) Fontanot F., Monaco P., Cristiani S., Tozzi P., 2006, MNRAS, 373, 1173
- Fontanot et al. (2007) Fontanot F., Monaco P., Silva L., Grazian A., 2007, MNRAS, 382, 903
- Fontanot et al. (2011b) Fontanot F., Pasquali A., De Lucia G., van den Bosch F. C., Somerville R. S., Kang X., 2011b, MNRAS, 413, 957
- Genel et al. (2010) Genel S., Bouché N., Naab T., Sternberg A., Genzel R., 2010, ApJ, 719, 229
- Hopkins et al. (2009) Hopkins P. F., Cox T. J., Younger J. D., Hernquist L., 2009, ApJ, 691, 1168
- Hubble (1926) Hubble E. P., 1926, ApJ, 64, 321
- Kauffmann et al. (2003) Kauffmann G. et al., 2003, MNRAS, 346, 1055
- Kauffmann et al. (2012) Kauffmann G. et al., 2012, MNRAS, 422, 997
- Kewley et al. (2001) Kewley L. J., Dopita M. A., Sutherland R. S., Heisler C. A., Trevena J., 2001, ApJ, 556, 121
- Kormendy et al. (2010) Kormendy J., Drory N., Bender R., Cornell M. E., 2010, ApJ, 723, 54
- Kormendy & Kennicutt (2004) Kormendy J., Kennicutt, Jr. R. C., 2004, ARA&A, 42, 603
- Lacey & Cole (1993) Lacey C., Cole S., 1993, MNRAS, 262, 627
- Lanzoni et al. (2005) Lanzoni B., Guiderdoni B., Mamon G. A., Devriendt J., Hatton S., 2005, MNRAS, 361, 369
- Laurikainen et al. (2010) Laurikainen E., Salo H., Buta R., Knapen J. H., Comerón S., 2010, MNRAS, 405, 1089
- Lidman et al. (2012) Lidman C. et al., 2012, MNRAS, 427, 550
- Lintott et al. (2008) Lintott C. J. et al., 2008, MNRAS, 389, 1179
- Lo Faro et al. (2009) Lo Faro B., Monaco P., Vanzella E., Fontanot F., Silva L., Cristiani S., 2009, MNRAS, 399, 827
- Lynden-Bell (1967) Lynden-Bell D., 1967, MNRAS, 136, 101
- Marchesini et al. (2009) Marchesini D., van Dokkum P. G., Förster Schreiber N. M., Franx M., Labbé I., Wuyts S., 2009, ApJ, 701, 1765
- McCavana et al. (2012) McCavana T., Micic M., Lewis G. F., Sinha M., Sharma S., Holley-Bockelmann K., Bland-Hawthorn J., 2012, MNRAS, 424, 361
- McGee & Balogh (2010) McGee S. L., Balogh M. L., 2010, MNRAS, 403, L79
- McGee et al. (2011) McGee S. L., Balogh M. L., Wilman D. J., Bower R. G., Mulchaey J. S., Parker L. C., Oemler A., 2011, MNRAS, 413, 996
- Melnick & Sargent (1977) Melnick J., Sargent W. L. W., 1977, ApJ, 215, 401
- Monaco, Fontanot & Taffoni (2007) Monaco P., Fontanot F., Taffoni G., 2007, MNRAS, 375, 1189
- Monaco et al. (2006) Monaco P., Murante G., Borgani S., Fontanot F., 2006, ApJ, 652, L89
- Monaco, Theuns & Taffoni (2002) Monaco P., Theuns T., Taffoni G., 2002, MNRAS, 331, 587
- Noeske et al. (2007) Noeske K. G. et al., 2007, ApJ, 660, L43
- Postman & Geller (1984) Postman M., Geller M. J., 1984, ApJ, 281, 95
- Saintonge et al. (2012) Saintonge A. et al., 2012, ApJ, 758, 73
- Sandage & Visvanathan (1978) Sandage A., Visvanathan N., 1978, ApJ, 225, 742
- Scorza et al. (1998) Scorza C., Bender R., Winkelmann C., Capaccioli M., Macchetto D. F., 1998, A&AS, 131, 265
- Sellwood (2011) Sellwood J. A., 2011, MNRAS, 410, 1637
- Shapiro et al. (2010) Shapiro K. L. et al., 2010, MNRAS, 402, 2140
- Skibba et al. (2010) Skibba R. A., van den Bosch F. C., Yang X., More S., Mo H., Fontanot F., 2010, MNRAS, 1465
- Springel, Di Matteo & Hernquist (2005) Springel V., Di Matteo T., Hernquist L., 2005, ApJ, 620, L79
- Springel et al. (2001) Springel V., White S. D. M., Tormen G., Kauffmann G., 2001, MNRAS, 328, 726
- Stott et al. (2010) Stott J. P. et al., 2010, ApJ, 718, 23
- Taffoni et al. (2003) Taffoni G., Mayer L., Colpi M., Governato F., 2003, MNRAS, 341, 434
- Taffoni, Monaco & Theuns (2002) Taffoni G., Monaco P., Theuns T., 2002, MNRAS, 333, 623
- Villalobos et al. (2012) Villalobos Á., ., De Lucia G., Borgani S., Murante G., 2012, MNRAS, 424, 2401
- Vulcani et al. (2011a) Vulcani B. et al., 2011a, MNRAS, 412, 246
- Vulcani et al. (2011b) Vulcani B. et al., 2011b, MNRAS, 413, 921
- Wang et al. (2008) Wang J., De Lucia G., Kitzbichler M. G., White S. D. M., 2008, MNRAS, 384, 1301
- Wang et al. (2011) Wang J. et al., 2011, MNRAS, 413, 1373
- Wang & Kauffmann (2008) Wang L., Kauffmann G., 2008, MNRAS, 391, 785
- Weinmann et al. (2010) Weinmann S. M., Kauffmann G., von der Linden A., De Lucia G., 2010, MNRAS, 406, 2249
- Weinmann et al. (2012) Weinmann S. M., Pasquali A., Oppenheimer B. D., Finlator K., Mendel J. T., Crain R. A., Macciò A. V., 2012, MNRAS, 426, 2797
- Weinzirl et al. (2009) Weinzirl T., Jogee S., Khochfar S., Burkert A., Kormendy J., 2009, ApJ, 696, 411
- Wetzel, Cohn & White (2009) Wetzel A. R., Cohn J. D., White M., 2009, MNRAS, 395, 1376
- Wetzel & White (2010) Wetzel A. R., White M., 2010, MNRAS, 403, 1072
- Whiley et al. (2008) Whiley I. M. et al., 2008, MNRAS, 387, 1253
- White & Frenk (1991) White S. D. M., Frenk C. S., 1991, ApJ, 379, 52
- Wilman & Erwin (2012) Wilman D. J., Erwin P., 2012, ApJ, 746, 160
- Wilman et al. (2009) Wilman D. J., Oemler A., Mulchaey J. S., McGee S. L., Balogh M. L., Bower R. G., 2009, ApJ, 692, 298
- Wilson (1927) Wilson E. B., 1927, J. Amerc. Statist. Assoc., 22, 209
- Wuyts et al. (2011) Wuyts S. et al., 2011, ApJ, 742, 96
- Yang et al. (2007) Yang X., Mo H. J., van den Bosch F. C., Pasquali A., Li C., Barden M., 2007, ApJ, 671, 153
- Zavala et al. (2012) Zavala J., Avila-Reese V., Firmani C., Boylan-Kolchin M., 2012, MNRAS, 427, 1503
- Zibetti, Charlot & Rix (2009) Zibetti S., Charlot S., Rix H., 2009, MNRAS, 400, 1181
- Zibetti et al. (2005) Zibetti S., White S. D. M., Schneider D. P., Brinkmann J., 2005, MNRAS, 358, 949
Appendix A The standard models
In the main body of this paper, we have described how the fraction of elliptical, passive disc and star-forming disc galaxies depend on both stellar and halo mass, for central and for satellite galaxies. The main result is that the fraction of visually classified elliptical galaxies in the real Universe is significantly lower than the fraction of ellipticals defined to have in two independent semi-analytic models of galaxy formation, WDL08 and morgana, and with a implementation which forms bulges only during mergers of galaxies (the pure mergers model). Instead, there is a higher fraction of real galaxies which are passive (SSFR ) but still possess discs (including both S0s and spirals).
In the standard version of these models bulges are also formed when discs become unstable and stars are transferred to the centre of a galaxy. For consistency with the literature, we present here the equivalent results for the WDL08 and morgana models with the standard bulge formation implementation in figures 11 (elliptical fraction), 12 (star-forming disc fraction) and 13 (passive disc fraction). The pure mergers implementation is also shown for comparison.
Figure 11 clearly shows that disc instabilities add to the fraction of both central and satellite ellipticals formed by the morgana model. While the WDL08 standard model does not form many more central ellipticals, the fraction of satellite ellipticals is enhanced by the inclusion of disc instabilities. Disc instabilities merely serve to increase the disparity between observations and models, as the elliptical fraction was already too high.
It is curious that WDL08 disc instabilities somehow lead to a higher fraction of satellite ellipticals, without contributing significantly to the formation of central ellipticals. Figure 13 shows that these are otherwise passive discs in the pure merger model, and suggests that passive discs are somehow more likely to suffer disc instabilities in the WDL08 model. morgana ellipticals formed via disc instabilities do so in both central and satellite galaxies, and at the expense of both passive and star-forming disc galaxies.