Ultrasensitive force detection with a nanotube mechanical resonator
Abstract
Since the advent of atomic force microscopy [1], mechanical resonators have been used to study a wide variety of phenomena, such as the dynamics of individual electron spins [2], persistent currents in normal metal rings [3], and the Casimir force [4, 5]. Key to these experiments is the ability to measure weak forces. Here, we report on force sensing experiments with a sensitivity of 12 zN/ at a temperature of 1.2 K using a resonator made of a carbon nanotube. An ultra-sensitive method based on cross-correlated electrical noise measurements, in combination with parametric down-conversion, is used to detect the low-amplitude vibrations of the nanotube induced by weak forces. The force sensitivity is quantified by applying a known capacitive force. This detection method also allows us to measure the Brownian vibrations of the nanotube down to cryogenic temperatures. Force sensing with nanotube resonators offers new opportunities for detecting and manipulating individual nuclear spins as well as for magnetometry measurements.
Force sensing with a mechanical resonator consists in converting a weak force into a displacement that is measurable by electrical or optical means. Advances in microfabrication in the late 1990’s made it feasible to reach a force sensitivity of 820 zN/ with ultra-soft cantilevers (1 zN N) [6, 7]. In spite of intensive efforts over the last decade, progress in force sensitivity has been modest. These efforts include using new materials for the resonator, such as diamond [8]; improving the displacement detection [9, 10], which can reach an imprecision below that at the standard quantum limit; and developing novel resonators, such as optically levitated nanospheres [11, 12, 13]. Optimizing both the resonator and its readout have led to a record sensitivity of 510 zN/ [9].
A promising strategy for measuring lower forces is to employ resonators made of a molecular system, such as a carbon nanotube [14, 15, 16, 17, 18]. Nanotube resonators are characterized by an ultra-low mass , which can be up to seven orders of magnitude lower than that of the ultra-soft cantilevers mentioned above [7], whereas their quality factor can be high [19] and their spring constant low. This has a great potential for generating an outstanding force sensitivity, whose classical limit is given by
| (1) |
Here is the thermal energy and the mechanical resistance [7]. This limit is set by the fluctuation-dissipation theorem, which associates Langevin fluctuating forces with the irreversible losses existing in a resonator, quantified by . Such losses may originate, for instance, from the phononic or the electronic thermal bath coupled to the resonator. Measuring the thermal vibrations, i.e. the Brownian motion, of the resonator demonstrates that its actual force sensitivity is limited by the Langevin fluctuating forces.
A challenge with resonators based on nanotubes is to detect their low-amplitude vibrations, since these vibrations are transduced into electrical and optical signals that are small and have to be extracted from an overwhelmingly large noise background. In particular, the thermal vibrations of a nanotube have not been detected below room temperature [20]. The best force sensitivity achieved thus far with nanotube resonators [15, 18] has been limited by noise in the electrical measurement setup, and has not surpassed the record sensitivity obtained with other resonators.
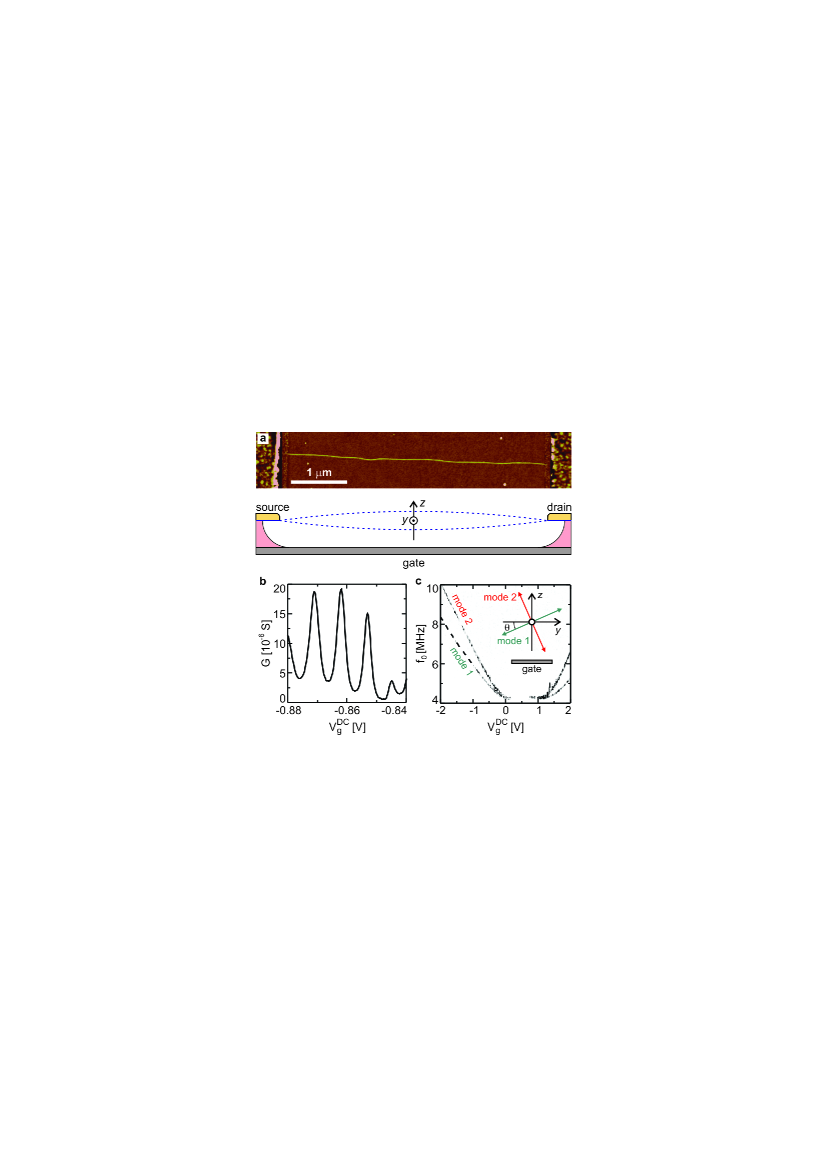
To efficiently convert weak forces into sizable displacements, we design nanotube resonators endowed with spring constants as low as N/m. This is achieved by fabricating the longest possible single-wall nanotube resonators. The fabrication process starts with the growth of nanotubes by chemical vapor deposition onto a doped silicon substrate coated with silicon oxide. Using atomic force microscopy (AFM), we select nanotubes that are straight over a distance of several micrometers, so that they do not touch the underlying substrate once they are released [21]. We use electron-beam lithography to pattern a source and a drain electrode that electrically contact and mechanically clamp the nanotube. We suspend the nanotube using hydrofluoric acid and a critical point dryer. Figure 1a shows a nanotube resonator that is 4 m long. We characterize its resonant frequencies by driving it electrostatically and using a mixing detection method [22, 18]. The lowest resonant frequency is 4.2 MHz (Fig. 1c). This gives a spring constant of N/m using an effective mass of kg, estimated from the size of the nanotube measured by AFM (supplementary information). This spring constant is comparable to that of the softest cantilevers fabricated so far [6]. When changing the gate voltage applied to the silicon substrate, the resonant frequency splits into two branches (Fig. 1c). These two branches correspond to the two fundamental modes; they vibrate in perpendicular directions (inset to Fig. 1c).
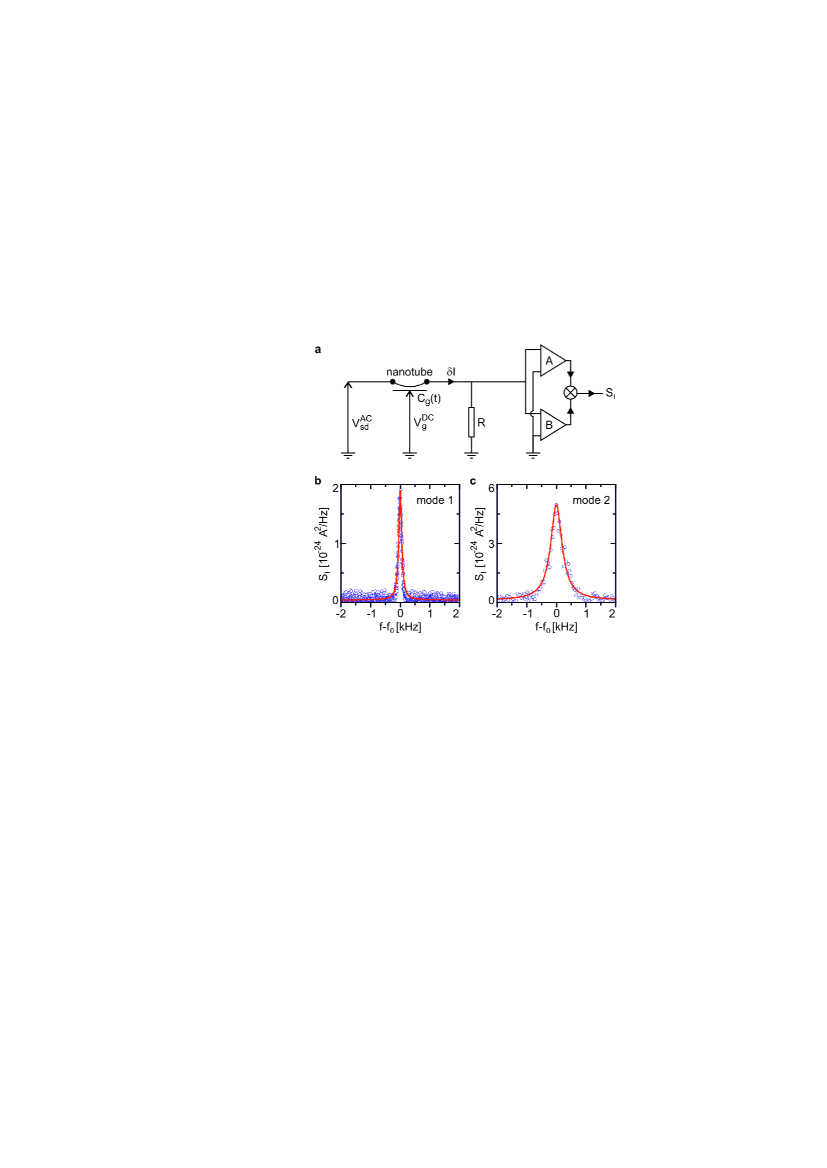
We have developed an ultrasensitive detection method based on parametric down-conversion, which (i) employs a cross-correlation measurement scheme to reduce the electrical noise in the setup and (ii) takes advantage of the high tansconductance of the nanotube in the Coulomb blockade regime to convert motion into a sizable electron current. Our detection scheme, which is summarized in Fig. 2a, proceeds as follows. The oscillating displacement of the nanotube, induced by the Langevin fluctuating forces, modulates the capacitance between the nanotube and the gate, which in turn yields a modulation of the conductance of the nanotube. We apply a weak oscillating voltage of amplitude on the source electrode at a frequency a few tens of kHz away from the resonant frequency . (We verify that the amplitude of the thermal vibrations does not change upon varying ; see supplementary information.) The resulting current fluctuations at the drain electrode at frequency are described by
| (2) |
where is the static transconductance of the nanotube, and the fluctuational displacement along the axis (Fig. 1c). In order to enhance , we select a nanotube that features sharp Coulomb blockade peaks (Fig. 1b), so that is high for certain values of . We then convert current fluctuations into voltage fluctuations across a resistor k. This voltage signal is amplified by two independent low-noise, high-impedance amplifiers. We perform the cross-correlation of the output of the two amplifiers using a fast Fourier transform signal analyzer [23, 24, 25]. As a result, the voltage noise of the amplifiers cancels out, while the weak signal of the thermal vibrations can be extracted from the noise background (see the supplementary information for details). This procedure allows us to measure the power spectral density of current fluctuations through the nanotube, which reads rbw. Here, rbw is the resolution bandwidth of the measurement and is the mean square Fourier component of the time-averaged current cross-correlation at frequency . Figures 2b,c show the resonance of the thermal vibrations at 1.2 K for the two modes characterized above, which are hereafter labeled mode 1 and mode 2. The lineshapes are well described by a Lorentzian function.
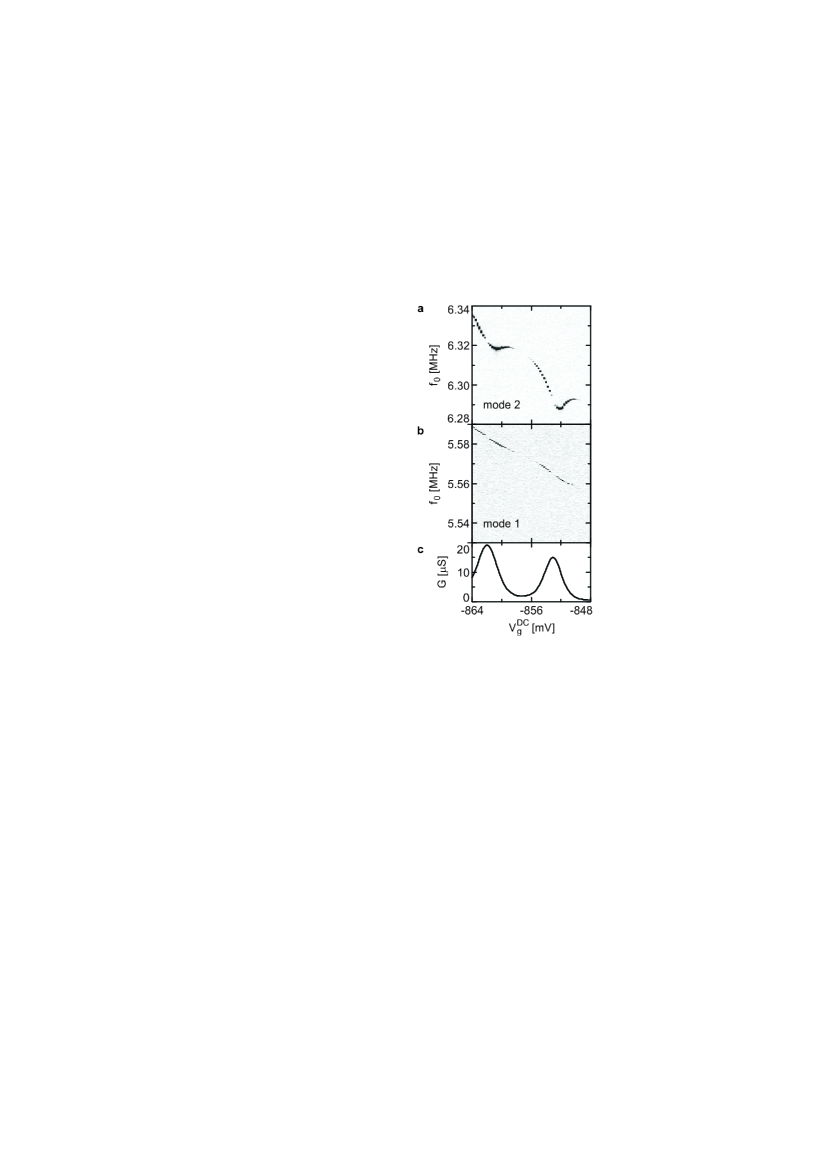
We observe the coupling between thermal vibrations and electrons in the Coulomb blockade regime by collecting spectra as a function of for these two modes (Figs. 3a,b). The resonant frequency of mode 2 oscillates as a function of with the same period as the conductance oscillations (Fig. 3c) while this dependence is monotonous for mode 1. As for damping, the resonance lineshape of mode 2 is much wider than the resonance lineshape of mode 1. This is readily seen in Figs. 2b,c, where we measure for mode 2 and for mode 1. To understand why mode 1 and mode 2 exhibit distinct features, we recall that Coulomb blockade enhances the coupling between vibrations and electrons in the nanotube [16, 17, 26], causing oscillations in resonant frequency as well as additional dissipation. The magnitude of both effects scales with the modulation of induced by the nanotube vibrations, that is, with the nanotube displacement projected onto the direction perpendicular to the gate. The distinct behaviors measured for modes 1 and 2 indicate that mode 1 essentially vibrates parallel to the direction of the gate while mode 2 vibrates perpendicularly to it (inset to Fig. 1c). The angle between the vibrations of mode 1 and the direction parallel to the gate can be estimated by comparing the integrated areas of the measured spectra of modes 1 and 2, which also depend on . This results in in the studied range of (see the supplementary information).
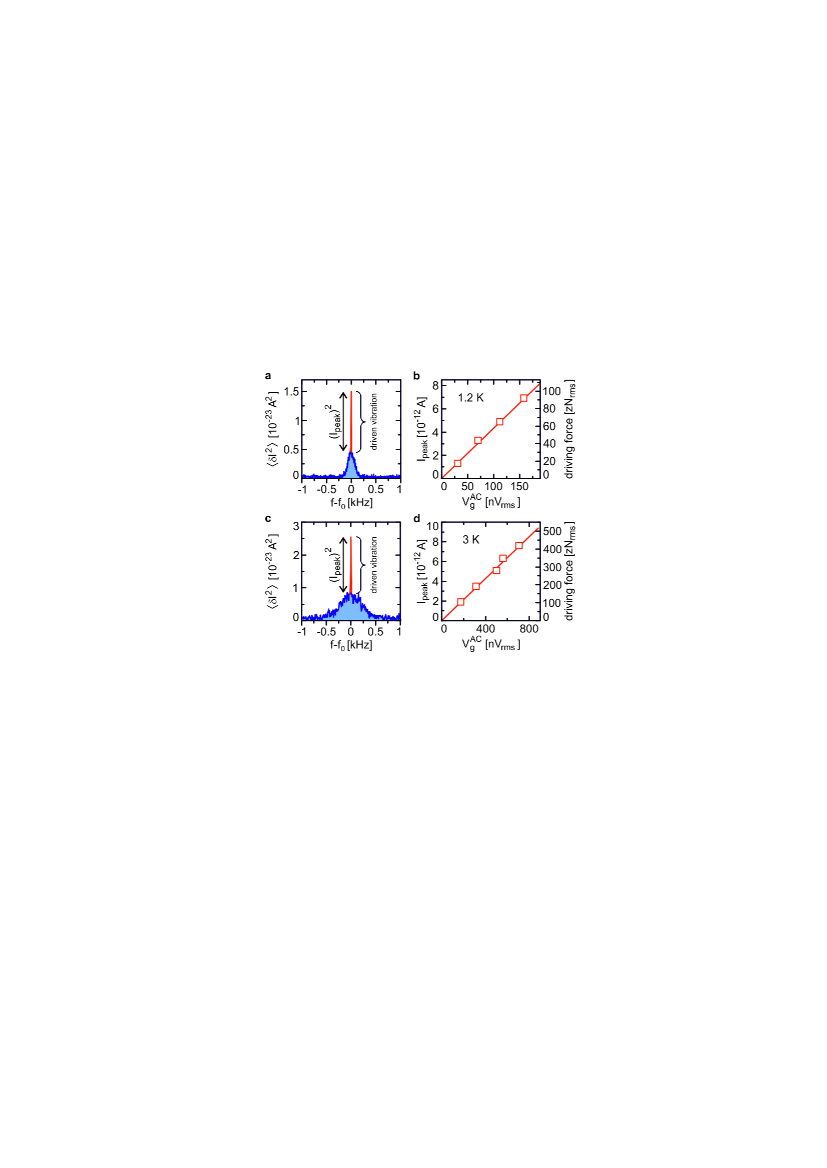
We then measure the force sensitivity of the resonator using a calibrating force. For this, we apply a capacitive force on mode 1 of amplitude , with a small oscillating gate voltage at the resonant frequency of mode 1. We perform the calibration with this mode, since its high leads to higher force sensitivity. As a result, the driven vibrations appear as a sharp peak superimposed on the thermal resonance in the spectrum of mode 1 (Fig. 4a). The square root of the height of this peak, , scales linearly with , as expected (Fig. 4b). By comparing the height of the driven peak with that of the thermal resonance using
| (3) |
we obtain zN/ at K. Here, we use F/m, estimated from the spacing in gate voltage between the Coulomb blockade peaks and the effective distance between the nanotube and the gate. The uncertainties in reflect imprecisions in , , and the heights of the driven peak and the thermal resonance. See the supplementary information for details on the measurement of the force sensitivity. Within the experimental uncertainties, the measured force sensitivity is in agreement with the value expected from the fluctuation-dissipation theorem (Eq. 1), which is zN/. The latter uncertainties reflect imprecisions in the effective mass of the nanotube (supplementary information) and the temperature.
By raising the temperature to 3 K, the Langevin fluctuating forces increase. Using the measurement method employed at 1.2 K, we obtain a force sensitivity of 38 zN (Figs. 4c,d). This is in agreement with the value expected at 3 K from according to Eq. 1, where we use the force sensitivity measured at 1.2 K and the quality factors extracted from the resonances at 1.2 and 3 K.
Measuring the thermal vibrations of nanotube resonators sheds new light on their dynamics. Different sources of noise in nanomechanical resonators were discussed in Ref. [27]. Our finding that the resonance lineshape is well described by a Lorentzian function at low temperature implies that nonlinear damping is negligible [18], the Duffing nonlinearity is weak, and the frequency noise is Gaussian and white [28].
Carbon nanotube resonators enable an unprecedented force sensitivity on the scale of 10 zN/ at 1.2 K. We anticipate that the sensitivity will improve by at least a factor of 10 by operating the resonator at milliKelvin temperatures. Indeed, the quality factor of nanotube resonators is enhanced at these temperatures [19], so that both low and high reduce . Nanotube resonators hold promise for resonant magnetic imaging with single nuclear spin resolution [2, 29, 30, 31]. If our nanotube resonator can be implemented in the experimental setups described in Ref. [2, 30] without degrading the force sensitivity achieved in the present work, it should be feasible to detect a single nuclear spin [8]. A first step in this direction will be to manipulate the nuclear spins of 13C atoms naturally present in nanotubes using the protocol reported in Ref. [31]. These resonators may also be used for ultra-sensitive magnetometery measurements of individual magnetic nanoparticles and molecular magnets attached to the nanotube.
References
- [1] Binnig, G., Quate, C. F. & Gerber, Ch. Atomic force microscope. Phys. Rev. Lett. 56, 930-933 (1986).
- [2] Rugar, D., Budakian, R., Mamin, H. J. & Chui, B. W. Single spin detection by magnetic resonance force microscopy. Nature 430, 329-332 (2004).
- [3] Bleszynski-Jayich, A. C., Shanks, W. E., Peaudecerf, B., Ginossar, E., von Oppen, F., Glazman, L. & Harris, J. G. E. Persistent currents in normal metal rings. Science 326, 272-275 (2009).
- [4] Mohideen, U. & Roy, A. Precision measurement of the Casimir force from 0.1 to 0.9 m. Phys. Rev. Lett. 81, 4549-4552 (1998).
- [5] Chan, H. B., Aksyuk, V. A., Kleiman, R. N., Bishop, D. J. & Capasso, F. Quantum mechanical actuation of microelectromechanical systems by the Casimir force. Science 291, 1941-1944 (2001).
- [6] Stowe, T. D., Yasumura, K., Kenny, T. W., Botkin, D., Wago, K. & Rugar, D. Attonewton force detection using ultrathin silicon cantilevers. Appl. Phys. Lett. 71, 288-290 (1997).
- [7] Mamin, H. J. & Rugar, D. Sub-attonewton force detection at millikelvin temperatures. Appl. Phys. Lett. 79, 3358-3360 (2001).
- [8] Tao, Y., Boss, J. M., Moores, B. A. & Degen, C. L. Single-crystal diamond nanomechanical resonators with quality factors exceeding one million. arXiv:1212.1347.
- [9] Teufel, J. D., Donner, T., Castellanos-Beltran, M. A., Harlow, J. W. & Lehnert, K. W. Nanomechanical motion measured with an imprecision below that at the standard quantum limit. Nature Nanotech. 4, 820-823 (2009).
- [10] Gavartin, E., Verlot, P. & Kippenberg, T. J. A hybrid on-chip optomechanical transducer for ultrasensitive force measurements. Nature Nanotech. 7, 509-514 (2012).
- [11] Chang, D. E., Regal, C. A., Papp, S. B., Wilson, D. J., Ye, J., Painter, O., Kimble, H. J. & Zoller, P. Cavity opto-mechanics using an optically levitated nanosphere. Proc. Natl. Acad. Sci. U.S.A. 107, 1005-1010 (2009).
- [12] Li, T., Kheifets, S. & Raizen, M. G. Millikelvin cooling of an optically trapped microsphere in vacuum. Nature Phys. 7, 527-530 (2011).
- [13] Gieseler, J., Deutsch, B., Quidant, R. & Novotny, L. Subkelvin parametric feedback cooling of a laser-trapped nanoparticle. Phys. Rev. Lett. 109, 103603 (2012).
- [14] Reulet, B., Kasumov, A. Y., Kociak, M., Deblock, R., Khodos, I. I., Gorbatov, Y. B., Volkov, V. T., Journet, C. & Bouchiat, H. Acoustoelectric effects in carbon nanotubes. Phys. Rev. Lett. 85, 2829-2832 (2000).
- [15] Sazonova, V., Yaish, Y., Üstünel, H., Roundy, D., Arias, T. A. & McEuen, P. L. A tunable carbon nanotube electromechanical oscillator. Nature 431, 284-287 (2004).
- [16] Lassagne, B., Tarakanov, Y., Kinaret, J., Garcia-Sanchez, D. & Bachtold, A. Coupling mechanics to charge transport in carbon nanotube mechanical resonators. Science 325, 1107-1110 (2009).
- [17] Steele, G. A., Hüttel, A. K., Witkamp, B., Poot, M., Meerwaldt, H. B., Kouwenhoven, L. P. & van der Zant, H. S. J. Strong coupling between single-electron tunneling and nanomechanical motion. Science 325 1103-1107 (2009).
- [18] Eichler, A., Moser, J., Chaste, J., Zdrojek, M., Wilson-Rae, I. & Bachtold, A. Nonlinear damping in mechanical resonators made from carbon nanotubes and graphene. Nature Nanotech. 6, 339-342 (2011).
- [19] Hüttel, A. K., Steele, G. A., Witkamp, B., Poot, M., Kouwenhoven, L. P. & van der Zant, H. S. J. Carbon nanotubes as ultrahigh quality factor mechanical resonators. Nano Lett. 9, 2547-2552 (2009).
- [20] Stapfner, S., Ost, L., Hunger, D., Weig, E. M., Reichel, J. & Favero, I. Cavity-enhanced optical detection of carbon nanotube Brownian motion. arXiv:1211.1608.
- [21] Chaste, J., Sledzinska, M., Zdrojek, M., Moser, J. & Bachtold, A. High-frequency nanotube mechanical resonators. Appl. Phys. Lett. 99, 213502 (2011).
- [22] Gouttenoire, V., Barois, T., Perisanu, S., Leclercq, J.-L., Purcell, S. T., Vincent, P. & Ayari, A. Digital and FM demodulation of a doubly clamped single-walled carbon-nanotube oscillator: towards a nanotube cell phone. Small 6, 1060-1065 (2010).
- [23] Glattli, D. C., Jacques, P., Kumar, A., Pari, P. & Saminadayar, L. A noise detection scheme with 10 mK noise temperature resolution for semiconductor single electron tunneling devices. J. Appl. Phys. 81, 7350-7356 (1997).
- [24] Saminadayar, L., Glattli, D. C., Jin, Y. & Etienne, B. Observation of the e/3 fractionally charged Laughlin quasiparticle. Phys. Rev. Lett. 79, 2526-2529 (1997).
- [25] Henny, M., Oberholzer, S., Strunk, C. & Schönenberger, C. 1/3-shot-noise suppression in diffusive nanowires. Phys. Rev. B 59, 2871-2880 (1999).
- [26] Ganzhorn, M. & Wernsdorfer, W. Dynamics and dissipation induced by single-electron tunneling in carbon nanotube nanoelectromechanical systems. Phys. Rev. Lett. 108, 175502 (2012).
- [27] Cleland, A. N. & Roukes, M. L. M. Noise processes in nanomechanical resonators. J. Appl. Phys. 92, 2758-2769 (2002).
- [28] Maizelis, Z. A., Roukes, M. L. & Dykman, M. I. Detecting and characterizing frequency fluctuations of vibrational modes. Phys. Rev. B 84, 144301 (2011).
- [29] Poggio, M. & Degen, C. L. Force-detected nuclear magnetic resonance: recent advances and future challenges. Nanotechnology 21, 342001 (2010).
- [30] Degen, C. L., Poggio, M., Mamin, H. J., Rettner, C. T. & Rugar, D. Nanoscale magnetic resonance imaging. Proc. Natl. Acad. Sci. USA. 106, 1313 (2009).
- [31] Nichol, J. M., Hemesath, E. R., Lauhon, L. J. & Budakian, R. Nanomechanical detection of nuclear magnetic resonance using a silicon nanowire oscillator. Phys. Rev. B 85, 054414 (2012).
Acknowlegements
We thank C. Degen,
C. Glattli, C. Schönenberger, J. Gabelli, and T. Kontos for
discussions. We acknowledge support from the European Union
through the RODIN-FP7 project, the ERC-carbonNEMS project, and a
Marie Curie grant (271938), the Spanish state (FIS2009-11284), the
Catalan government (AGAUR, SGR), and the US Army Research
Office.
Author contributions
J.M.
fabricated the device, developed the experimental setup, and
carried out the measurements. J.G. and A.E. provided support with
the experimental setup. J.G. participated in the measurements.
J.G. and J.M. analyzed the data. M.J.E. grew the nanotubes. D.E.L.
and M.I.D. provided support with the theory and wrote the
theoretical part of the supplementary information. J.M. and A.B.
wrote the manuscript with critical comments from J.G. and M.I.D.
A.B. conceived the experiment and supervised the work.