Ultra-weak long-range interactions of solitons observed over astronomical distances
Abstract
We report what we believe is the weakest interaction between solitons ever observed. Our experiment involves temporal optical cavity solitons recirculating in a coherently-driven passive optical fibre ring resonator. We observe two solitons, separated by up to 8,000 times their width, changing their temporal separation by a fraction of an attosecond per round-trip of the 100 m-long resonator, or equivalently 1/10,000 of the wavelength of the soliton carrier wave per characteristic dispersive length. The interactions are so weak that, at the speed of light, they require an effective propagation distance of the order of an astronomical unit to fully develop, i.e. tens of millions of kilometres. The interaction is mediated by transverse acoustic waves generated in the optical fibre by the propagating solitons through electrostriction.
Solitons are self-localized wave packets that do not spread, the dispersion of the supporting medium being cancelled by a nonlinear effect 1; 2; 3; 4. They are universal, and in many respects behave like particles 2. They exert forces on each other and can interact in various ways, elastically or inelastically 2; 5; 6. Here we report what we believe is by far the weakest form of soliton interaction ever observed. Using recirculating optical cavity solitons, we report interactions so weak that the solitons shift their positions by only about of their width — amounting to 1/10,000 of the wavelength of the soliton carrier wave — per characteristic dispersive length. At the speed of light, these interactions require effective propagation distances of the order of an astronomical unit (AU) to be revealed, i.e. tens of millions of kilometres. The sheer fact that we can actually observe such ultra-weak interactions in a noisy laboratory environment highlights the robustness and stability of solitons as never-before.
Solitons occur in media as diverse as water, DNA, plasma, or ultra-cold gases, 1; 7; 8; 9; 10; 11; 12 but over the last 20 years optics has led the way in our understanding of soliton interactions because of the ease with which optical solitons can be studied experimentally 13; 14; 15; 16. Optical solitons have been shown to attract, repel, breakup, merge, orbit each-other or even annihilate 17; 18; 19; 20; 21; 5. As in various other media, soliton interactions can be either short-range, occurring when the tails of neighbouring solitons overlap 17; 22; 23; 6, or long range, through a coupling with a non-local response, be it optical radiation, charge carriers, or thermal waves 24; 25; 26; 27. The weakest soliton interactions reported are long range 24; 25, but their observation is typically limited by the duration or propagation length over which the solitons can be maintained. In optics, this is often simply dictated by the size of a nonlinear crystal or the length of an optical fibre. To overcome this restriction, our experiment involves solitons recirculating in an optical fibre loop.
More specifically, we consider temporal cavity solitons (CSs) propagating in a coherently-driven passive nonlinear fibre ring resonator 28. Not only are these objects genuine solitons, for which the nonlinear self-trapping occurs in the longitudinal (temporal) direction, but the losses they suffer each round-trip in the fibre loop are also compensated, thanks to the continuous-wave (c.w.) beam coherently driving the system 29; 30; 31; 32. In this respect, CSs are dissipative solitons 33, and can persist indefinitely in the driven resonator. In our fibre experiment, we find that temporal CSs interact over long ranges through sound. In this scenario, the electric field of a first CS deforms the fibre material — in a process known as electrostriction — and excites an acoustic wave that propagates outwards across the fibre core and cladding. The associated density variation leads to a small time-varying change of the refractive index. When passing through this perturbation, a second CS undergoes a slight shift of its carrier frequency, which — due to dispersion — changes its group velocity 34. In this way, the trailing CS either catches up with the leading one (attraction) or is delayed (repulsion). Such acoustic interactions have been studied in the past in the context of optical fibre telecommunication systems with the traditional Kerr solitons of the Nonlinear Schrödinger (NLS) equation 24; 34; 35; 36. With temporal CSs, an important difference arises however because they are robust attracting states of the nonlinear resonator, tied to the phase and carrier frequency of the coherent driving field 37. So while NLS solitons can shift their carrier frequency, and hence their velocity, at will, CSs are severely limited to do so. As a matter of fact, our study reveals that the strength of the acoustic interactions of CSs is about 10,000–100,000 times weaker than in single-pass configurations.
Setup
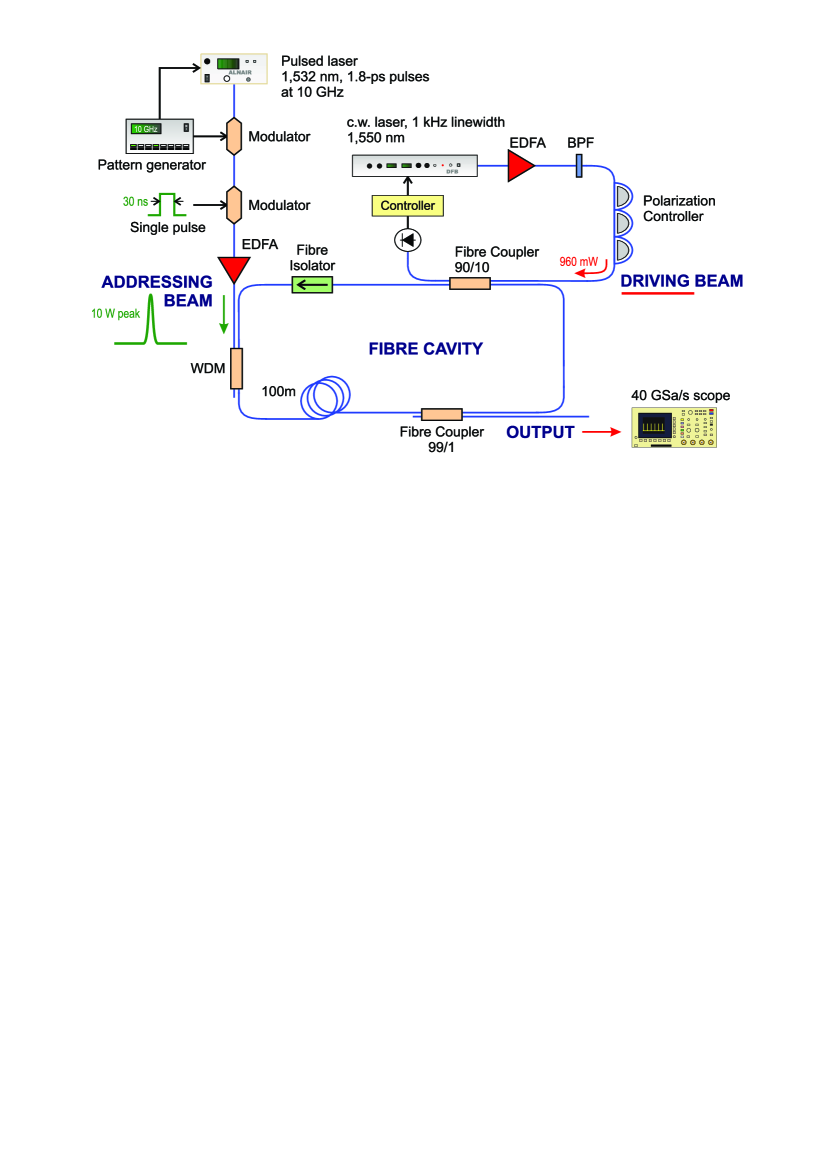
Our experimental setup is depicted in Fig. 1. The passive fibre ring resonator is about 100 m long and entirely made of standard silica telecommunication fibre closed on itself by a 90/10 fibre coupler. It takes light approximately s to complete a single round-trip of the cavity. The coupler is arranged so that 90 % of the intracavity power is recirculated, which leads to a large effective nonlinearity. Solitons occur due to the intensity-dependent refractive index of silica (the Kerr effect), which has a nearly instantaneous response 3; 38. The resonator incorporates an optical fibre isolator to prevent the build-up of stimulated Brillouin scattering radiation, which would otherwise deplete the driving beam 38, a wavelength-division multiplexer (WDM) to couple the addressing pulses used to excite CSs, and a 1 % output coupler to monitor the intracavity dynamics. Overall, the total round-trip losses are about 29 %, corresponding to a cavity finesse of 22 and to 91-kHz-wide resonances. The cavity is coherently driven by a c.w. laser running at 1,550 nm wavelength, with a narrow linewidth of 1 kHz. It is boosted by an Erbium-doped fibre amplifier before being launched into the cavity. The part of the driving beam that is reflected off the cavity is directed to a servo-controller, which controls the laser frequency. In this way, the driving laser is actively locked on a cavity resonance. In comparison to Leo et al who were only able to maintain the CSs for a few seconds 28, our locking system is significantly more robust and works for a larger excursion of the environmental parameters. Combined with the fact that our cavity is about four times shorter, we can routinely achieve stable locking of the cavity for periods in excess of 30 minutes. This is a key factor in observing the weak interactions we report here.
The CSs are excited using the same technique as in Ref. 28, i.e. through cross-phase modulation between the intracavity c.w. background field and ultra-short pulses at a different wavelength. These addressing pulses are ps in duration and are generated by a pulsed laser with a repetition rate locked to the 10 GHz clock of an electronic pattern generator (see left part of Fig. 1). A series of two intensity modulators is used to select individual addressing pulses so as to control the number of CSs excited into the cavity, as well as their initial separation (in multiples of the 100 ps period of the 10 GHz pulsed laser). The first modulator imprints the repetitive bit pattern of the generator onto the laser pulse train. The resulting optical signal is then gated by the 2nd modulator so as to select a single period of that pattern when starting measurements. The rest of the time, the 2nd modulator is completely blocking the addressing beam. Note that the CSs will have the same wavelength as that of the driving beam 30; 28.
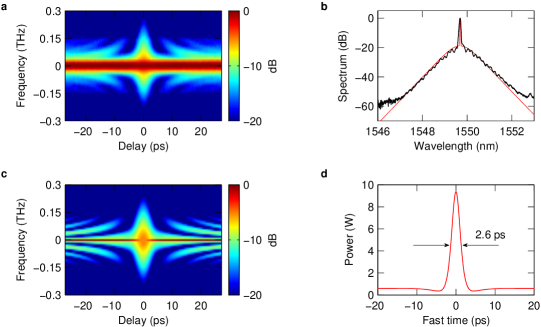
Once excited, temporal CSs circulate stably in the fibre resonator, experiencing no changes in their shape or amplitude. This confirms their solitonic nature. We characterized them by measuring a time-frequency representation of their optical field using FROG (frequency resolved optical gating) 39 as well as their optical spectrum (Fig. 2a,b). The central structure of the FROG trace signals the presence of short pulses of a few picoseconds duration circulating in the cavity. The FROG trace is also barred in the centre by an horizontal line. This line signals the presence of a c.w. background on which the pulses are superimposed. Such c.w. background is a central characteristic of CSs and is expected 30; 31; 28. The central (DC) peak of the optical spectrum is another signature of the background as are the spectral interferometric fringes visible around the main peak of the FROG trace. To understand the latter, it is worth pointing out that the FROG measurement is performed by spectrally resolving, as a function of delay, a signal consisting of the optical field under study multiplied by its own delayed copy 39. In presence of a pulse on a c.w. background, and for delays larger than the pulse duration, the FROG signal will be made up of two copies of the pulse, naturally leading to fringes in the spectral domain, and we have successfully verified that the observed fringes follow hyperbolic trajectories in the time-frequency plane , , , , The presence of these fringes therefore also highlights the coherence of the CS with respect to the c.w. background, and hence with the driving field. All these features are also clearly visible on a numerically simulated FROG trace (Fig. 2c), with the corresponding temporal intensity profile shown in Fig. 2d. The excellent agreement between the experimental and simulated FROG traces allows us to infer that our CSs are about ps (full-width at half maximum) in duration (Fig. 2d). Note that the experimental FROG trace is somewhat blurred in comparison to the numerical one due to the limited spectral resolution of the measuring apparatus.
Results
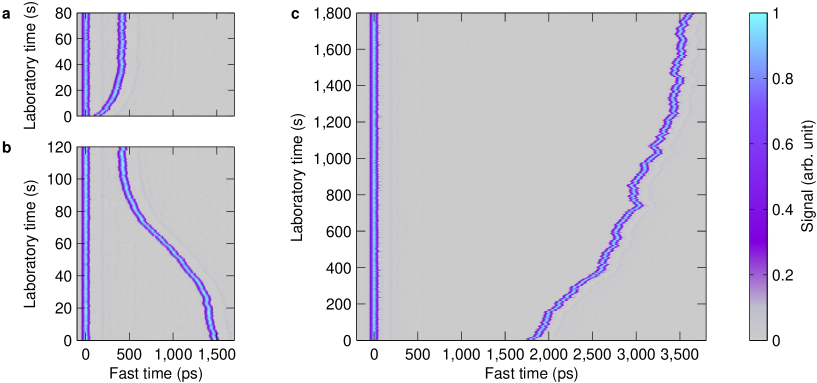
The interactions between the CSs were studied by writing a single pair of CSs into the cavity and by observing through the output coupler how the temporal separation between the two pulses evolves over many round-trips. Measurements were performed with an ultra-high-sampling-rate real-time digital oscilloscope triggered on the leading pulse of the pair. In Fig. 3a, we show a colour plot of successive oscilloscope traces when the two CSs are initially separated by 100 ps, more than 38 soliton widths. Despite the large separation, the trailing CS can be seen to be gradually repelled away from the leading one. This long-range repulsion persists for about 20 seconds until a stationary separation of 420 ps is reached (corresponding to about 160 soliton widths). Note that the oscilloscope has a temporal resolution of about 50 ps, significantly larger than the ps CS duration, hence the plot does not do full justice to the large difference of scales between the width of the CSs and their separation. In Fig. 3b, the initial separation has been set to 1,500 ps (or 577 soliton widths). The interaction is now attractive, and again persists until the same stationary separation of 420 ps is reached. We find that beyond an initial separation of 1,500 ps, the interaction becomes repulsive again. Fig. 3c illustrates this latter case, where starting from a separation of 1,800 ps (or 692 soliton widths), the trailing pulse slowly moves away from the leading one, to reach a separation of about 3,600 ps after 30 minutes. It is clear that the repulsion observed in Fig. 3c is significantly weaker than in Fig. 3a.
The soliton interactions reported above take place over timescales which are incredibly slow for an optical system. The differences in orders of magnitude can be appreciated by considering that during the 30 minute interaction shown in Fig. 3c, the CSs travel around the cavity billion times, for a total distance of 360 million kilometres, or AU, i.e. more than twice the distance between the Earth and the Sun. Yet over that vast distance, the two CSs only shift their relative position by less than 2 ns, equivalent to a change of 40 cm in spatial separation, 12 orders of magnitude smaller than the distance travelled. Such displacement corresponds to half an attosecond per cavity round-trip or equivalently to soliton widths, or 1/10,000 of the driving laser wavelength, per linear dispersive length (the distance over which a Gaussian pulse of the same duration would broaden by a factor of due to linear dispersion only 38; in our case m).
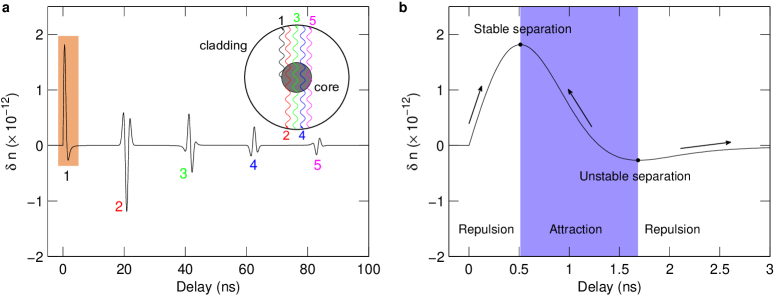
It is worth noting that the interaction strength between solitons propagating in an ideal instantaneous Kerr medium decays exponentially if they are separated by more than a few soliton widths 17; 40; 18. To understand the physics of the long-range interactions illustrated in Fig. 3, we have to consider the time-varying refractive index perturbation mediated by an acoustic wave excited by the leading CS. The impulse response of that perturbation can be calculated using the method of Ref. 34 and is plotted in Fig. 4a, scaled to the energy of our CSs. We must first point out the smallness of this refractive index perturbation. With a maximum of approximately one part-per-trillion, it is more than three orders of magnitude smaller than the Kerr-induced index change due to the peak power of the CS. Also, as can be seen in Fig. 4a, the impulse response consists of short spikes (1–2 ns in duration) occurring every 21 ns. These correspond to increasing orders of echoes, i.e. back-and-forth reflections of the acoustic wave from the fibre cladding-coating boundary back into the fibre core region 36. Given the standard cladding diameter of m of our fibre, 21 ns perfectly matches with the travel time of sound in silica at 5,996 41. In between the spikes, the response remains negligible due to the absence of overlap between the optical mode trapped inside the fibre core and the acoustic wave travelling in the cladding.
The time-varying nature of the refractive index perturbation is responsible for a shift in the instantaneous frequency of the trailing CS. The slope of the perturbation at the delay of the trailing CS determines whether the interaction is repulsive or attractive. If (respectively, ), the trailing CS is red-shifted (blue-shifted) with respect to the leading one. Because our experiment is performed in the anomalous dispersion regime 38, this frequency shift translates into a smaller (larger) group velocity, resulting in an effective repulsion (attraction) between the CSs. It is only when that the two CSs travel at the same group velocity and do not move with respect to each other. A close-up of the first spike of the acoustic impulse response plotted in Fig. 4a is shown in Fig. 4b where we have highlighted, based on the above analysis, the ranges of repulsion and attraction. Furthermore, from this figure, it is straightforward to verify that the maximum of the refractive index perturbation corresponds to a stable separation while the minimum is unstable. This predicted behaviour is in remarkable qualitative agreement with the observations described in Fig. 3. In particular, the weakness of the repulsion observed for a separation larger than about 1,500 ps simply results from the small (positive) slope of the refractive index perturbation in that region and all the way to the first echo at 21 ns. We must note that the measured stable separation of 420 ps does not quite match with the 510 ps at which the theoretical maximum occurs (see Fig. 4b). However, the transverse acoustic model of optical fibres is known to be deficient and has systematically failed in precisely reproducing the experimental measurements of the first acoustic contribution 35; 42; 43. Incidentally, our results may constitute the most accurate measurement of this primary refractive index extremum to date.
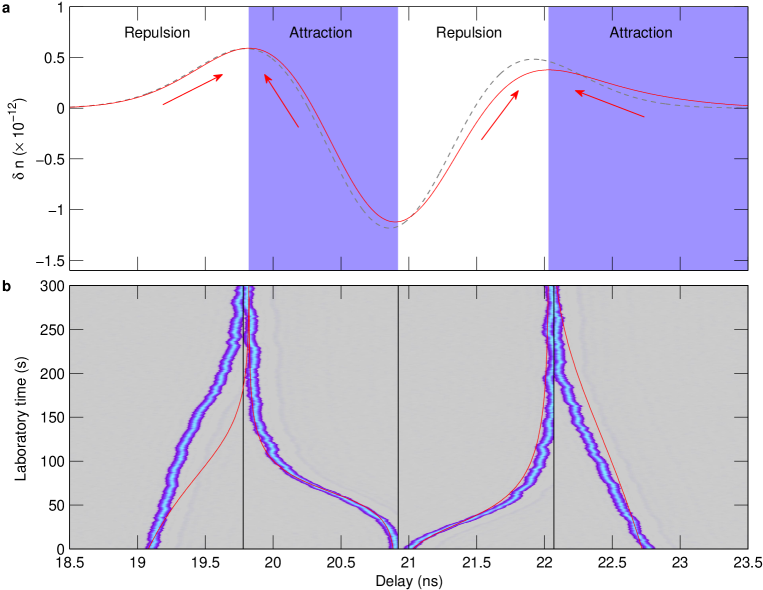
The acoustic origin of the interaction can be confirmed by probing the dynamics of a pair of CSs whose initial separation is adjusted around 21 ns to match the re-entrance of the first acoustic echo into the fibre core. Note that this separation is still much smaller than the round-trip time of s so that the CS pair can truly be considered as isolated. A close-up of the impulse response of the refractive index perturbation about the first echo is plotted in Fig. 5a (dashed curve). The response here has two maxima, and for this range of separations we would therefore expect to observe two different stable separations. Experimental measurements are juxtaposed on the same graph in Fig. 5b for four different initial separations sampling the four regions of repulsion and attraction around 21 ns separation. Note that here we have omitted to plot the leading CS (at zero delay) for clarity (at the scale of Fig. 5b, including the leading CS would make the figure three pages wide). We observe stable separations of ns and ns. This is in excellent agreement with the maxima of the actual acoustic index change (red curve in Fig. 5a) calculated as the convolution of the impulse response (shown in Fig. 4a) with the exact leading CS intensity profile and its perturbed background (see Methods). Note how the maxima of the impulse response are shifted towards slightly longer delays when considering the more complete convolution calculation, from ns and ns, to ns and ns, respectively. For this case, we have also performed a full modelling of the interactions (see Methods) and the corresponding numerical trajectories of the trailing CS are superimposed on the experimental data as the red curves in Fig. 5b. Considering the large difference of timescales involved — ps CSs shifting their position by about 1 ns over 100–200 seconds — and the absence of any fit parameter, the agreement is spectacularly good. Most of the discrepancies are likely due to incomplete knowledge of the acoustic impulse response or mechanical and thermal fluctuations in the experimental environment. These observations and simulations confirm the acoustic nature of the interactions we observe. We must point out that 21 ns corresponds to more than 8,000 soliton widths. This is by far the longest interaction range ever reported for solitons.
Discussion
Our study provides clear experimental evidence of record-breaking ultra-weak interactions between solitons. In our experiment, interacting solitons shift their relative position by an amount as small as of their width, or 1/10,000 of the soliton carrier wavelength, per linear dispersive length. This represents a microscopic displacement ( pm) over a macroscopic propagation distance ( m), with 12 orders of magnitude difference. The fact that such a weak interaction can accumulate in a well defined manner over distances of several hundred million kilometres (or billions of dispersive lengths) is also truly remarkable. It highlights the extreme stability, robustness, and coherence of the process, and of solitons in general. The long-range nature of the interaction further compounds these feats. Indeed, our observations are performed with solitons separated by up to 8,000 times their width. Translated into spatial units, our solitons localized within mm of fibre interact across a 4 m separation. All together, these figures are simply spectacular.
Our observations make clear that in the context of our study, which is performed with temporal optical cavity solitons, the interactions are mediated by acoustic waves. We believe our findings explain the repulsion of unknown origin described in Ref. 28, which reported the first experimental realization of temporal CSs. In that work, the evolution of the separation between pairs of CSs could not be tracked over time because the cavity was only stable for a few seconds. Clearly, the remarkable stability of our experiment, with the cavity interferometrically stabilized over periods in excess of 30 minutes, was a key factor for the success of our measurements. Finally, we must stress that temporal CSs have recently been shown to be the likely underlying temporal structure of broadband frequency combs generated in high-Q Kerr resonators 44. As acoustic interactions have been shown to play a role in the stabilization of the repetition rate of harmonically mode-locked fibre lasers 45; 46, it is interesting to speculate whether they have a similar role in the context of Kerr frequency comb generation and cavity optomechanics 47.
Methods
Experimental setup.
The resonator is made up of 100 m of standard telecommunications single-mode silica optical fibre (Corning® SMF-28™). The choice of a single-mode waveguide enables us to make observations unhampered by the diffraction of the beams 38: The system is purely one-dimensional. At 1,550 nm wavelength, the fibre presents a second-order dispersion coefficient (measured by white-light interferometry) and a c.w. nonlinearity coefficient, inclusive of the electrostrictive contribution, (measured from the nonlinear tilt of the cavity resonance) 38. The intracavity isolator preventing stimulated Brillouin scattering is polarization-independent and has a 60-dB isolation factor. The WDM coupler used to inject the addressing pulses is a filter WDM coupler with a 10-nm wide transition band centred at 1,540 nm. The free-spectral-range (FSR) and finesse of the resonator are measured to be MHz and 22, respectively. The driving beam is generated by a Koheras AdjustiK™ E15 laser, which is an Erbium-doped distributed feedback fibre laser. It presents a linewidth kHz and is operated at a 20 mW output power level. After amplification, we use a narrow bandpass filter (BPF, nm bandwidth at dB) centred on the driving laser wavelength to reject most of the amplified spontaneous emission (ASE) noise of the amplifier before the driving beam is launched into the cavity. The driving power at the input to the resonator is 960 mW. A commercial 100 kHz PID system (SRS SIM960) is used to lock the driving power reflected off the resonator to a set level allowing for precise control of the cavity detuning. The error signal of the PID controller is directly fed to the fast piezo-electric tuning system of the AdjustiK™ laser. The addressing pulses are derived from a tunable semiconductor mode-locked laser (Alnair MLLD-100) centred at 1,532 nm with a pulse width of ps and are subsequently amplified to a peak power of 10 W. The two intensity modulators used to select individual addressing pulses have a GHz bandwidth. For the oscilloscope measurements of Fig. 3a–c and 5b, detection was performed with a GHz PIN amplified photodiode. The oscilloscope had a bandwidth of 12 GHz and a sampling rate of 40 GSample/s, and traces were acquired every second. Also, to improve the dynamic range of the measurements, the c.w. background on which the CSs are superimposed was filtered out by a narrow BPF ( nm bandwidth) centred at 1,551 nm, slightly off the driving laser wavelength, and placed in front of the photodiode 28.
FROG measurements.
The time-frequency representation of Fig. 2a was obtained with a second-harmonic frequency-resolved optical gating (SHG-FROG) apparatus (Southern Photonics HR150) with an nm (or 45 GHz) spectral resolution at the second-harmonic wavelength. We must point out that we cannot measure the FROG trace of CSs when there is only a single CS circulating in the cavity because the energy contained in the CS c.w. background is four orders of magnitude larger than the energy of the actual ps-wide pulse, which is too large for the dynamic range of the FROG spectrometer. For that reason, the FROG measurement is obtained by filling the resonator with about 1,800 CSs. As all the CSs are identical, the result is the same as that with a single CS, except for the apparent amplitude of the background signal at DC in comparison to the wings of the spectrum. The number of CSs circulating in the cavity was used as a fit parameter to calculate the numerically simulated FROG trace of Fig. 2c. The spectrum shown in Fig. 2b was measured with an optical spectrum analyser presenting an nm spectral resolution, in the same conditions as the FROG trace.
Modelling of the acoustic response.
We list here the parameters used to calculate the acoustic response of our silica fibre, which is plotted in Fig. 4a, based on the model of Ref. 34. We used for the density of silica 48, and for, respectively, the longitudinal and transverse (shear) velocity of sound 41; 43, for the electrostrictive constant (where is the dielectric constant) 48, for the acoustic damping coefficient 34, and for the effective area of the fibre mode (as per the manufacturer specifications).
Modelling of cavity solitons.
Our experimental observations of acoustic-mediated interactions of temporal cavity solitons are modelled with a mean-field Lugiato-Lefever equation 49 extended to take into account the electrostrictive response 34. Specifically, the evolution of the intracavity electric field with respect to the slow-time of the resonator is given by a single partial differential equation which reads:
| (1) |
The normalization of this equation is the same as that used in the Supplementary Information of Ref. 28. The first four terms of the right-hand side of the equation represent, respectively, the total cavity losses, the detuning of the pump from resonance (with the detuning parameter), second-order chromatic dispersion (with the sign of the group-velocity dispersion coefficient of the fibre), and the external driving (with the amplitude of the driving field). The 2nd line of the right hand side accounts for the nonlinearity, which is split into an instantaneous (electronic) Kerr contribution and a delayed response due to the electrostriction-induced acoustic wave. is the acoustic impulse response function [] normalized such that and is the fraction of the Kerr nonlinearity due to electrostriction. With our parameters, we found % in good agreement with experimental studies 50. With these notations, it must be clear that the nonlinear coefficient that appears in the normalization of the field amplitude (see Ref. 28) must be understood as being the nonlinearity coefficient as seen by a c.w. wave, i.e. inclusive of the electrostriction contribution 50; 38. The impulse response of the actual refractive index perturbation that is plotted in Fig. 4a was obtained by considering that the intensity of the CS is a Dirac- function. This leads (in real units) to , where pJ is the energy of our CS (excluding the background) and nm is the driving laser wavelength.
The temporal CSs are the stationary solutions () of Eq. (1) 29. We have calculated them by looking for the roots of the right-hand side of the equation with a multi-dimensional globally-convergent Newton-Raphson method. The use of a Newton solver is necessary because the large difference of scales between the duration of the CSs (a few picoseconds) and the timescale of the acoustic response (up to tens of nanoseconds) makes direct propagation simulations very inefficient. In presence of the acoustic response, however, the CSs are not stationary in the reference frame of the driving field. In fact, the CSs suffer from a self-frequency shift due to the leading edge of the refractive index acoustic perturbation they generate 34, resulting in a change in their group-velocity. To circumvent this issue, we have included in Eq. (1) a drift term so that the fast-time used to describe the temporal envelope of the CSs is defined in a reference frame that travels at a velocity with respect to the driving field. The drift velocity is treated as an additional unknown in the Newton solver, with the extra condition that the sought solution must peak in the centre of the computed temporal window. With our experimental parameters (corresponding to and , determined as in Ref. 28), we find (in real units) ps/round-trip for the leading CS.
In a pair of interacting CSs, the trailing CS moves with respect to the leading one, and the overall situation is not stationary (except for particular separations). To calculate the velocity of the trailing CS at arbitrary delays with the Newton method, we took advantage of the fact that the transverse acoustic wave generated by a CS only affects trailing CSs and not the other way around. This leads to the following approach. First we solve Eq. (1) for the leading CS all by itself. Because of the generated acoustic wave, we must note that the background trailing that CS is weakly perturbed from the normal c.w. state. In a second step, the equation is solved for the trailing CS, again all by itself in the numerical window, but with an important modification: In the convolution term , the intensity at the front of the trailing CS is substituted for the intensity profile of the leading CS and its perturbed trailing background, with the delay under consideration. In this way, we ensure that the trailing CS sits in the correct perturbed refractive index wake and the velocity output by the Newton solver for the trailing CS includes contributions both from the self-frequency shift and from the presence of the leading CS. Note that upon convergence, we find no discontinuity between the field of the trailing CS and the trailing background of the leading CS, therefore validating our approach. This procedure is repeated for a range of delays (note that the leading CS is only calculated once). The simulated trajectories shown in Fig. 5b are then obtained by simple integration,
| (2) |
where is the drift velocity of the trailing CS as a function of its separation with the leading one, is the initial separation between the two CSs, and the drift velocity of the leading CS. Finally, we have verified our modelling approach using direct split-step Fourier integration 38 of Eq. (1) with smaller CS separations for which split-step integration does not impose an unmanageable computational load.
References
- (1) Russell, J. S., Report on waves, In Report of the fourteenth meeting of the British Association for the Advancement of Science, York, September 1844, pp. 311–390, Plates XLVII–LVII (London: John Murray, 1845).
- (2) Zabusky, N. J. & Kruskal, M. D. Interaction of “solitons” in a collisionless plasma and the recurrence of initial states. Phys. Rev. Lett. 15, 240–243 (1965).
- (3) Hasegawa, A. & Tappert, F. Transmission of stationary nonlinear optical pulses in dispersive dielectric fibers. I. Anomalous dispersion. Appl. Phys. Lett. 23, 142–144 (1973).
- (4) Akhmediev, N. N. & Ankiewicz, A. Solitons — Nonlinear pulses and beams, 1st ed. (Chapman & Hall, London, 1997).
- (5) Stegeman, G. I. & Segev, M. Optical spatial solitons and their interactions: Universality and diversity. Science 286, 1518–1523 (1999).
- (6) Craig, W., Guyenne, P., Hammack, J., Henderson, D. & Sulem, C. Solitary water wave interactions. Phys. Fluids 18, 057106/1–25 (2006).
- (7) Gardner, C. S., Greene, J. M., Kruskal, M. D. & Miura, R. M. Method for solving the Korteweg-deVries equation. Phys. Rev. Lett. 19, 1095–1097 (1967).
- (8) Lonngren, K. E. Soliton experiments in plasmas. Plasma Phys. 25, 943–982 (1983).
- (9) Saha, M. & Kofane, T. C. Long-range interactions between adjacent and distant bases in a DNA and their impact on the ribonucleic acid polymerase-DNA dynamics. Chaos 22, 013116/1–12 (2012).
- (10) Polturak, E., deVegvar, P. G. N., Zeise, E. K. & Lee, D. M. Solitonlike propagation of zero sound in superfluid 3He. Phys. Rev. Lett. 46, 1588–1591 (1981).
- (11) Burger, S. et al. Dark solitons in Bose-Einstein condensates. Phys. Rev. Lett. 83, 5198–5201 (1999).
- (12) Denschlag, J. et al. Generating solitons by phase engineering of a Bose-Einstein condensate. Science 287, 97–101 (2000).
- (13) Bjorkholm, J. E. & Ashkin, A. A. cw self-focusing and self-trapping of light in sodium vapor. Phys. Rev. Lett. 32, 129–132 (1974).
- (14) Mollenauer, L. F., Stolen, R. H. & Gordon, J. P. Experimental observation of picosecond pulse narrowing and solitons in optical fibers. Phys. Rev. Lett. 45, 1095–1098 (1980).
- (15) Barthelemy, A., Maneuf, S. & Froehly, C. Propagation soliton et auto-confinement de faisceaux laser par non linearité optique de Kerr. Opt. Commun. 55, 201–206 (1985).
- (16) Segev, M. Optical spatial solitons. Opt. Quant. Electron. 30, 503–533 (1998).
- (17) Gordon, J. P. Interaction forces among solitons in optical fibers. Opt. Lett. 8, 596–598 (1983).
- (18) Reynaud, F. & Barthelemy, A. Optically controlled interaction between two fundamental soliton beams. Europhys. Lett. 12, 401–405 (1990).
- (19) Tikhonenko, V., Christou, J. & Luther-Davies, B. Three dimensional bright spatial soliton collision and fusion in a saturable nonlinear medium. Phys. Rev. Lett. 76, 2698–2701 (1996).
- (20) Shih, M., Segev, M. & Salamo, G. Three-dimensional spiraling of interacting spatial solitons. Phys. Rev. Lett. 78, 2551–2554 (1997).
- (21) Królikowski, W., Luther-Davies, B., Denz, C. & Tschudi, T. Annihilation of photorefractive solitons. Opt. Lett. 23, 97–99 (1998).
- (22) Snyder, A. W., Mitchell, D. J., Poladian, L. & Ladouceur, F. Self-induced optical fibers: spatial solitary waves. Opt. Lett. 16, 21–23 (1991).
- (23) Mitschke, F. & Schwache, A. Soliton ensembles in a nonlinear resonator. Quantum Semiclass. Opt. 10, 779–788 (1998).
- (24) Smith, K. & Mollenauer, L. F. Experimental observation of soliton interaction over long fiber paths: discovery of a long-range interaction. Opt. Lett. 14, 1284–1286 (1989).
- (25) Rotschild, C., Alfassi, B., Cohen, O. & Segev, M. Long-range interactions between optical solitons. Nat. Phys. 2, 769–774 (2006).
- (26) Skryabin, D. V. & Gorbach, A. V. Colloquium: Looking at a soliton through the prism of optical supercontinuum. Rev. Mod. Phys. 82, 1287–1299 (2010).
- (27) Allen, A. J., Jackson, D. P., Barenghi, C. F. & Proukakis, N. P. Long-range sound-mediated dark-soliton interactions in trapped atomic condensates. Phys. Rev. A 83, 013613/1–6 (2011).
- (28) Leo, F. et al. Temporal cavity solitons in one-dimensional Kerr media as bits in an all-optical buffer. Nat. Photon. 4, 471–476 (2010).
- (29) Tlidi, M., Mandel, P. & Lefever, R. Localized structures and localized patterns in optical bistability. Phys. Rev. Lett. 73, 640–643 (1994).
- (30) Firth, W. J. & Weiss, C. O. Cavity and feedback solitons. Opt. Phot. News 13, 54–58 (February 2002).
- (31) Barland, S. et al. Cavity solitons as pixels in semiconductor microcavities. Nature 419, 699–702 (2002).
- (32) Lugiato, L. A. Introduction to the feature section on cavity solitons: an overview. IEEE J. Quantum Elec. 39, 193–196 (2003).
- (33) Dissipative Solitons: From Optics to Biology and Medicine, Vol. 751 of Lecture Notes in Physics, Akhmediev, N. N. & Ankiewicz, A., eds. (Springer, Berlin Heidelberg, 2008).
- (34) Dianov, E. M., Luchnikov, A. V., Pilipetskii, A. N. & Prokhorov, A. M. Long-range interaction of picosecond solitons through excitation of acoustic waves in optical fibers. Appl. Phys. B 54, 175–180 (1992).
- (35) Townsend, P. D., Poustie, A. J., Hardman, P. J. & Blow, K. J. Measurement of the refractive-index modulation generated by electrostriction-induced acoustic waves in optical fibers. Opt. Lett. 21, 333–335 (1996).
- (36) Jaouën, Y. & du Mouza, L. Transverse Brillouin effect produced by electrostriction in optical fibers and its impact on soliton transmission systems. Opt. Fib. Tech. 7, 141–169 (2001).
- (37) Firth, W. Temporal cavity solitons: Buffering optical data. Nat. Photon. 4, 415–417 (2010).
- (38) Agrawal, G. P. Nonlinear Fiber Optics, 4th ed. (Academic Press, 2006).
- (39) Trebino, R. et al. Measuring ultrashort laser pulses in the time-frequency domain using frequency-resolved optical gating. Rev. Sci. Instrum. 68, 3277–3295 (1997).
- (40) Mitschke, F. M. & Mollenauer, L. F. Experimental observation of interaction forces between solitons in optical fibers. Opt. Lett. 12, 355–357 (1987).
- (41) Fellegara, A., Melloni, A. & Martinelli, M. Measurement of the frequency response induced by electrostriction in optical fibers. Opt. Lett. 22, 1615–1617 (1997).
- (42) Buckland, E. L. Mode-profile dependence of the electrostrictive response in fibers. Opt. Lett. 24, 872–874 (1999).
- (43) Biryukov, A. S., Sukharev, M. E. & Dianov, E. M. Excitation of sound waves upon propagation of laser pulses in optical fibres. Quantum Electron. 32, 765–775 (2002).
- (44) Coen, S., Randle, H. G., Sylvestre, T. & Erkintalo, M. Modeling of octave-spanning Kerr frequency combs using a generalized mean-field Lugiato-Lefever model. arXiv:1211.1697 (2012); in press in Optics Letters, to appear in the January 1, 2013 issue.
- (45) Gray, S., Grudinin, A. B., Loh, W. H. & Payne, D. N. Femtosecond harmonically mode-locked fiber laser with time jitter below 1 ps. Opt. Lett. 20, 189–191 (1995).
- (46) Pilipetskii, A. N., Golovchenko, E. A. & Menyuk, C. R. Acoustic effect in passively mode-locked fiber ring lasers. Opt. Lett. 20, 907–909 (1995).
- (47) Kippenberg, T. J., Rokhsari, H., Carmon, T., Scherer, A. & Vahala, K. J. Analysis of radiation-pressure induced mechanical oscillation of an optical microcavity. Phys. Rev. Lett. 95, 033901/1–4 (2005).
- (48) Melloni, A., Frasca, M., Garavaglia, A., Tonini, A. & Martinelli, M. Direct measurement of electrostriction in optical fibers. Opt. Lett. 23, 691–693 (1998).
- (49) Lugiato, L. A. & Lefever, R. Spatial dissipative structures in passive optical systems. Phys. Rev. Lett. 58, 2209–2211 (1987).
- (50) Buckland, E. L. & Boyd, R. W. Electrostrictive contribution to the intensity-dependent refractive index of optical fibers. Opt. Lett. 21, 1117–1119 (1996).
Acknowledgements
This work was supported by the Marsden Fund Council from Government funding, administered by the Royal Society of New Zealand. The driving laser was funded from the Faculty Research Development Fund of The Faculty of Science of The University of Auckland. J.K.J. also acknowledges the support of a University of Auckland Doctoral Scholarship.
Author Contributions
J.K.J. performed the experiments. M.E. identified the physical origin of the interactions, incorporated the acoustic response into the mean field model, wrote a first draft of the paper, and together with S.C. performed the numerical simulations. S.G.M. supervised the experimental work. S.C. programmed the Newton solver, wrote the final version of the paper, and supervised the overall project.
Additional information
The authors declare no competing financial interests. Correspondence and requests for materials should be addressed to J.K.J. or S.C.