Controlling self-organized criticality in complex networks
Abstract
A control scheme to reduce the size of avalanches of the Bak-Tang-Wiesenfeld model on complex networks is proposed. Three network types are considered: those proposed by Erdős-Renyi, Goh-Kahng-Kim, and a real network representing the main connections of the electrical power grid of the western United States. The control scheme is based on the idea of triggering avalanches in the highest degree nodes that are near to become critical. We show that this strategy works in the sense that the dissipation of mass occurs most locally avoiding larger avalanches. We also compare this strategy with a random strategy where the nodes are chosen randomly. Although the random control has some ability to reduce the probability of large avalanches, its performance is much worse than the one based on the choice of the highest degree nodes. Finally, we argue that the ability of the proposed control scheme is related to its ability to reduce the concentration of mass on the network.
1Department of Economics – Universidade de Brasília, DF 70910-900, Brazil.
2Instituto de Física, Universidade Federal da Bahia, BA 40210-340, Brazil.
3National Institute of Science and Technology for Complex Systems, Brazil.
1 Introduction
The phenomenon of self-organized criticality (SOC) on complex networks [1, 2, 3, 4, 5] has recently been studied in order to understand the failures that take place in real networks such as electric power distribution and internet [3]. Attempts for analytical approaches of SOC behavior on geometrically grown networks have also been reported [6]. A review of these attempts may be found for instance in reference [7]. The main idea is that, due to the strong relation among the neighbors, a small overload that occurs in a node or a small collection of nodes may spread into the whole network. Parallel to this, there is a growing literature that deals with the issue of robustness and the reduction of overload failure cascades caused by removal of nodes (attacks or overload) in complex networks [8, 9, 10, 11, 12, 13]. The remedy often used in order to avoid the propagation of these cascades is the intentional removal of some special nodes characterized by their degree or by a given centrality measure.
In this paper, we propose a control scheme to reduce the probability of large avalanches in a generalization of the Bak-Tang-Wiesenfeld (BTW) sandpile model [14] to complex network substrates [3, 4, 5]. In order to provide a motivation to this problem, consider the situation in which there is a demand for limited recourses in each node of a complex network. Since the resources are limited, if the demand in one node exceeds a given threshold, a demand avalanche happens: the local node resource provider in this node is closed and the demand is forwarded to its neighbors. Being a SOC system, it is clear that a local demand avalanche in one node may be amplified to the node’s neighbors, transforming small events into large ones. However, large avalanches are undesired in the system, since they may destabilize several resource providers simultaneously. One way of avoiding this kind of phenomenon is to close, for a short time lapse, the resource provider in the node and to move the demand to its neighbors. The main idea is that instantaneous closures can avoid big avalanches. The difficult is how to choose the correct moment and place of the such closure.
The issue of controlling SOC in regular lattices, where mass is added and removed from a system, has been recently discussed in sandpile models [15]. In that paper, we have shown that an external control action, which amounts to triggering avalanches in sites that are near to be come critical, was able to reduce the probability of very large events, so that mass dissipation occurs most locally. Due to the homogeneity of the lattice where traditional SOC phenomena have been investigated, one difficult present in [15] is that, in order to make the decision whether an avalanche should or not be exogenously triggered, one had to simulate a replica model of the region of the system to be controlled. Here, differently from [15], the control scheme does not depend on the replica model and, therefore, is less costly than the one presented in [15]. Furthermore, while in [15] we were interested in controlling the size of avalanches in only a region of the system, in this paper we are interested in controlling the size of the avalanches in the whole network.
The strategy considered here to control the size of avalanches in BTW systems may not be confused with the stock exchange trading halts [16, 17]. While our strategy allows that the demands be attended in another provider, in such circuit breakers the traders are not able to meet their demands for a finite time lag. Although our work is related to network robustness literature, in the sense that we pay a special attention to some nodes based on their centrality, it is very different in essence. Here, we do not remove the nodes of the network nor the demand associated to the node – the control rule keeps the mass of the system on being the same. The only variation of mass in the BTW system is due to the SOC dynamics, which injects it at a low constant rate and remove it in some specific sites. Furthermore, different from these works, our work trigger small avalanches in order to avoid large ones.
Our work is also related to the literature of immunization of complex networks [18, 19, 20, 21] where the strategies for immunization are based on the specific properties of the nodes of the network. However, very different from them, we consider the issue of controlling self organized system without the immunization (changing the state of the node) of nodes.
The control scheme we propose is based on triggering avalanches on a percentage of the highest degree nodes. We compare this strategy with another cheaper control scheme, based on triggering avalanches on randomly selected nodes with the same frequency used in the first scheme. While the former strategy clearly requires global knowledge of the network, the latter does not need this information. Although both strategies are able to reduce the size of avalanches, the former performs much better. We also show that the problem of reducing the size of avalanches of SOC systems on complex networks is related to the reduction of the concentration of mass on few nodes of the system. Finally, we report the cost of the control scheme based on the percentage of nodes that the control scheme has to deal with and number of interventions that the control scheme performs in a given time window .
2 Controlled BTW model in complex networks
The BTW sandpile model [14] has been recently studied [3, 4, 5] in an scale-free network discussed by Goh, Kahng and Kim (GKK) [22]. It has also been studied in the random Erdős-Renyi (ER) networks [1]. Here, we follow closely a previously developed approach [3, 4, 5], but study the problem for GKK and ER networks, as well as for the network that represents the actual electrical power grid of the western United States [23].
Consider a network with nodes. Let be the degree of node and be the set of neighbors of node . Assume also that each node stores a certain amount of mass units. The dynamics of the BTW model in complex networks may be described by the following two rules: (a) Addition rule: at each time step, a mass unit is added to a randomly selected node , so that . (b) Toppling rule: if , then , .
In order to control the BTW model, we propose here the so-called Highest Degree Nodes Control Based (H-control), which assumes that we have global knowledge of the network. The idea is to choose the percentage of highest degree nodes of the network that will be controlled and to build a set with these nodes. To be controlled here means that if of a node in a given time, the control system causes this node to topple. We will use the term explosion to identify such action in order to differentiate it from the ordinary addition rule. As one may see further, there are in fact two technical differences from this process to the usual addition rule: (1) The mass of the system is not increased; (2) Since the site is not critical, the neighbors do not receive the same amount of mass. The avalanche that follows from the explosion caused by the intervention of the control scheme will be called as controlled avalanches, so that it will be possible to distinguish them from the uncontrolled avalanches that happen due to the deposition of mass in SOC dynamics. Since the controlled avalanche is triggered by emptying the non critical node , the available mass in this site goes randomly to some of the neighbors belonging to . This means there is a pre-defined order inside the set of highest degree nodes. This is interesting since starting from the highest degree nodes in this set, it is possible that some explosions that could be necessary before the beginning of the control intervention may not be necessary anymore. This can happen if a node that belongs to the set of highest degree nodes is also connected to a note that has higher degree than it. We compare this control scheme with the so-called Random Selected Nodes Control Based (R-control), which assumes no information about the network, but it intervenes with the same frequency of the H-control. In each instant of time, it selects randomly the nodes to be controlled and triggers an explosion on this node, if . Both control schemes assume that we keep the same mass in the system. An easier strategy, which is available in real world problems, is simply reduce the mass of the system. In this case, instead of triggering explosions in the nodes, one could transport the excess of mass from the system. Since we think that this strategy modify strongly the dynamics of the system, we do not consider it in this paper. However, an interesting issue that can be studied, is how to optimize the choice of the mass that should be transported away – since there is also a high cost associated to the transportation of mass.
3 Results
As advanced in the previous section, we have applied this control scheme to BTW model on three network types. The GKK network can be built based on the following algorithm [22]: start with nodes and assign to each of them a weight equal to , where is related to the degree exponent according to . Then select two different nodes with probability equal to the normalized weights and , respectively, and connect them if they are not already connected. The exponent of the avalanche size distribution in these GKK networks was determined to be [3]. The ER networks were built assuming that all nodes of the network have the same constant probability of being connected. The exponent of the avalanche size distribution in the networks was determined to be [1].
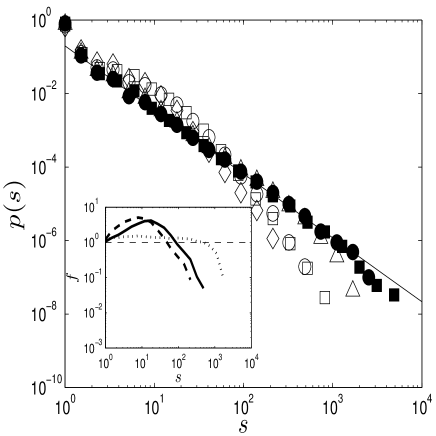
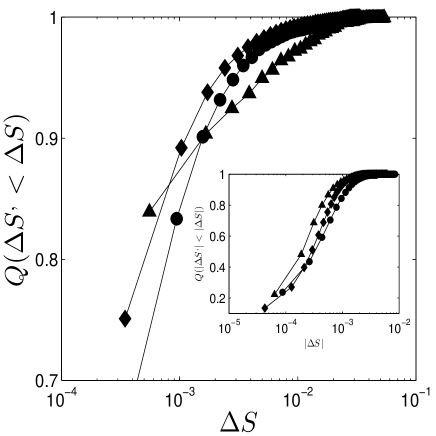
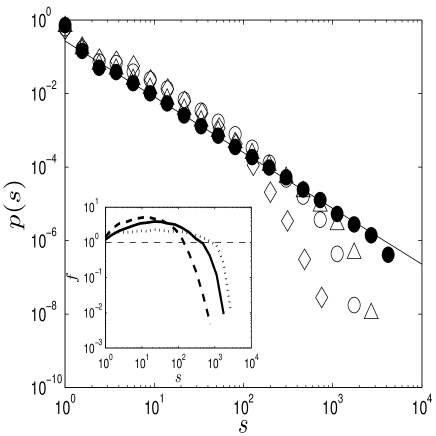
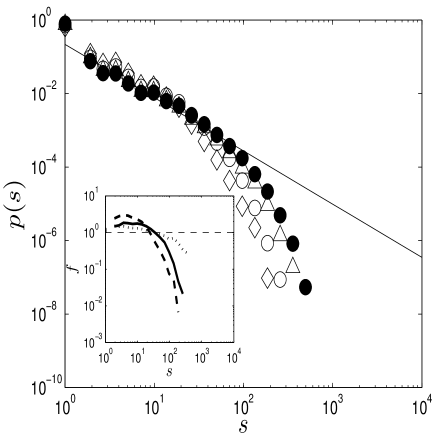
Fig.1 compares the the probability distribution function (PDF) of avalanche sizes of the uncontrolled system (solid symbols) with that of the system controlled by the H-control (hollow symbols). While the data of the uncontrolled system include only the uncontrolled avalanches, those of the controlled system include controlled and uncontrolled avalanches. The PDF of the degrees of the nodes of the GKK networks presented in this figure is a power-law with theoretical exponent , since we used the value of to build them. For both networks with and nodes we have numerically obtained the exponent . The straight line in Fig. 1 is the best fit to the data for the systems with size and in the interval . Based on this data, the exponent of the avalanche size distribution in these GKK networks was determined to be which is roughly the value of the empirically one determined in [3]. Fig.1 also shows that the H-control is able to strongly reduce the probability of large events. Besides, this figure shows that when increases, the control scheme is more efficient in the reduction of large size avalanches. Finally, we also compare the efficiency of H-control scheme with R-control scheme. We can see that although both are efficient to reduce the probability of large avalanches, the former is much more efficient. The decrease in the probability of large avalanches results from the fact that, since only saturated sites are exploded by random process, some of them sites are correctly chosen. Furthermore, since the most connected nodes have by definition more neighbors, even if the explosion are wrongly selected, these explosions are likely to have some effect in the most connected nodes.
In the inset of Fig.1 we evaluate the efficiency of the control system by the ratio between the number of avalanches of the controlled to the uncontrolled system. It makes clear that the control system is actually reducing the number of large size avalanches, i.e., its effect is not restricted to increasing the number of small and medium size events. In this inset, we also illustrate the effect of increasing . It is intuitive that, if is decreased, the controller is less efficient to reduce the chance of large avalanches, but smaller are clearly more economical. This can be seen in the small region of the inset of Fig.1, where the number of small avalanches of the controlled system with is smaller than that with . plays a role similar to the acceptable size considered in [15]. Two costs are of relevance in this control scheme, namely the cost of scanning the high degree nodes in order to see if they are saturated and the cost of the intervention (explosion). Both of them increases linearly with .
We have also performed simulations considering GKK networks with other values of (such as ) implying in avalanches with different exponents of power law size distributions. Although there is a variation in the setting of the control scheme and in the number of interventions, the control schemes perform much like the ones presented in Fig.1.
An intuitive issue that was also checked in simulations is that, in the uncontrolled SOC system, the highest degree nodes always saturate in huge avalanches. Besides accumulating a large amount of mass, the highest degree nodes are also able to distribute a large amount of mass along the network. It is worth mentioning that the other nodes of the network clearly also accumulate mass and distribute that mass along the network in a scale proportional to their degrees. Therefore, the problem that the control scheme is facing here is the accumulation of mass over the nodes. If all the energy (represented by the mass) that is injected in the system was released in avalanches, there will be no large avalanches. Therefore, one may argue that the ability of the control scheme can be measured by the ability it has to reduce the concentration of mass in the system. This kind of information can be gathered evaluating where and are respectively the the Shannon entropy evaluated after and before the control intervention and .
It is possible to check whether the entropy change is an useful measure to estimate the ability of the control scheme in reducing the concentration of mass in the system. For this purpose, it is necessary to estimate the probability distribution of success in mass reduction. However, this effect can be better discussed in terms of the related complementary probabilities presented in Fig.2 and its inset.
For the sake of clearness, we divided the values of in two samples corresponding to positive and negative values. While the main figure shows the complementary distributions for positive values of , the inset shows the absolute values of the negative ones. Comparing the complementary probabilities of the positive values of and also considering the results presented in Fig.2, we found that the most efficient control schemes are more able to reduce the concentration of the mass of the system. On the other hand, if we compare the negative values of presented in the inset, we note that control schemes with higher increases more the concentration of mass of the system. This happens since control schemes with higher causes more explosions. However, note that the order of magnitude of the main figure and the inset are different. Besides, the random control is the one that causes more increasing of concentration in the system, since it causes a lot of bad selected explosions.
Therefore, based on Fig.1 and Fig.2 and the discursion presented above, it is worth reinforcing that the ability of the control scheme is related to the ability of reducing the concentration of the energy of the system. We do not need to make explosions in all nodes. Since the more important nodes are selected when we use the H-control, they are enough to reduce the concentration of energy of the system. On the other hand, even in the case of the R-control, the concentration of the energy in the system is also reduced. As we have already mentioned, if a node is randomly selected, there is good chance that this node is connected to a high degree and the control scheme also works. In fact, in both schemes, one may note that the intervention of the control scheme is not constrained to the nodes, but only one intervention is sometimes enough to reduce the concentration of mass in several nodes. We had already mentioned that another control strategy could be to transport the excess of mass from the system. Note that although this strategy may be also interested and investigated somewhere, it has an almost local effect. Our strategy may affect a large neighborhood of the network.
In Fig.3 we show results for a ER network built in order to have the same average degree of the GKK in Fig.3. The exponent of the avalanche size distribution in this ER network was determined to be , using the interval , which is roughly the value of the one found in [1]. It is also interesting to compare these results with the ones presented for the GKK networks. Note that these networks present the same average degree and also almost similar exponents of avalanche size distribution. However, for the same , the number of interventions in the ER networks are much larger than in the GKK networks. This can be explained by the bounded heterogeneity of the ER networks, what requires a larger number of interventions to get similar results. Indeed, while in the case of the GKK networks the largest avalanches vanish, the same does not happen to the ER networks. Finally, though one could expect that H-control and R-control should present similar results in the case of ER networks, this does not happen to be verified because of the presence of the bounded heterogeneity. Due to this particular feature, the H-control choosing the highest degree nodes is much more efficient than the R-control.
Fig.4 compares the the probability distribution function (PDF) of avalanche sizes of the uncontrolled BTW (solid symbols) with that of the controlled BTW (hollow symbols) taking place in the electrical power grid of the western United States [23]. The straight line in Fig. 3 is the best fit to the data for this network in the interval , which was used to determine the the exponent of the avalanche size distribution equal to . It is worthy noting that the range where the PDF can be approximated by a power law is much smaller than in the two former cases. We recall that even for GKK or ER networks with nodes, which is roughly the double of the number of the actual network, the range of power law validity was much larger than that displayed in Fig.4. In the inset of this figure we evaluate the efficiency of the control system by the ratio between the number of avalanches of the controlled to the uncontrolled system showing the good performance of the control scheme. Although we could expect that the behavior of the control scheme in this network should perform closer to the ER network than to the GKK network, it is difficult to prove the validity of this statement, since the range of validity of the power law of the avalanche size is much smaller.
4 Final remarks
We have proposed a control scheme to reduce the probability of large avalanches of SOC systems on complex networks. We show that the control scheme works and its efficiency is based on its ability of reducing the concentration of mass in the network. This work is an attempt in the direction of building controlled SOC systems that do not depend on replica models such as in [15].
Unfortunately, we cannot prove optimality of any of these strategies, since the mathematical model associated to this system is very complicated being a large set of non-linear coupled difference equations. In fact, in order to reach optimality, one should deal with partial removal of the demand from the nodes that are likely to become critical and consider all the possible order of triggering the avalanches. Partial removal may work worse than both strategies. Although partial removal may avoid avalanches created by the control scheme, it can allow the system to accumulate energy that in the future can cause larger avalanches. Therefore, we only intend to show that it is possible to reduce the size of avalanches on complex networks.
A really interesting agenda of research should be to develop a control system based on some kind of optimization principle that could be in some sense reduce the concentration of mass in the network. Another motivating path would be to apply these ideas in some real SOC systems.
5 Acknowledgment
D.O. Cajueiro and R.F.S. Andrade are partially supported by the Brazilian agency CNPQ. The authors also thank Professor D. J. Watts for making available the network of the electrical power grid of the western United States available.
References
- [1] E. Bonabeau, Journal of the Physical Society of Japan 64, 327 (1995)
- [2] S. Lise, M. Paczuski, Physical Review Letters 88, 228301 (2002)
- [3] K. I. Goh, D. S. Lee, B. Kahng, et al., Physical Review Letters 91, 148701 (2003)
- [4] D. S. Lee, K. I. Goh, B. Kahng, et al., Physica A 338, 84 (2004)
- [5] K. I. Goh, D. S. Lee, B. Kahng, et al., Physica A 346, 93 (2005)
- [6] A. P. Vieira, J. S. AndradeJr., H. J. Herrmann, et al., Physical Review E 76, 026111 (2007)
- [7] S. N. Dorogovtsev, A. V. Goltsev, J. F. F. Mendes, Reviews of Modern Physics 80, 1275 (2008)
- [8] P. Holme, B. J. Kim, C. N. Yoon, Physical Review E 65, 056109 (2002)
- [9] A. E. Motter, Physical Review Letters 93, 098701 (2004)
- [10] R. Albert, I. Albert, G. L. Nakarado, Physical Review E 69, 025103 (2004)
- [11] P. Crucitti, V. Lattora, M. Marchiori, Physical Review E 69, 045104 (2004)
- [12] L. Zhao, K. Park, Y. C. Lai, et al., Physical Review E 72, 025104(R) (2005)
- [13] L. Huang, Y. C. Lai, G. Chen, Physical Review E 78, 036116 (2008)
- [14] P. Bak, C. Tang, K. Wiesenfeld, Physical Review Letters 59, 381 (1987)
- [15] D. O. Cajueiro, R. F. S. Andrade, Physical Review E 81, 015102(R) (2010)
- [16] A. Subrahmanyam, Journal of Finance 49, 237 (1994)
- [17] C. M. C. Lee, M. J. Ready, P. J. Seguin, Journal of Finance 49, 183 (1994)
- [18] R. Pastor-Satorras, A. Vespignani, Physical Review E 65, 036104 (2002)
- [19] R. Cohen, S. Havlin, D. Ben-Avraham, Physical Review Letters 91, 247901 (2003)
- [20] L. K. Gallos, F. Liljeros, P. Argyrakis, Physical Review E 75, 045104 (2007)
- [21] Y. P. Chen, G. Paul, S. Havlin, et al., Physical Review Letters 101, 058701 (2008)
- [22] K. I. Goh, B. Kahng, D. Kim, Physical Review Letters 87, 278701 (2001)
- [23] D. J. Watts, S. H. Strogatz, Nature 393, 440 (1998)