abbr \citationstyledcu
Controlling self-organized criticality in sandpile models
Abstract
We introduce an external control to reduce the size of avalanches in some sandpile models exhibiting self organized criticality. This rather intuitive approach seems to be missing in the vast literature on such systems. The control action, which amounts to triggering avalanches in sites that are near to be come critical, reduces the probability of very large events, so that energy dissipation occurs most locally. The control is applied to a directed Abelian sandpile model driven by both uncorrelated and correlated deposition. The latter is essential to design an efficient and simple control heuristic, but has only small influence in the uncontrolled avalanche probability distribution. The proposed control seeks a tradeoff between control cost and large event risk. Preliminary results hint that the proposed control works also for an undirected sandpile model.
1Department of Economics – Universidade de Brasília, DF 70910-900, Brazil.
2Instituto de Física, Universidade Federal da Bahia, BA 40210-340, Brazil.
3National Institute of Science and Technology for Complex Systems, Brazil.
Introduction.
Since the seminal ideas of self organized criticality (SOC) [bak87] were applied to a simple sandpile model, this concept has evolved to describe a much larger number of systems such as earthquakes [sch91], evolutionary bursts [baksne93], forest fires [drosch92], rice piles [fre96] and financial markets [bar06]. In SOC dynamics, energy is injected at a constant low rate while dissipation occurs in avalanche-like events of different sizes.
Human beings have always attempted to understand and control nature. Within SOC framework, “control” can be understood as a series of man-devised actions to interfere in the processes by which the system dissipates energy, in such way as to concentrate dissipation in moderate sized events and reduce the occurrence probability of very large avalanches. The difficulties to control large events like earthquakes, hurricanes, floods and so on, depend both on the magnitude of the stored energy as well as on the impossibility of interfering, in appropriate way, in the dynamics of energy dissipating events. However, under certain limits, other events following SOC statistics can be subject to human control. In particular, there are studies that deal with the engineering problem of inducing snow avalanches in restricted hill slides [mccsch93], where the purpose is to warrant safety for ski riders. Although not explored yet, similar control may reduce crisis caused by the break of large economic bubbles, which arise due to asymmetry of information or speculative behavior [harkre78].
In this work, we show how it is possible to reduce the risk associated to the occurrence of large avalanches in a SOC system, by considering the most simple directed Abelian sand pile model proposed by Dhar and Ramaswamy [dha89]. The control scheme, devised to avoid large avalanches in a pre-selected restricted area of the system, is divided into two different stages. In the first one there is no direct intervention in the system. The control just learns about the dynamics of the system and acquires a global estimate of avalanche risk in the pre-selected area. In the second stage, which starts when such knowledge has been achieved, the control scans the preselected region and identifies potentially large events whenever the avalanche risk is high enough. Once a threat is detected, an externally induced avalanche is triggered. The scanning phase has a large cost of CPU time and computer operations during numerical simulations, but does not modify the model rules. Changes in the rules are restricted to the intervention phase. The devised control heuristic takes into account a simple balance between cost and risk represented by large events.
The research area on control strategies applied to specific outputs of a complex system is of increasing interest. The classical example is the chaos control methodology [ott90, hubler89]. Other examples may be found in complex social systems [cajmal08], complex biological networks [cha08], communication systems [hay94], and discharge plasmas [din94].
The controlled Dhar model.
The Dhar model [dha89] considers a two-dimensional square lattice of sites , . Each site stores a certain amount of mass units. At each time step, the system is driven by two update rules: (a) Addition rule: at each time step, a mass unit is added to a randomly selected site , so that . (b) Toppling rule: if , then , and . The model is usually represented after performing a rotation of the standard square lattice, in such a way the site lies just below the site , and the and directions are at and angles with the horizontal axis.
To speed up the avalanche size control, we may change the nature of the mass deposition process. It amounts to consider a weighted deposition probability similar to the one presented in [ohtiwa92]: if at time , a particle was deposited on the site , the probability to select the site to add the particle at is
| (1) |
where is the Euclidian distance between sites and , while and are constants related to the normalization of and to the largest distance between any two sites on the system. The uncorrelated scenario corresponds to choosing and , . The correlated deposition rules can be justified by the existence of a natural time correlation in rain, snow, social and financial events. The model was implemented both for and . Although this change is not essential to the results, uncorrelated deposition causes a noticeable additional tracking cost. The size control also takes advantage of the fact that the model is directed.
It is convenient to distinguish between SOC systems that require the presence of a “carrier” for the event propagation (trees in forest-fire models) from those which do not (sand avalanches). Control mechanisms are more easily to be implemented on actual system with carriers. Although Dhar’s model assume essential sandpile features, it requires the presence of excess mass along the avalanche path, or the event dies out. Thus, the model dynamics is, in a certain sense, similar to those for systems with carriers. On the other hand, models that aim to describe systems without such feature, e.g., sliding snow avalanches with increasing size, may not be suitable to be controlled along the proposed lines.
In order to implement an useful strategy, it is necessary to select a target size , which is a choice for the largest natural avalanche that might occur in the system. Of course , otherwise we would have to release down hill the added mass grain at each time unit. Therefore, consider the two dimensional system schematically represented by the array
| (2) |
In (2), each element of indicated by , , , , , , , , and represents by itself a fixed size square region of sites, corresponding to smaller arrays of order . We assume here that avalanche size control takes place inside region only. indicates all matrix positions that are not in the Moore neighborhood of . and label the following neighboring positions with respect to : Bottom, Left, Right, and Top. They play a special role in our study, as they may trigger or just propagate, avalanches that reach the region . They can bounce back or simply be influenced by avalanches triggered inside . The model dynamics is uniform over the whole lattice, so that sites on the border of any region may receive (deliver) grains from (to) the neighboring region.
A number of steps is required to control the avalanche sizes inside . An avalanche in may arise when the deposition process adds a particle in a site belonging to this region (internal avalanche), or as consequence of an avalanche that started in another region of the system (external avalanche). The mathematical modeling of this process (at least in finite scale, far from the thermodynamic limit) is not simple, since it is based on a larger set of coupled stochastic nonlinear difference equations.
Let be the set of all regions in the system . In the first control stage, one has to estimate the conditional probability of occurring the addition of mass in region at time assuming mass was added on a site in region at time . In the second stage, such estimates lead to the definition of a threshold value that decides whether the control should be activated whenever a new mass unit is deposited in a given region of . If at time , mass is added on the region and , then the control should be activated. Such activation requires to check the effect of adding a unit mass at any of the sites in the controlled region , i.e., to follow any virtual avalanche that would occur inside the region if any of the sites in were actually chosen at random. In order to follow the virtual avalanches, we consider an internal replica of the system, i.e., a restricted copy of the model that describes its dynamics inside the region , as if it was isolated from the rest of . Based on this replica of , if any added particle in site generates a virtual avalanche of size , the control “explodes” the corresponding site of . This means that a real avalanche is triggered by emptying the site , which amounts to topple the single unit mass with of probability to the site or to the site .
For instance, let be given as follows.
Assume that the control is activated with . Then, the control scans the region seeking for danger of great avalanches. Note that the only occupied occupied site that may trigger an avalanches larger than is the one at the first line, while the occupied sites at the second and third lines are not dangerous. Therefore, the control explodes the critical site and, depending on the side grain topples, one may find one either the configurations (if the grain topples leftwards) or (if in the other direction). In this example, in no other situation the control would intervene in the system.
A fundamental point here is that the size of the virtual avalanche observed in is only a lower bound estimation of the actual avalanches that take place in . First, the replica considers a priori that the internal avalanches are entirely contained in , not considering the influence that these avalanches may receive from their Moore neighbors. Second, the restricted model clearly does not consider the external avalanches that may be triggered in other areas of the system and reach . The balance between cost and risk considers that our control is devised to avoid large avalanches within and that, due to the large size of , it would be unacceptably expensive to propose a scheme to follow all possible avalanches over the entire system.
The control cost is measured by the number of sites that were accessed to verify whether they are saturated or not, and by the number of explosions that have been carried out. If a site is saturated, it is necessary to assess the size of the possible “virtual” avalanche. This requires the cost of simulating the event for any site that could become critical. For the correlated process (1) and appropriate threshold value , the cost control can be reduced. Indeed, for a strongly correlated deposition process, there is only a small probability that it will add particles in the region at if a unit mass was added to any of the other 40 regions of system that are not in the Moore neighborhood of at time .
Results.
The choice of is based on the following robust heuristic based on the neighbors of region :
| (3) | |||||
.
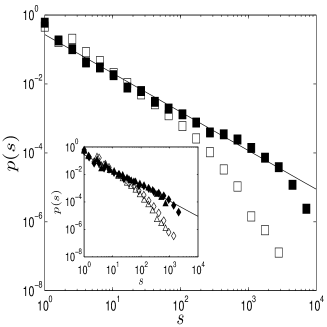
Eq. (3) was implemented in systems with regions (see Eq.(2)), with and , and in Eq.(1). Fig.1 compares the the probability distribution function (PDF) of avalanche sizes of the uncontrolled system (solid symbols) with that of the controlled system (hollow symbols). Note that counts only the number of sites in that topple during the event and, correspondingly, identifies avalanches where at least one toppling site belongs to . Thus, in a given event, can be smaller than the total number of toppling sites in the whole system. While the data of the uncontrolled system include internal and external avalanches, those of the controlled system include internal, external, as well as avalanches triggered by the control system. The PDF of the uncontrolled systems seems to follow a power law with exponent , while the PDF obtained for the original Dhar model is described by an exponent . The straight line in Fig.1 is the best fit to the data for the system with in the interval . It is clear from Fig.1 that the same exponent holds for the systems with and 64 as their slope are roughly the same as for . Finite size effects are made evident by the position of the last two points, which deviate from the straight line. Fig.1 also shows that the introduced control is able to strongly reduce the probability of large events. Graphs with similar features are obtained when .
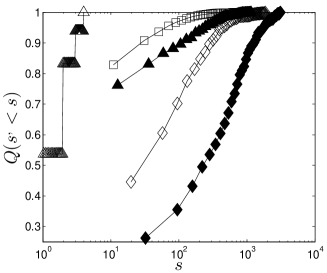
In Fig.2, we show the complementary probabilities , where describes the specific avalanche distribution types, i.e., indicates internal, external, or control induced (explosion) avalanches. Fig.2, where each individual is normalized to 1, shows clearly the effect of the external control on the size and on the type of avalanches. Although we use the replica to follow possible avalanches, the control is efficient to reduce both internal and external avalanches.
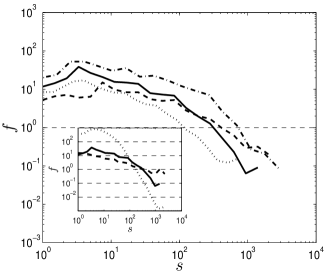
Fig.3 evaluates the efficiency of the control system by the ratio between the number of avalanches of the controlled to the uncontrolled system. It makes clear that the control system is actually reducing the number of large size avalanches, i.e., its effect is not restricted to increasing the number of small and medium size events. In Fig.3, we also illustrate the effect of increasing . It is intuitive that, if is increased, the controller is less efficient to reduce the chance of large avalanches, but larger values are clearly more economical. This can be seen in the small region of Fig.3, where the number of small avalanches of the controlled system with is smaller than that with . To be more precise, the and require, respectively, 0.32 and 0.12 interventions per time. In fact, the computational cost of the scanning phase was empirically determined to have the same order of growth as and to have a smaller order of growth than . Moreover, we have empirically found that the number of interventions has a smaller order of growth than and decreases almost linearly with .
The inset in Fig.3 shows the performance of the random control, which scans the system with the same frequency of targeted control and blindly explodes some saturated sites. The slight decrease in the number of large avalanches results from the fact that, since only saturated sites are exploded by random process, some of them sites are correctly chosen. However, the random control performs much worse for any values of and .
It is still worth commenting that, in the uncorrelated deposition process, the transition probability from any region to any region is the same and, in our case, given by . If , the controller will never scan the system, but if it will do at each time step and, contrary to what we observed above, the scanning cost would be very high. Our simulations have shown that controlling a process with correlated or uncorrelated deposition presents very similar performance in risk reduction, as long as is sufficiently small. This happens because both of them will intervene only when there is a risk of “virtual” avalanche larger than .
Although we have considered the Dhar’s model as a starting point for studying the problem of controlling systems that exhibit SOC, results from preliminary simulations in Fig.3 suggest that these ideas also work for undirected systems such as the BTW model [bak87]. In that case, the undirected nature of the model causes a much larger number of small and medium size explosion avalanches.
Final remarks.
Our results show that a simple control system reduces the risk of large avalanches in SOC models. Interesting paths to be followed are: (1) To propose a control scheme that does not depend on the simulated virtual avalanches, but only on some properties of the internal structure of the system that can be used as early-warning signals [ram09, sch09]; (2) To apply this scheme to real SOC systems such as the one presented in [alt01].
Acknowledgment.
The authors thank CNPq (Brazilian agency) for financial support.
References
- [1] \harvarditem[Altshuler et al.]Altshuler, Ramos, Martinez, Flores \harvardand Noda2001alt01 Altshuler, E., Ramos, O., Martinez, C., Flores, L. E. \harvardand Noda, C. \harvardyearleft2001\harvardyearright. Avalanches in one-dimensional piles with different types of bases, Physical Review Letters 86: 5490–5493.
- [2] \harvarditemBak \harvardand Sneppen1993baksne93 Bak, P. \harvardand Sneppen, K. \harvardyearleft1993\harvardyearright. Punctuated equilibrium and criticality in a simple model of evolution, Physical Review Letters 71: 4083.
- [3] \harvarditem[Bak et al.]Bak, Tang \harvardand Wiesenfeld1987bak87 Bak, P., Tang, C. \harvardand Wiesenfeld, K. \harvardyearleft1987\harvardyearright. Self organized criticality: an explanation of noise, Physical Review Letters 59: 381.
- [4] \harvarditem[Bartolozzi et al.]Bartolozzi, Leinweber \harvardand Thomas2006bar06 Bartolozzi, M., Leinweber, D. B. \harvardand Thomas, A. W. \harvardyearleft2006\harvardyearright. Scale-free avalanche dynamics in the stock market, Physica A 370: 132–139.
- [5] \harvarditemCajueiro \harvardand Maldonado2008cajmal08 Cajueiro, D. O. \harvardand Maldonado, W. L. \harvardyearleft2008\harvardyearright. Role of optimization on the human dynamics of tasks execution, Physical Review E 77: 035101(R).
- [6] \harvarditem[Chakrabarti et al.]Chakrabarti, Rabitz, Springs \harvardand McLendon2008cha08 Chakrabarti, R., Rabitz, H., Springs, S. L. \harvardand McLendon, G. L. \harvardyearleft2008\harvardyearright. Mutagenic evidence for the optimal control of evolutionary dynamics, Physical Review Letters 100: 258103.
- [7] \harvarditemDhar \harvardand Ramaswamy1989dha89 Dhar, D. \harvardand Ramaswamy, R. \harvardyearleft1989\harvardyearright. Exactly solved model of self organized critical phenomena, Physical Review Letters 63: 1659–1662.
- [8] \harvarditem[Ding et al.]Ding, She, Huang \harvardand Yu1994din94 Ding, W. X., She, H. Q., Huang, W. \harvardand Yu, C. X. \harvardyearleft1994\harvardyearright. Controling chaos in a discharge plasma, Physical Review Letters 72: 96–99.
- [9] \harvarditemDrossel \harvardand Schwabl1992drosch92 Drossel, B. \harvardand Schwabl, F. \harvardyearleft1992\harvardyearright. Self-organized critical forest-fire model, Physical Review Letters 69: 1629.
- [10] \harvarditem[Frette et al.]Frette, Christensen, Malthe-Sorenssen, Feder, Jossang \harvardand Meakin1996fre96 Frette, V., Christensen, K., Malthe-Sorenssen, A., Feder, J., Jossang, T. \harvardand Meakin, P. \harvardyearleft1996\harvardyearright. Avalanche dynamics in a pile of rice, Nature 379: 49.
- [11] \harvarditemHarrison \harvardand Kreps1978harkre78 Harrison, J. M. \harvardand Kreps, D. M. \harvardyearleft1978\harvardyearright. Speculative investor behavior in a stock market with heterogeneous expectations, Quarterly Journal of Economics 92: 323–336.
- [12] \harvarditem[Hayes et al.]Hayes, Grebogi, Ott \harvardand Mark1994hay94 Hayes, S., Grebogi, C., Ott, E. \harvardand Mark, A. \harvardyearleft1994\harvardyearright. Experimental control of chaos for communication, Physical Review Letters 73: 1781–1784.
- [13] \harvarditemHűbler1989hubler89 Hűbler, A. \harvardyearleft1989\harvardyearright. Adaptive control of chaotic systems, Helvetica Physica Acta 62: 343–346.
- [14] \harvarditemMcClung \harvardand Schaerer1993mccsch93 McClung, D. \harvardand Schaerer, P. \harvardyearleft1993\harvardyearright. The avalanche handbook, The Mountaineers, Seattle.
- [15] \harvarditemOhtsuki \harvardand Iwata1992ohtiwa92 Ohtsuki, T. \harvardand Iwata, H. \harvardyearleft1992\harvardyearright. Avalanches with correlated deposition, Physical Review A 45: 2228–2232.
- [16] \harvarditem[Ott et al.]Ott, Grebogi \harvardand Yorke1990ott90 Ott, E., Grebogi, C. \harvardand Yorke, J. A. \harvardyearleft1990\harvardyearright. Controling chaos, Physical Review Letters 64: 1196–1199.
- [17] \harvarditem[Ramos et al.]Ramos, Altshuler \harvardand Maloy2009ram09 Ramos, O., Altshuler, E. \harvardand Maloy, K. J. \harvardyearleft2009\harvardyearright. Avalanche prediction in a self-organized pile of beads, Physical Review Letters 102: 078701.
- [18] \harvarditem[Scheffer et al.]Scheffer, Bascompte, Brock, Brovkin, Carpenter, Dakos, Held, VanNes, Rietkerk \harvardand Sugihara2009sch09 Scheffer, M., Bascompte, J., Brock, W. A., Brovkin, V., Carpenter, S. R., Dakos, V., Held, H., VanNes, E. H., Rietkerk, M. \harvardand Sugihara, G. \harvardyearleft2009\harvardyearright. Early-warning signals for critical transitions, Nature 461: 53.
- [19] \harvarditemScholz1991sch91 Scholz, C. H. \harvardyearleft1991\harvardyearright. The mechanics of earthquakes and faulting, Cambridge University Press, Cambridge.
- [20]