An Echo of Supernova 2008bk111Based in part on observations with the NASA/ESA Hubble Space Telescope, obtained at the Space Telescope Science Institute (STScI), which is operated by AURA, Inc., under NASA contract NAS5-26555.
Abstract
I have discovered a prominent light echo around the low-luminosity Type II-Plateau Supernova (SN) 2008bk in NGC 7793, seen in archival images obtained with the Wide Field Channel of the Advanced Camera for Surveys on-board the Hubble Space Telescope (HST). The echo is a partial ring, brighter to the north and east than to the south and west. The analysis of the echo I present suggests that it is due to the SN light pulse scattered by a sheet, or sheets, of dust located 15 pc from the SN. The composition of the dust is assumed to be of standard Galactic diffuse interstellar grains. The visual extinction of the dust responsible for the echo is mag, in addition to the extinction due to the Galactic foreground toward the host galaxy. That the SN experienced much less overall extinction implies that it is seen through a less dense portion of the interstellar medium in its environment. The late-time HST photometry of SN 2008bk also clearly demonstrates that the progenitor star has vanished.
Subject headings:
dust, extinction — scattering — supernovae: general — supernovae: individual (SN 2008bk) — galaxies: individual (NGC 7793)1. Introduction
A light echo from a supernova (SN) explosion is likely to be a common occurrence. When not resolved, the presence of light echoes around extragalactic supernovae (SNe) can be inferred based on excesses in their late-time optical and infrared light curves (e.g., Wright, 1980; Dwek, 1983; Graham et al., 1983; Graham & Meikle, 1986; Schaefer, 1987; Milne & Wells, 2003; Welch et al., 2007; Mattila et al., 2008a; Miller et al., 2010; Meikle et al., 2011; Otsuka et al., 2012; Sugerman et al., 2012). Recently, the detections of ancient light echoes around SNe in the Galaxy (Krause et al., 2005, 2008a, 2008b; Rest et al., 2008b) and the Large Magellanic Cloud (LMC; Rest et al., 2005, 2008a) have spectacularly realized what both Shklovskii (1964) and van den Bergh (1965, 1966) had speculated about decades ago. Echoes can also reveal the properties of energetic Galactic events that are not quite (yet) SNe (e.g., Bond et al., 2003; Rest et al., 2012a).
Up till now, eight nearby extragalactic SNe have had spatially-resolved echoes discovered around them: SN 1987A in the LMC (e.g., Crotts, 1988; Emmering & Chevalier, 1989; Bond et al., 1990), SN 1991T in NGC 4527 (Schmidt et al., 1994; Sparks et al., 1999), SN 1993J in Messier 81 (Sugerman & Crotts, 2002; Liu, Bregman, & Seitzer, 2003), SN 1995E in NGC 2441(Quinn et al., 2006), SN 1998bu in Messier 96 (Cappellaro et al., 2001), SN 1999ev in NGC 4274 (Maund & Smartt, 2005), SN 2003gd in Messier 74 (Sugerman, 2005; Van Dyk et al., 2006), and SN 2006X in Messier 100 (Wang et al., 2008; Crotts & Yourdon, 2008). Although both the interstellar and circumstellar echoes from the Type II SN 1987A could be discovered from the ground, the echoes around the other SNe had to be revealed by the superior angular resolution of the Hubble Space Telescope (HST).
These light echoes result from the luminous ultraviolet (UV)/optical emission pulse from a SN being scattered by dust in the SN environment. The UV pulse will tend to photoionize much of the circumstellar matter and destroy smaller dust grains nearest to the SN, while more distant, larger grains survive the pulse. The light echo we see at a given instant is the intersection of the dust filament or sheet with the (virtual) ellipsoid surface of constant arrival time associated with that particular instant of time. Such an intersection is in nearly all cases a circle or arclet. Light echoes can probe both the circumstellar and the largest interstellar structures in the SN environment (Sugerman, 2003). From the scattered SN light, the size distribution and composition of the dust grains can be determined (e.g., Sugerman, 2003). Light echoes also provide a means to measure the distance to the SN, and therefore its host galaxy, based purely on geometrical arguments and independent of any distance ladder (Panagia et al., 1991; Sparks, 1994, 1996). Light echoes also allow three-dimensional spectroscopy of transients (e.g., Rest et al., 2012b).
I have discovered a resolved light echo around the SN II-Plateau (II-P) 2008bk in the nearby host galaxy NGC 7793. SN 2008bk has been recently analyzed by Van Dyk et al. (2012a; also ). Furthermore, G. Pignata et al. (in preparation) possess a rich dataset on this SN. In these studies the spectroscopic and photometric properties of the SN have been shown to most closely resemble the low-luminosity SN II-P 1999br in NGC 4900 (Pastorello et al. 2004). Furthermore, Van Dyk et al. characterized the nature of the red supergiant (RSG) progenitor star of SN 2008bk, seen in very high-quality, multi-band ground-based images obtained prior to explosion. Those authors were able to constrain the initial mass of the progenitor to 8–8.5 . The presence of the echo around SN 2008bk has been revealed through very late-time observations of the host galaxy with HST.
2. Observations
2.1. HST Data
The site of SN 2008bk was observed on 2011 January 17.23 UT with the Advanced Camera for Surveys (ACS) Wide Field Channel (WFC) as part of program GO-12196 (PI: D. Radburn-Smith). The explosion epoch was likely JD 2454548 (G. Pignata et al., in preparation), so these images were obtained when the SN was at an age d, or 2.81 yr. The bandpasses and exposure times were F606W (999 s) and F814W (1175 s). The site was also observed on 2011 April 30.0, at SN age 3.11 yr, with both the UVIS and IR channels of the HST Wide-Field Camera 3 in F814W (915 s), F125W (461.8 s), and F160W (828.6 s), all in subarray mode, as part of GO-12262 (PI: J. Maund). I obtained all of these data from the HST public archive, where standard STScI pipeline procedures had been employed to calibrate the images. The ACS/WFC data had been corrected for charge-transfer efficiency (CTE) losses in the pipeline.
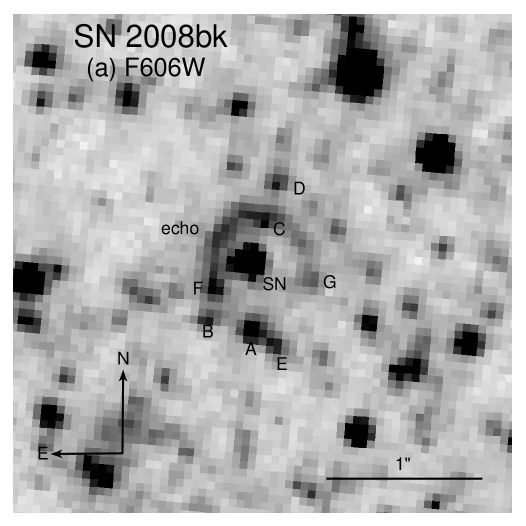
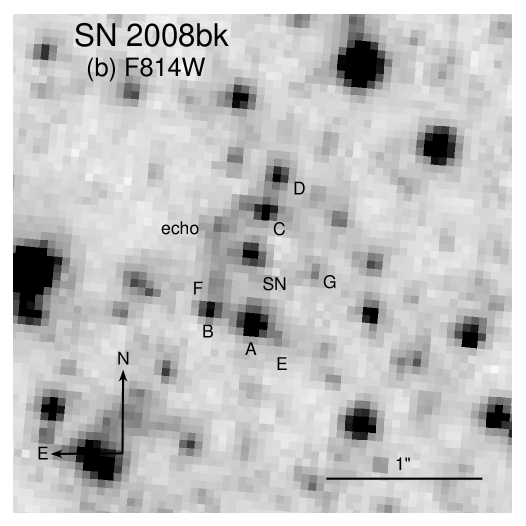
The F606W () image from 2011 January is shown in Figure 1. The field is crowded and replete in stars of various brightnesses around the SN position within the host galaxy. The prominent light echo can clearly be seen in the HST image. The object inside the echo is SN 2008bk. The light from the SN is presumably responsible for the echo. The echo is also detected in the ACS and WFC3 F814W images, but not in the WFC3/IR images.
As seen most clearly at F606W, the light echo is an incomplete, although notably quite circular, arc of emission, most prominent toward the north and far less evident in the south. The echo is less prominent in the F814W images. The echo center does not exactly coincide with the SN position, which indicates that the dust distribution is itself inclined with respect to our line-of-sight. (Tylenda 2004 showed that, even for an inclined dust sheet, the shape of a light echo is still approximately circular, although with the center of the echo offset from the source.) The point-spread function (PSF) of the SN appears more extended due east in the F555W image, possibly due to the presence of a fainter, blue star; the profile is less extended in the F814W image.
I measured the SN brightness in both F606W and F814W, using the package Dolphot v2.0 (Dolphin 2000), with the ACS package, which automatically accounts for WFC PSF variations across the chips, zeropoints, aperture corrections, etc. The output from the package automatically includes the transformation from flight-system F606W and F814W to the corresponding Johnson-Cousins (Bessell 1990) magnitudes (in and ), following the prescriptions of Sirianni et al. (2005). I also analyzed the WFC3 subarray data using Dolphot. The resulting photometry for the SN from all of these images is given in Table 1.
The brightness of the SN in 2011 January was mF606W=23.284 (=23.226) and mF814W=23.767 (=23.762) mag, which are 0.5 mag and 3.0 mag fainter in and , respectively, than the observed brightness of the progenitor RSG (Van Dyk et al. 2012a). No doubt should therefore exist that this star was seen to explode in 2008 and has subsequently vanished. (See also Mattila et al. 2010.)
2.2. Ground-Based Data
I obtained publicly available image data from the European Southern Observatory (ESO) archive. The images were acquired in and bands at the 3.58 m New Technology Telescope (NTT) with the ESO Faint Object Spectrograph and Camera (EFOSC2) as part of programs 082.A-0526 (PI: M. Hamuy), 083.D-0970 and 184.D-1140 (PI of both: S. Benetti), as well as in only at the 8.2 m Very Large Telescope (VLT) Unit Telescope 1 with the FOcal Reducer and low dispersion Spectrograph (FORS2) as part of program 083.D-0131 (PI: S. Smartt). I used PSF fitting of these images using DAOPHOT (Stetson 1987) within IRAF222IRAF (Image Reduction and Analysis Facility) is distributed by the National Optical Astronomy Observatories, which are operated by the Association of Universities for Research in Astronomy, Inc., under cooperative agreement with the National Science Foundation. to extract photometry of the SN and calibrated the photometry using the local stellar sequence shown in Van Dyk et al. (2012a). The results of this photometry are given in Table 1.
In addition, I include the earlier-time and photometry for SN 2008bk from Van Dyk et al. (2012a) and also preliminary -band photometry up to day 127 graciously provided by G. Pignata. The complete light curves in these two bands are shown in Figure 3.
Shown for comparison in Figure 3 is the expected decline rate, 0.98 mag (100 d)-1, associated with thermalization by the ejecta of -rays from the radioactive decay of 56Co. The light curves on the tail essentially follow this decline rate, particularly at (e.g., Patat et al. 1994), up to day 450. However, after day 450 the light curves decline more rapidly till day 600; this is likely due to the SN becoming more transparent to -rays, or possibly to the formation of dust, or both (e.g., Hendry et al. 2005). After this time, the decline is more gradual up to day 900, when the curves decline at a higher rate to reach what appears to be, at least at , a gradual decline once again. From a comparison with the late-time spectra of the (peculiar) SN II-P 1987A in Phillips et al. (1990) and Pun et al. (1995), one finds that the evolution of the luminosity in is likely driven primarily by changes in the relative strengths of nebular H, [O i]6300, 6364 and Na i 5890, 5896, whereas the -band luminosity evolution is affected almost exclusively by [Ca ii]7291, 7323 and [Fe ii]7155, 7172 emission (the [Ca ii] IR triplet and [C i]8727 line are present in this band, but are much weaker), which both fade in strength relative to H after day 600.
3. Analysis of the Echo
I attempted to measure the brightness of the echo in both bands from the drizzled image mosaics. Unfortunately, three, or possibly four, stars, or star-like objects, in the SN field are seen superposed along the arc. I used PSF fitting in IRAF/DAOPHOT to subtract away the stars in the field, including most of those along the arc itself. Two of the stars would not subtract easily, so I let them remain in the images, and then used the IRAF task “listpix” to obtain the individual pixel values in the remaining portions of the arc, avoiding the residuals from the stars that did subtract away and the profiles of the stars that did not.
I estimated the average count rate per pixel in the echo to be e- s-1 pixel-1 in F606W and e- s-1 pixel-1 in F814W over 72 pixels in each band. After subtracting the average sky pixel count rate, 0.085 and 0.049 e- s-1 pixel-1 in F606W and F814W, respectively, and assuming the VEGAMAG zero points from Sirianni et al. (2005) and a WFC plate scale of pixel-1, these correspond to average surface brightnesses of and mag arcsec-2. Integrating in each band over the echo, which is an incomplete ring, I find and mag, with negligible difference resulting from the transformation (again, following Sirianni et al.) to and mag, given the echo’s color, i.e., mag. Assuming Vega fluxes as the zero points, the echo has fluxes and erg cm-2 s-1 Å-1.
The light echo ellipsoid can approximated as a paraboloid (e.g., Chevalier 1986; Schaefer 1987). The perpendicular linear distance of the line-of-sight to the SN from the line-of-sight to the echo is , where is the SN’s distance from Earth and is the angular distance between the two lines-of-sight. The echo width, as seen in the PSF-subtracted ACS F606W image, is unresolved (or barely resolved), with a profile FWHM approximately that of point sources detected in this image before PSF subtraction. I measure the echo’s diameter to be 12.0 pixels from peak to peak of the profile across the echo. The echo radius, therefore, is 6.0 pixels, with an uncertainty of about pixel. This corresponds to . Assuming the Cepheid distance to NGC 7793, Mpc (Pietrzyński et al. 2010), then pc.
The distance from the SN to any scattering element along the echo, , can be derived from , where is the distance from the SN to the echo along the line-of-sight (Couderc 1939). For pc (2.81 ly), I find that pc and pc, with an uncertainty of pc, resulting from the uncertainties in the estimates of and .
The echo is, therefore, most likely a result of scattering from interstellar, not circumstellar, dust, given this distance. For a duration of the RSG phase of yr and a wind speed km s-1, the circumstellar matter would only be pc () in radius. Additionally, much of any circumstellar dust was likely destroyed by the UV SN pulse (e.g., Sugerman 2003; Van Dyk et al. 2012b).
It can be assumed that the echo arises from single scattering in a thin sheet of dust between us and the SN, and that the sheet thickness is much smaller than the distance between the SN and the sheet (which is effectively true; see below). The scattered flux at time from the echo at a given wavelength or bandpass is then
| (1) |
where is the fluence of the SN at time , and , in units of inverse time, is the fraction of light scattered by the echo toward the observer, which depends on the echo geometry and the nature of the dust (Chevalier 1986; Cappellaro et al. 2001; Patat 2005). The total SN light is effectively treated as a short pulse over which the SN flux is constant, i.e., (Cappellaro et al. 2001; Patat 2005). The SN fluence is the integral of the light curves with respect to time in each band.
Performing this integration (neglecting the overall small uncertainties in the observed SN photometry) and, again, assuming Vega as the flux zero point, I find and erg cm-2 Å-1 in and , respectively. The duration of the SN pulse in each bandpass can be obtained by assuming to be the SN maximum flux, i.e., and mag. I then find to be d in and d in . These durations are essentially equivalent to the plateau timescales in both bands, i.e., the light from the plateau, not surprisingly when the SN is brightest, contributes the most to the overall SN pulse. The effective pulse width (Sugerman & Crotts 2002; Sugerman 2003), , is then pc from and pc from . Since the echo is essentially unresolved, the quantity is less than the FWHM of a stellar profile (or, 2 pixels), i.e., pc. The actual dust thickness from these observed quantities (e.g., Sugerman 2003) is then pc.
| (2) |
where is the H number density, is the scattering coefficient for a given grain radius , is the dust grain cross section for scattering, and
| (3) |
is the phase function (Henyey & Greenstein 1941), which applies for the bandpasses being considered here (Draine 2003). The term measures the degree of forward scattering for a dust grain of radius . The scattering angle, , is defined by (e.g., Schaefer 1987). For this echo, the scattering angle is then . The term is the grain size distribution for grain radius . Following Sugerman (2003), I adopt the dust grain distributions for (spherical) silicate and carbonaceous grains from Weingartner & Draine (2001). I assume “standard” diffuse interstellar dust and adopt the composition of 53% silicate and 47% graphite grains from Mathis et al. (1977), with the and for “smoothed UV astronomical silicate” grains (Draine & Lee 1984; Laor & Draine 1993; Weingartner & Draine 2001) and for carbonaceous graphite (Draine & Lee 1984; Laor & Draine 1993).
I find, therefore, that I can fully account for the observed flux from the echo, assuming that the SN light has been scattered by diffuse interstellar dust. The model results are and erg cm-2 s-1 Å-1 at and , respectively, if I assume that cm-2 in the dust sheet producing the echo.
The uncertainty in , above, formally arises from the uncertainty in (and also therefore in ). However, another source of uncertainty in the light echo profile is from the scattering dust width, which can range from fractions of a ly (e.g., Cassiopeia A; Rest et al. 2011b) to a few ly (e.g., SN 1987A; Sinnott et al. 2013), and can broaden the profile. I have found, above, that the dust width is 32 ly; the calculation of is only valid under the assumption that , which appears to be essentially true based on the measured quantities. Additional uncertainty arises from the inclination of the dust sheet with respect to the line of sight (Rest et al. 2011a; 2012a), which can stretch the echo profile. The host galaxy itself has an inclination and position angle of and , respectively (Carignan & Puche 1990; Bibby & Crowther 2010). The echo should be observed at a later epoch to measure the motion on the sky of the echo center and to infer the dust sheet inclination (Tylenda 2004; Rest et al. 2011a). (The echo did not appear to change perceptibly in shape or radius between the F814W images in 2011 January and April.) However, in the meantime I can provide an estimate of the inclination from the apparent offset in the plane of the sky of the echo center from the SN position. Following Tylenda (2004) for a plane-parallel dust slab, for an offset of 1.1 pc and with the assumed value of , I find that an inclination angle of 52 is consistent with this measured offset. Finally, the asymmetry in the SN explosion also introduces uncertainty in the echo properties (Rest et al. 2011b; Sinnott et al. 2013). For SN 2008bk it is unclear what was the degree of asymmetry in the explosion — Leonard et al. (2012) found that the spectropolarimetric observations of this SN were not well accounted for by existing time-dependent radiative-transfer models for SNe II-P. Nevertheless, the observed fluxes and model fluxes that I have calculated agree remarkably well, to within the formal uncertainties.
The relation between and visual extinction , e.g., from Güver & Özel (2009), implies that the of the dust responsible for the echo is mag. This is interesting, in that Van Dyk et al. (2012a) assumed that the extinction within the host galaxy immediately around SN 2008bk must be essentially zero, since a total extinction to the SN equivalent to that from the Galactic foreground alone, i.e., mag from Schlegel, Finkbeiner, & Davis (1998), was sufficient to account for the observed data. A more recent estimate of the Galactic foreground extinction toward the SN is mag by Schlafly & Finkbeiner (2011)333Using the foreground extinction calculator at the NASA/IPAC Extragalactic Database, NED, at http://ned.ipac.caltech.edu/., allowing for additional extinction of mag to exist internal to the host galaxy along the line-of-sight to the SN. The echo, though, must result from a denser part of the dust sheet than what we peer through toward the SN. This is consistent with the filamentary nature of dust in the interstellar medium and its effect on observed light echoes (e.g., Rest et al. 2011a). One can see the non-uniform surface brightness of the echo in Figure 1, which likely results from filaments within the dust sheet. For an echo at 3.4 Mpc, even with HST, we do not have the luxury of the precise spatial detail seen in the dust structures responsible for the echoes around the much closer Cas A (e.g., Rest et al. 2008b) or SN 1987A (e.g., Crotts 1988), and therefore cannot fully model the actual dust distribution in the environment of SN 2008bk.
4. Discussion and Conclusions
The SN 2008bk progenitor was identified in ground-based images, albeit of high quality (seeing FWHM for the Gemini images, Van Dyk et al. 2012a; , , and FWHM for the VLT images, Mattila et al. 2008b). With the SN now having significantly faded, several much fainter stars around it are revealed in the HST images (see Figure 1). This, then, raises the question as to what level these stars contributed to the overall brightness of the progenitor star, as seen from the ground. The processing of the HST data within Dolphot also resulted in photometry for these stars, which is given in Table 2. In the first place, the stars are all at a level of a factor (15% or less) of the progenitor flux at , at (the brightest is Star A, which is from the SN), and at and . All of these stars are, of course, in the wings of the progenitor star’s profile, where the actual fractional contribution of their fluxes to that of the progenitor would be further diminished.
I have analyzed each of the pre-SN Gemini-S GMOS and VLT images considered by Van Dyk et al. (2012a), carefully examining the residual images produced by the DAOPHOT PSF fitting (and subsequent subtraction) used to obtain the stellar photometry. As best as I could discern, by comparing the HST images to the ground-based residual images, the stars from Table 2, when they actually could be distinguished (which was generally only for the brighter of these stars in each band), appear to persist after PSF subtraction. In other words, DAOPHOT had adequately fit the profile of the progenitor star in each of the ground-based images, leaving the surrounding stars as part of the residual from the fit. In particular, stars A through D are clearly seen in the Gemini -band residual image. All of the stars are comparatively fainter at , so it is not certain that they would have been well detected in the Gemini image before PSF fitting. Similarly, the and VLT images actually may not have been deep enough to detect these faint stars, compared to the much brighter progenitor. I therefore conclude that these stars likely had a negligible effect on the progenitor’s brightness in all of the bands, as seen from the ground. I note that, as the SN continues to fade, other stars may appear within the SN’s, and, therefore, the progenitor’s, PSF. (I have already noted, above, that the SN PSF is asymmetric at , possibly due to a very close neighboring star.) However, the overall satisfactory comparison that Van Dyk et al. (2012a) made between the model spectral energy distribution and the observed photometry for the progenitor is consistent with an overall lack of significant contamination by immediate neighbors.
In summary, I have discovered a prominent light echo around the SN II-P 2008bk in NGC 7793 in archival HST images obtained at late times. The echo can be fully explained by the scattering of the observed light curves for the SN by a distribution of standard interstellar dust at a distance of pc from the SN. The density of the echo-producing dust is larger than that toward the SN itself, since the inferred extinction of the echo dust is mag, whereas the extinction internal to the host toward the SN is much lower, mag. Additionally, from the very late-time light curves it is evident that the progenitor star has vanished. The stars in the immediate environment of SN 2008bk do not appear to have contaminated the photometry of the progenitor, and therefore the estimates of the bolometric luminosity, effective temperature, and initial mass made by Van Dyk et al. (2012a) for the star continue to hold.
This echo should be further monitored with HST, particularly in the blue, to better constrain the nature of the scattering dust and the echo geometry, and to reveal further new or evolving structures in the echo.
References
- Bessell (1990) Bessell, M. S. 1990, PASP, 102, 1181
- Bibby & Crowther (2010) Bibby, J. L., & Crowther, P. A. 2010, MNRAS, 405, 2737
- Bond et al. (1990) Bond, H. E., Gilmozzi, R., Meakes, M. G., et al. 1990, ApJ, 354, L49
- Bond et al. (2003) Bond, H. E., Henden, A., Levay, Z. G., et al. 2003, Nature, 422, 405
- Cappellaro et al. (2001) Cappellaro, E., Patat, F., Mazzali, P. A., et al. 2001, ApJ, 549, L215
- Carignan & Puche (1990) Carignan, C., & Puche, D. 1990, AJ, 100, 394
- Chevalier (1986) Chevalier, R. A. 1986, ApJ, 308, 225
- Couderc (1939) Couderc, P. 1939, Annales d’Astrophysique, 2, 271
- Crotts (1988) Crotts, A. P. S. 1988, ApJ, 333, L51
- Crotts & Yourdon (2008) Crotts, A. P. S., & Yourdon, D. 2008, ApJ, 689, 1186
- Dolphin (2000) Dolphin, A. E. 2000, PASP, 112, 1383
- Draine (2003) Draine, B. T. 2003, ApJ, 598, 1017
- Draine & Lee (1984) Draine, B. T., & Lee, H. M. 1984, ApJ, 285, 89
- Dwek (1983) Dwek, E. 1983, ApJ, 274, 175
- Emmering & Chevalier (1989) Emmering, R. T., & Chevalier, R. A. 1989, ApJ, 338, 388
- Graham et al. (1983) Graham, J. R., Meikle, W. P. S., Selby, M. J., et al. 1983, Nature, 304, 709
- Graham & Meikle (1986) Graham, J. R., & Meikle, W. P. S. 1986, MNRAS, 221, 789
- Güver & Özel (2009) Güver, T., & Özel, F. 2009, MNRAS, 400, 2050
- Hendry et al. (2005) Hendry, M. A., Smartt, S. J., Maund, J. R., et al. 2005, MNRAS, 359, 906
- Henyey & Greenstein (1941) Henyey, L. C., & Greenstein, J. L. 1941, ApJ, 93, 70
- Krause et al. (2005) Krause, O., Rieke, G. H., Birkmann, S. M., et al. 2005, Science, 308, 1604
- Krause et al. (2008a) Krause, O., Birkmann, S. M., Usuda, T., et al. 2008a, Science, 320, 1195
- Krause et al. (2008b) Krause, O., Tanaka, M., Usuda, T., et al. 2008b, Nature, 456, 617
- Laor & Draine (1993) Laor, A., & Draine, B. T. 1993, ApJ, 402, 441
- Leonard et al. (2012) Leonard, D. C., Dessart, L., Hillier, D. J., & Pignata, G. 2012, American Institute of Physics Conference Series, 1429, 204
- Liu, Bregman, & Seitzer (2003) Liu, J.-F., Bregman, J. N., & Seitzer, P. 2003, ApJ, 582, 919
- Massey et al. (2005) Massey, P., Plez, B., Levesque, E. M., et al. 2005, ApJ, 634, 1286
- Mathis et al. (1977) Mathis, J. S., Rumpl, W., & Nordsieck, K. H. 1977, ApJ, 217, 425
- Mattila et al. (2008a) Mattila, S., Meikle, W. P. S., Lundqvist, P., et al. 2008a, MNRAS, 389, 141
- Mattila et al. (2008b) Mattila, S., Smartt, S. J., Eldridge, J. J., et al. 2008b, ApJ, 688, L91
- Mattila et al. (2010) Mattila, S., Smartt, S., Maund, J., Benetti, S., & Ergon, M. 2010, arXiv:1011.5494
- Maund & Smartt (2005) Maund, J. R., & Smartt, S. J. 2005, MNRAS, 360, 288
- Meikle et al. (2011) Meikle, W. P. S., Kotak, R., Farrah, D., et al. 2011, ApJ, 732, 109
- Miller et al. (2010) Miller, A. A., Smith, N., Li, W., et al. 2010, AJ, 139, 2218
- Milne & Wells (2003) Milne, P. A., & Wells, L. A. 2003, AJ, 125, 181
- Otsuka et al. (2012) Otsuka, M., Meixner, M., Panagia, N., et al. 2012, ApJ, 744, 26
- Panagia et al. (1991) Panagia, N., Gilmozzi, R., Macchetto, F., Adorf, H.-M., & Kirshner, R. P. 1991, ApJ, 380, L23
- Pastorello et al. (2004) Pastorello, A., Zampieri, L., Turatto, M., et al. 2004, MNRAS, 347, 74
- Patat et al. (1994) Patat, F., Barbon, R., Cappellaro, E., & Turatto, M. 1994, A&A, 282, 731
- Patat (2005) Patat, F. 2005, MNRAS, 357, 1161
- Phillips et al. (1990) Phillips, M. M., Hamuy, M., Heathcote, S. R., Suntzeff, N. B., & Kirhakos, S. 1990, AJ, 99, 1133
- Pietrzyński et al. (2010) Pietrzyński, G., Gieren, W., Hamuy, M., et al. 2010, AJ, 140, 1475
- Pun et al. (1995) Pun, C. S. J., Kirshner, R. P., Sonneborn, G., et al. 1995, ApJS, 99, 22
- Quinn et al. (2006) Quinn, J. L., Garnavich, P. M., Li, W., et al. 2006, ApJ, 652, 512
- Rest et al. (2005) Rest, A., Suntzeff, N. B., Olsen, K., et al. 2005, Nature, 438, 1132
- Rest et al. (2008a) Rest, A., Matheson, T., Blondin, S., et al. 2008a, ApJ, 680, 1137
- Rest et al. (2008b) Rest, A., Welch, D. L., Suntzeff, N. B., et al. 2008b, ApJ, 681, L81
- Rest et al. (2011a) Rest, A., Sinnott, B., Welch, D. L., et al. 2011a, ApJ, 732, 2
- Rest et al. (2011b) Rest, A., Foley, R. J., Sinnott, B., et al. 2011b, ApJ, 732, 3
- Rest et al. (2012a) Rest, A., Prieto, J. L., Walborn, N. R., et al. 2012a, Nature, 482, 375
- Rest et al. (2012b) Rest, A., Sinnott, B., & Welch, D. L. 2012b, PASA, 29, 466
- Schaefer (1987) Schaefer, B. E. 1987, ApJ, 323, L47
- Schlafly & Finkbeiner (2011) Schlafly, E. F., & Finkbeiner, D. P. 2011, ApJ, 737, 103
- Schlegel, Finkbeiner, & Davis (1998) Schlegel, D. J., Finkbeiner, D. P., & Davis, M. 1998, ApJ, 500, 525
- Schmidt et al. (1994) Schmidt, B. P., Kirshner, R. P., Leibundgut, B., et al. 1994, ApJ, 434, L19
- Shklovskii (1964) Shklovskii, I. S. 1964, Astr. Circ. U.S.S.R., No. 306
- Sinnott et al. (2013) Sinnott, B., Welch, D. L., Rest, A., Sutherland, P. G., & Bergmann, M. 2013, ApJ, 767, 45
- Sirianni et al. (2005) Sirianni, M., Jee, M. J., Benítez, N., et al. 2005, PASP, 117, 1049
- Sparks (1994) Sparks, W. B. 1994, ApJ, 433, 19
- Sparks (1996) Sparks, W. B. 1996, ApJ, 470, 195
- Sparks et al. (1999) Sparks, W. B., Macchetto, F., Panagia, N., et al. 1999, ApJ, 523, 585
- Stetson (1987) Stetson, P. B. 1987, PASP, 99, 19
- Sugerman & Crotts (2002) Sugerman, B. E. K., & Crotts, A. P. S. 2002, ApJ, 581, L97
- Sugerman (2003) Sugerman, B. E. K. 2003, AJ, 126, 1939
- Sugerman (2005) Sugerman, B. E. K. 2005, ApJ, 632, L17
- Sugerman et al. (2012) Sugerman, B. E. K., Andrews, J. E., Barlow, M. J., et al. 2012, ApJ, 749, 170
- Tylenda (2004) Tylenda, R. 2004, A&A, 414, 223
- van den Bergh (1965) van den Bergh, S. 1965, PASP, 77, 269
- van den Bergh (1966) van den Bergh, S. 1966, PASP, 78, 74
- Van Dyk et al. (2006) Van Dyk, S. D., Li, W., & Filippenko, A. V. 2006, PASP, 118, 351
- Van Dyk et al. (2012a) Van Dyk, S. D., Davidge, T. J., Elias-Rosa, N., et al. 2012a, AJ, 143, 19
- Van Dyk et al. (2012b) Van Dyk, S. D., Cenko, S. B., Poznanski, D., et al. 2012b, ApJ, 756, 131
- Wang et al. (2008) Wang, X., Li, W., Filippenko, A. V., et al. 2008, ApJ, 677, 1060
- Welch et al. (2007) Welch, D. L., Clayton, G. C., Campbell, A., et al. 2007, ApJ, 669, 525
- Weingartner & Draine (2001) Weingartner, J. C., & Draine, B. T. 2001, ApJ, 548, 29
- Wright (1980) Wright, E. L. 1980, ApJ, 242, L23
| UT date | JD2450000 | F555W | F814W | F125W | F160W | SourcebbNTT/EFOSC2 = New Technology Telescope + ESO Faint Object Spectrograph and Camera (EFOSC2); VLT/FORS2 = Very Large Telescope + FOcal Reducer and low dispersion Spectrograph (FORS2); HST/ACS = HST + Advanced Camera for Surveys Wide-Field Channel; HST/WFC3 = HST + Wide-Field Camera 3 UVIS/IR. | ||
|---|---|---|---|---|---|---|---|---|
| (mag) | (mag) | (mag) | (mag) | (mag) | (mag) | |||
| 2009 Jan 09.55 | 4840.05 | 17.08(04) | 15.70(02) | NTT/EFOSC2 | ||||
| 2009 Sep 05.71 | 5080.21 | 20.10(04) | VLT/FORS2 | |||||
| 2009 Sep 13.67 | 5087.17 | 20.06(04) | 19.32(03) | NTT/EFOSC2 | ||||
| 2009 Oct 22.52 | 5126.02 | 20.68(04) | 19.92(04) | NTT/EFOSC2 | ||||
| 2009 Nov 22.55 | 5157.05 | 21.05(04) | 20.47(04) | NTT/EFOSC2 | ||||
| 2010 Sep 16.69 | 5455.19 | 22.17(07) | 21.48(12) | NTT/EFOSC2 | ||||
| 2011 Jan 17.73 | 5578.23 | 23.35(01) | 23.31(01) | 23.58(02) | 23.57(02) | HST/ACS | ||
| 2011 Apr 29.48 | 5680.98 | 23.96(05) | 23.68(08) | 23.78(10) | HST/WFC3 |
| Star | bbThis is the total offset of the centroid of the star from that of the SN. | F606W | ACS/F814W | WFC3/F814W | F125W | F160W | ||
|---|---|---|---|---|---|---|---|---|
| () | (mag) | (mag) | (mag) | (mag) | (mag) | (mag) | (mag) | |
| A | 0.45 | 24.65(03) | 25.12 | 23.05(01) | 23.04 | 23.09(03) | 21.80(02) | 21.11(01) |
| B | 0.47 | 25.47(05) | 25.89 | 24.13(03) | 24.02 | 24.35(06) | 22.89(04) | 22.36(03) |
| C | 0.28 | 25.18(04) | 25.57 | 23.93(03) | 23.94 | 24.17(06) | 22.78(04) | 22.15(03) |
| D | 0.55 | 25.25(04) | 25.63 | 24.05(03) | 24.13 | 24.32(06) | 23.13(05) | 22.41(03) |
| E | 0.54 | 25.36(04) | 25.36 | 25.35(07) | 24.98 | 25.52(15) | ||
| F | 0.28 | 25.01(03) | 24.98 | 25.21(06) | 25.09 | 25.58(15) | 22.89(04) | 22.36(03) |
| G | 0.38 | 26.04(07) | 26.21 | 25.48(08) | 25.35 | 25.41(13) |