Magnonic band gaps in waveguides with a periodic variation of the saturation magnetization
Abstract
We present a micromagnetic analysis of spin-wave propagation in a magnonic crystal realized as a permalloy spin-wave waveguide with a spatial periodical variation of its saturation magnetization. Frequency band gaps were clearly observed in the spin-wave transmission spectra and their origin is traced back to an overlap of individual band gaps of the fundamental and the higher order spin-wave width modes. The control of the depth, width and the position in frequency and space of the rejection band gaps by the width areas with a reduced magnetization and by the modulation level, are discussed in this study.
- PACS numbers
-
75.30.Ds, 75.78.Cd, 85.70.Kh
pacs:
75.30.Ds, 75.78.Cd, 85.70.KhThe transmission spin-wave spectra in magnetic materials with a periodic variation of their properties - magnonic crystals (MC) - show evidence of special properties that are distinctive from those of uniform media. Most noticeable is the appearance of rejection bands, i.e. frequency intervals over which the propagation of spin waves is forbidden.YuGulyaev ; SVysotskii Furthermore, the spin-wave group velocity and phase are strongly modified at the band gap edges and they can be artificially manipulated.ChumakPRL All these properties make magnonic crystals good candidates for signal processing and information transfer devices such as delay lines,Ustinov logicDing and storage elements.ChumakPRL
A variety of magnonic crystal designs have been proposed and tested in order to improve their operational characteristics and to realize new signal processing procedures. For example, magnonic crystals are fabricated from different magnetic materials,Wan ; Kruglyak with different shapesKimHan ; ChumakmuMC ; Ciubotaru or with a local variation of the bias field. ChumakCurrent ; ChumakReversal The best transmission properties were achieved for MCs that are based on yttrium-iron-garnet (YIG) ferrite films, due to the extremely small spin-wave losses in this material. APL-chumak ; APLChumak However, modern microwave devices require micro-sized elements which can hardly be produced from YIG. Previous studies performed on shape-modulated permalloy waveguides have shown good transmission characteristics with deep band gaps. Moreover, the possibility to control the number of the band gaps by a proper choice of the MC geometry was demonstrated.ChumakmuMC ; Ciubotaru Nevertheless, these MCs are characterized by a non-resonant spurious scattering on each geometric non-uniformity of the waveguide which results in an increase of the transmission loss and a broadening of the frequency gap. This effect is not always desirable in the signal processing.Ciubotaru ; KimHan A reliable substitute for a shape modulated crystal is given by a bi-component MC where two magnetic materials are placed periodically.KrawczykPRB ; Wan ; Gubbiotti ; Kostylev However, fabrication of a two-component MC involves multi step and high precision e-beam lithography and film deposition which complicates the fabrication procedure. An alternative design comprises structures with a periodical variation in the saturation magnetization by an ion implantation technique.Obry
Here we present a systematic micromagnetic study of a one-component magnonic crystal based on a permalloy (Py) waveguide with a periodic variation of its saturation magnetization. Such structures can be realized, e.g., by local ion irradiation.Obry We show that the spin-wave transmission characteristics exhibits pronounced frequency band gaps which depend on both the level of the magnetization modulation and the size of the areas with a reduced magnetization. Furthermore, the role of the higher-order spin-wave width modes characterized by a quantization number of the wavevector component transverse to the stripe due to the finite width, is also discussed.
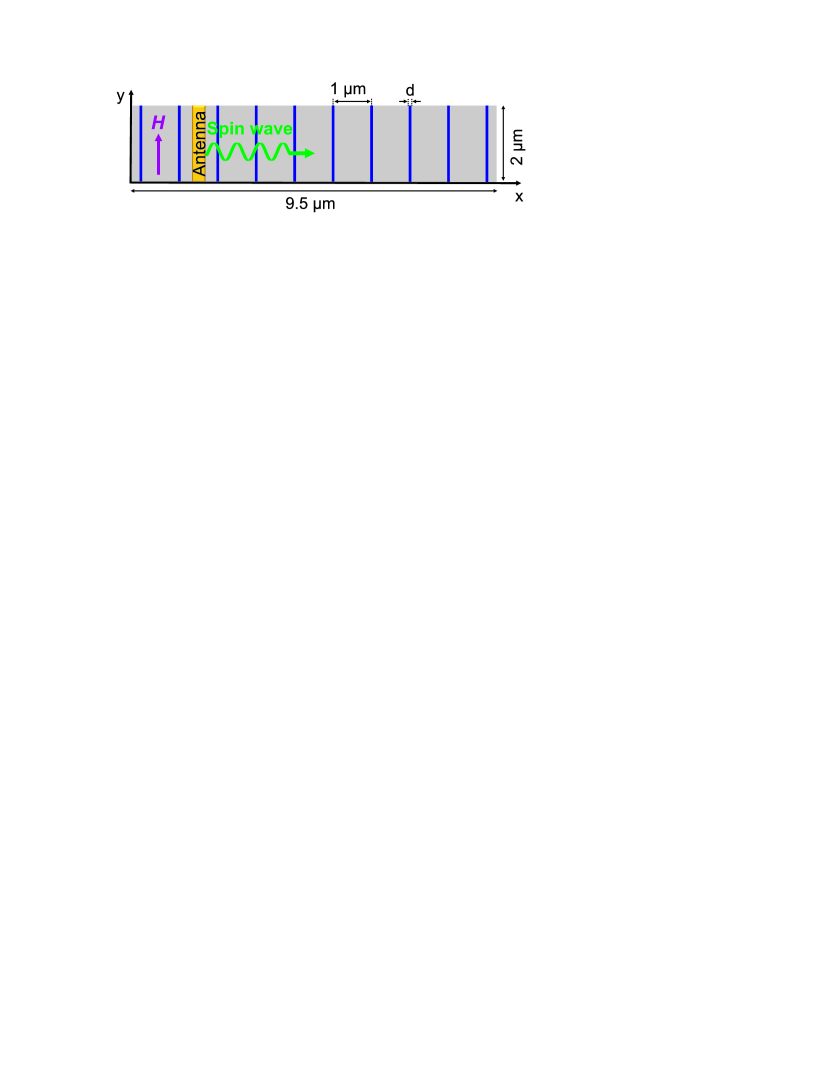
The magnonic crystal structure is presented in Fig. 1. A 40 nm thick permalloy waveguide with a width of 2 m is magnetized transverse to its long axis by a static biasing magnetic field of mT. The length of the waveguides is 9.5 m. The spatial variation of the magnetization was expressed according to a step-like function. The MC lattice constant, i.e. the periodicity of the area where the saturation magnetization was decreased, is m. The simulatedOOMMF area was discretized into cells, each cell having a size of nm3. The standard material parameters of Py were used: saturation magnetization T, exchange stiffness constant J/m and zero magnetocrystalline anisotropy. In order to avoid spin-wave reflection at the ends of the structure ( and m) the following damping boundary conditions were used: in the boundary areas (m on each side) the damping parameter gradually increases more than fifty times resulting in a strong decay of the spin-wave intensity towards the boundaries Dvornik1 .
In order to excite spin waves within a wide frequency range we apply a rectangular magnetic field pulse with a duration of 70 ps and an amplitude of 3 mT. The field is oriented in the -direction and is uniformly distributed in a 300 nm wide area across the Py waveguide. This area plays the role of a spin-wave excitation antenna. The cut-off frequency limit given by the pulse duration is 13.5 GHz while the antenna can excite spin-waves with wavenumbers up to rad/m (which corresponds to a frequency of 54.6 GHz at mT applied field). The applied static magnetic field satisfies the conditions for the excitation and propagation of magnetostatic surface spin waves (MSSWs). These waves are known to have the highest values of the group velocity in magnetic microstructures and ensure a propagation distance in the order of several micrometers in a permalloy film.
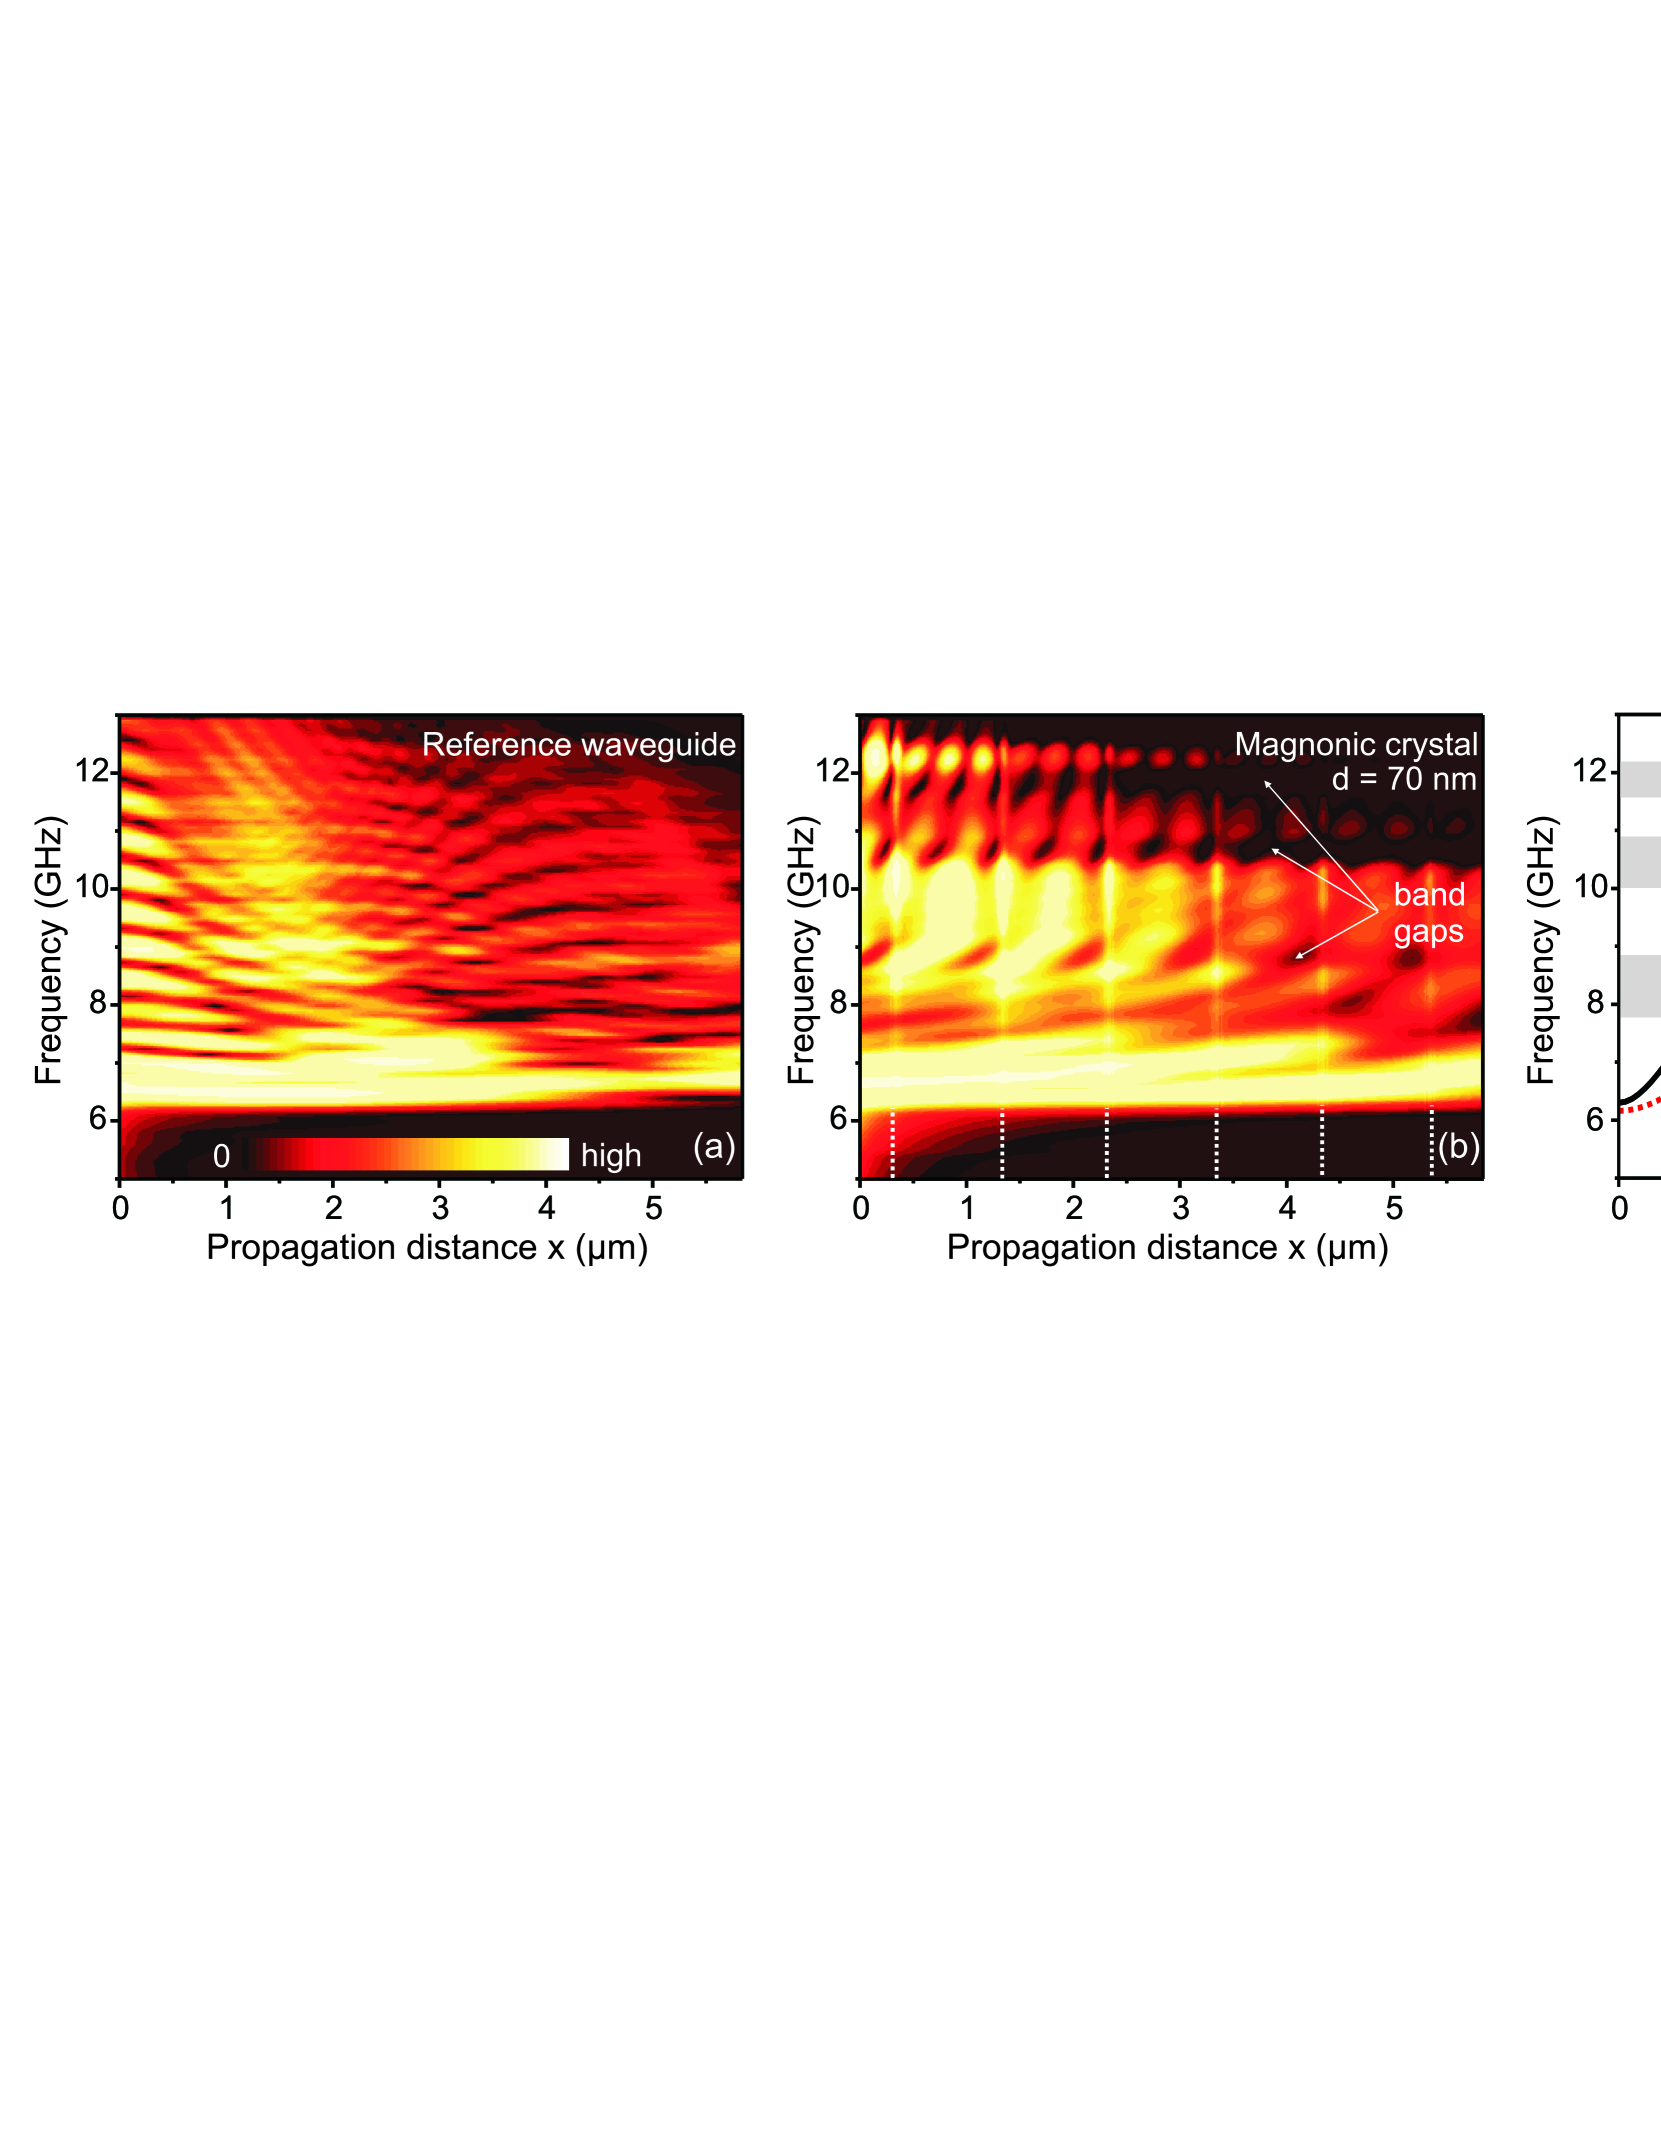
As a reference, we simulated a regular permalloy waveguide with the same dimensions as the magnonic crystal. The spin-wave intensity extracted from the simulation as a function of the frequency and of the propagation distance from the antenna is displayed in Fig. 2(a). One can observe that no spin-wave transmission is allowed below a frequency of 6.1 GHz, which corresponds to the ferromagnetic resonance (FMR) frequency, i.e. spin waves with zero wavenumbers. The non-zero intensities observed below 6.1 GHz are a result of the forced excitation of the magnetization dynamics and are only detected close to the antenna. The maximum intensity corresponds to long-wavelength spin waves with the highest excitation efficiency and the highest group velocity that are excited just above the FMR frequency. With increasing frequency and, implicitly, with increasing spin-wave wavenumber, the excitation efficiency decays.Demidov1 Furthermore, one can notice a frequency and a distance dependent oscillation of the spin-wave intensity even for the case of a regular Py waveguide. These fluctuations suggest that interference between the fundamental and higher order width modes play an important role in the spin-wave propagation.Buttner ; PPirro
The spin-wave intensity map obtained by simulating a magnonic crystal with a periodical reduction of 10% of the saturation magnetization over an area width nm remains virtually unchanged (figure not shown). However, a decrease of 20% in the saturation magnetization changes the spin-wave intensity map drastically, as can be seen in Fig. 2(b). Three spin-wave band gaps are visible and their frequencies are closely correlated with the Bragg reflection wavenumbers as can be seen by looking at the dispersion relations displayed in Fig. 2(c). The spin-wave band gap corresponding to the first Bragg wavenumber rad/m is visible at 8 GHz. The second band gap ( rad/m) and the third one ( rad/m) are very pronounced near 10.7 GHz and 11.8 GHz, respectively. The fact that the first band gap is not as clearly defined can be understood by taking into account that the antenna excites higher order width spin-wave modes along with the fundamental one. The Bragg reflection for each width mode occurs at different frequencies (see Fig. 2(c)). At a given frequency, when one mode is Bragg reflected, the other width modes are still transmitted, thus the total intensity is not as strongly affected. However, this effect becomes less important for higher-order band gaps since the frequencies of the width modes are getting closer to each other. Thus, one can conclude that the higher order spin-wave width modes play an important role: The frequency position and width of the band gaps are determined by the superposition of the partial band gaps formed by individual spin-waves width modes. It is worth mentioning that the wavelength of spin waves is not only determined by the local magnetization but is sensitive to the average magnetization of the entire sample. Therefore, the spin wave dispersion relations from Fig. 2(c) were analytically calculated taking into account an average saturation magnetization of the structure of T where is the number of regions with reduced magnetization and L is the total length of the waveguide.
Comparing the two spin-wave intensity maps obtained for a regular Py waveguide and for the 20% MC (Fig. 2) one can remark that the decay of the spin-wave amplitude over distance is the same for both structures. In addition, a periodic variation of the spin-wave intensity as a function of the propagation distance is clearly visible inside of MC. This variation manifests in the appearance of local intensity maxima in the crystal areas with unchanged saturation magnetization (each single period). One maximum at 10 GHz, two maxima at 11 GHz and three at 12.3 GHz are visible inside these areas. They can be understood as a formation of quasi-standing modes due to multiple reflections at the boundaries where was reduced. It should be noted that the wavelength of the quasi-standing modes fulfill the condition , where is an integer parameter and is the width of the area of unchanged magnetization. These observations underline the fact that a magnonic crystal works as a series of coupled resonators.
To control the frequency of the band gaps it should be taken into account that they are mainly determined by the Bragg wavenumbers and the spin-wave dispersion relation. The dispersion relation is strongly dependent on and on the bias magnetic field. A change in the magnetic field or in the saturation magnetization shifts the spin-wave dispersion relation up or down and, implicitly, increases or decreases the frequency of the band gap at the fixed Bragg wavenumbers. A variation of the MC lattice constant changes the wavelength of spin waves that satisfy the reflection Bragg condition ( integer), and consequently the band gap frequency. However, the above parameters do not provide any information about the depth of the band gaps. To have a complete overview of the band gaps behavior we performed a systematic analysis by manipulating both the width of the implanted areas and the level of the magnetization variation of the MC structure.
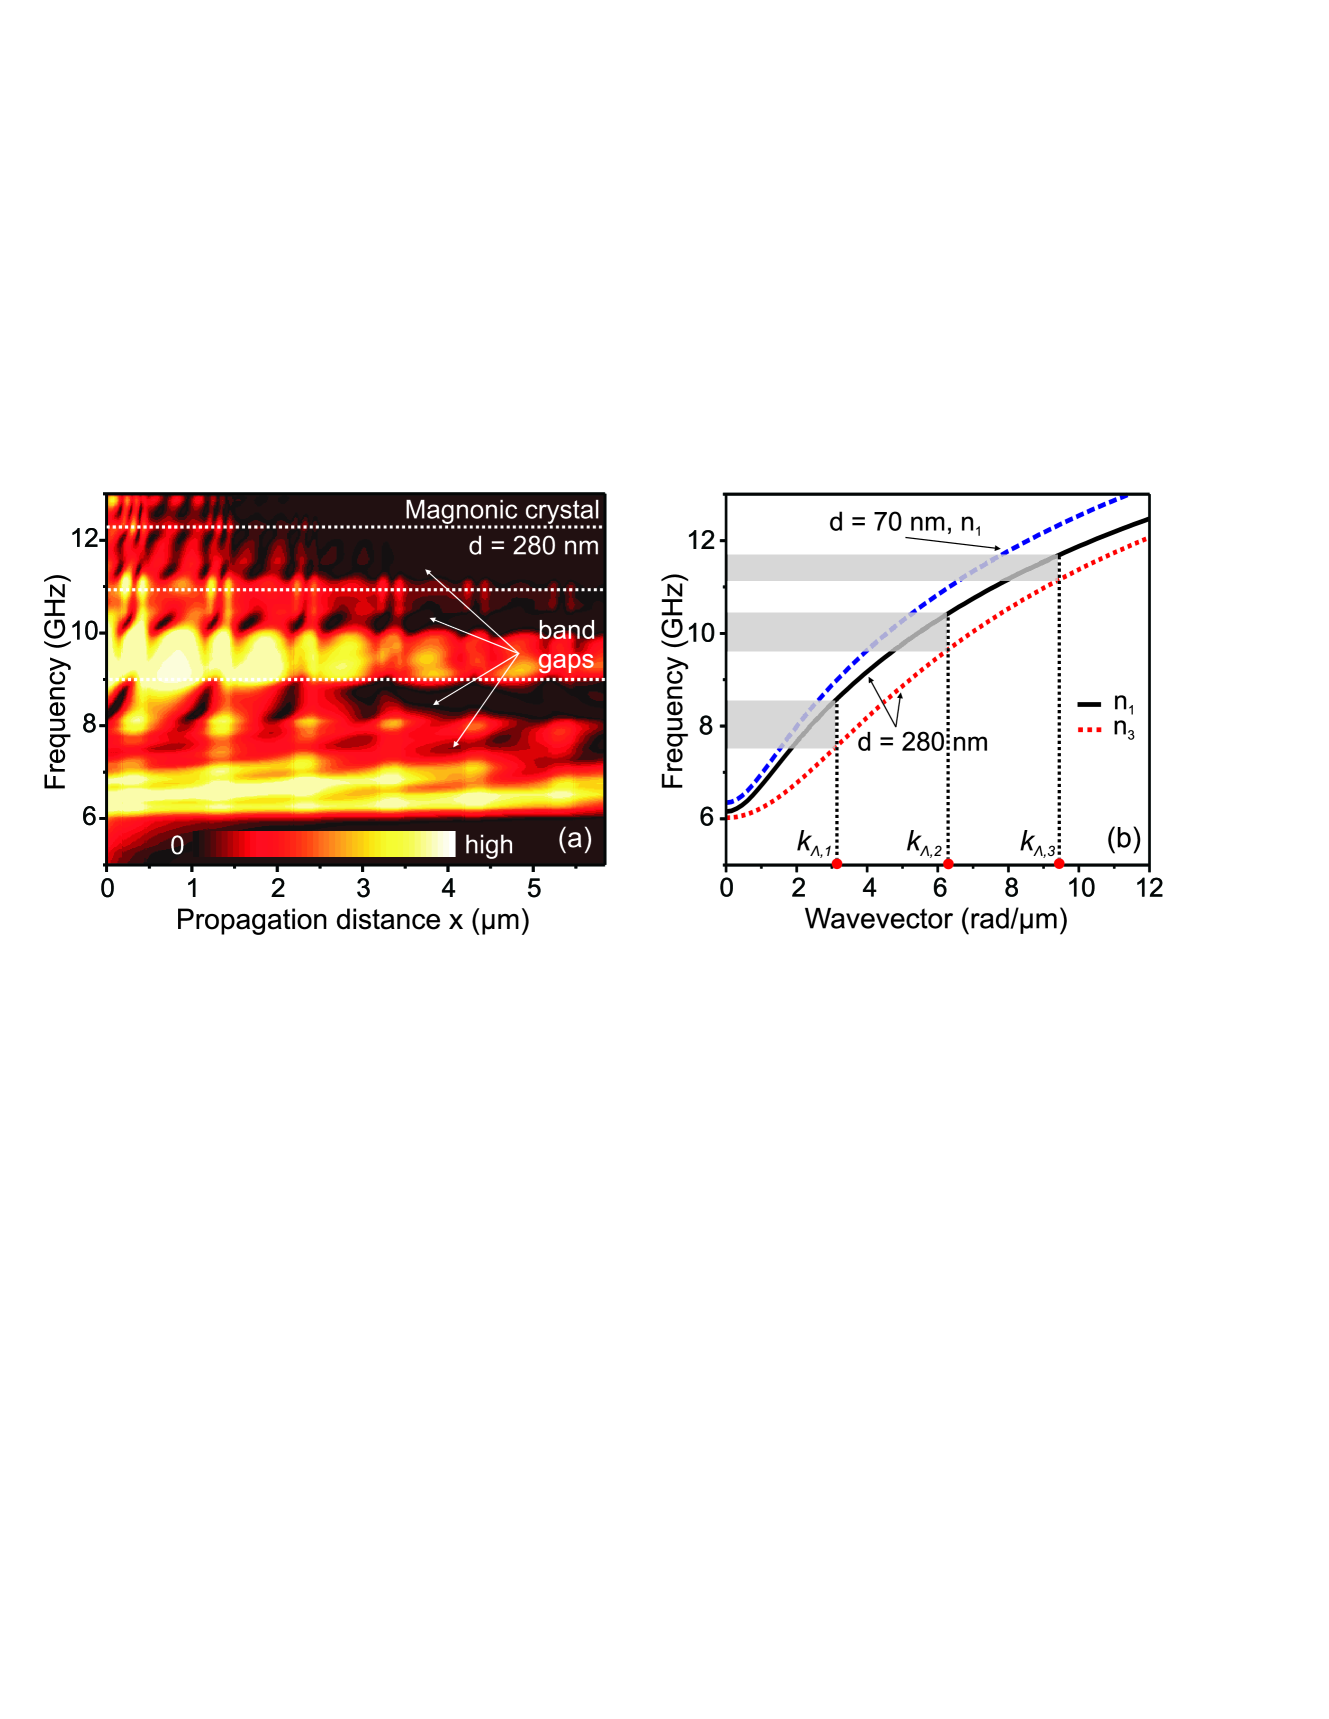
By simulating an MC with a 30% reduction with respect to we observed a stronger attenuation even for the transmitted spin waves. For example, above 10 GHz the spin waves can propagate for only 1.5 m. This decay is caused by an increased reflection at the boundaries between areas with different magnetization values. Keeping a 20% reduction of and increasing the length of the doping area by increasing from 70 nm to 280 nm we observe deeper band gaps while the propagation distance in the transmission bands remains nearly unchanged, as can be seen in Fig. 3(a). It can be concluded that a band gap depth control can be achieved by manipulating the width of the areas with a reduced magnetization. Furthermore, the band gaps for the latter structure are shifted to lower frequencies (the white dotted lines mark the position of the band gaps for the MC with nm). This fact can be understood by analyzing the dispersion relations (see Fig. 3(b)) calculated using an average saturation magnetization of the entire structure of T. Considering this, one can observe that the band gap positions obtained from the simulation match very well the ones calculated analytically. In addition, from Fig. 3(a) one can observe the formation of a supplementary band gap at a frequency of 7.5 GHz, which corresponds to a Bragg reflection of the third spin-wave width mode. This effect is visible at lower frequencies where there is a large frequency interval between the first and the third width modes at the first Bragg wavenumber (see Fig. 3(b)). Furthermore, one should note that the band gaps widths are not changed by using larger areas with a decreased magnetization.
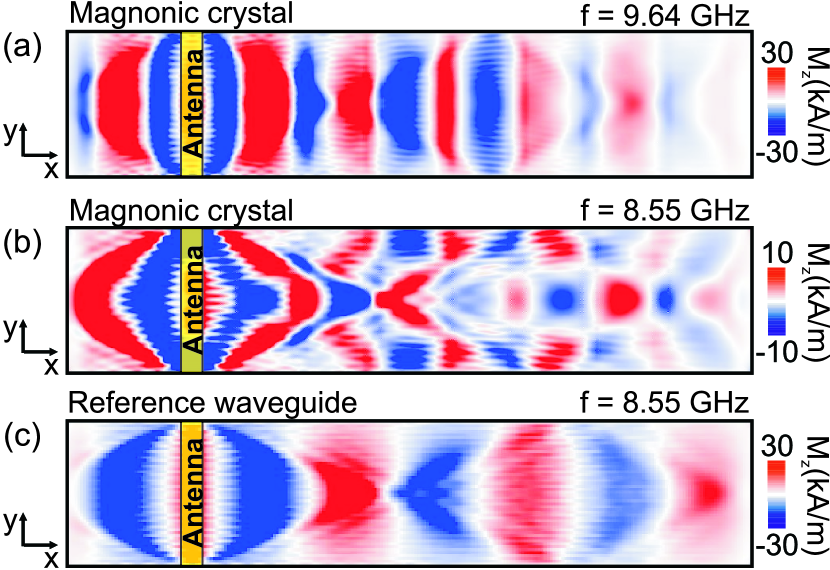
Each spin-wave width mode possesses individual band gaps for the wavenumbers that satisfy the Bragg condition. Therefore, exciting exactly with a frequency for which only one width mode is reflected the other modes will be transmitted. For example, using an excitation frequency of 9.64 GHz (second band gap at for the third width mode, see Fig. 3(b)) the magnetization oscillation pattern shows a propagation of only the first width mode, as can be seen in Fig. 4(a). If a frequency of 8.55 GHz is used (band gap at for the first width mode) the magnetization oscillation patterns evidence the fact that only the third width mode is transmitted (Fig. 4(b)). The two spatial distributions of the magnetization are compared with the one obtained for the reference waveguide (Fig. 4(c)) where a typical interference patternButtner ; Demidov2 between the first and the third width modes is observed. An excitation frequency of 8.55 GHz was used for the latter case. Since different spin-waves width modes can be suppressed at chosen excitation frequencies makes the magnonic crystal to act as a mode selective filter.
In summary, we performed a micromagnetic study of the spin-wave transmission in 1D magnonic crystals based on a permalloy waveguide with a periodic variation of its saturation magnetization. The appearance of frequency band gaps was clearly observed and studied in the space and frequency domains. The band gaps are determined by the superposition of individual band gaps of the fundamental and of the higher order spin-wave width modes. Furthermore, the rejection bands depend strongly on both the level of the magnetization variation and the size of the area with a reduced magnetization: The reduction of the saturation magnetization over a larger area leads to the formation of more pronounced band gaps. At the same time the magnetization averaged over the MC must be taken into account for the spin-wave dispersion relation: shifts the spin wave dispersion characteristics down, i.e. the band gaps appear at lower frequencies.
ACKNOWLEDGMENTS
Financial support by the DFG SE-1771/1-2 is gratefully acknowledged.
References
- (1) Yu.V. Gulyaev, A.A. Nikitov, Dokl. Phys. 46, 687 (2001).
- (2) S.L. Vysotskii, S.A. Nikitov, Yu.A. Filimonov, J. Exp. Theor. Phys. 101, 547 (2005).
- (3) A.V. Chumak, V.I. Vasyuchka, A.A. Serga, M.P. Kostylev, V.S. Tiberkevich, B. Hillebrands, Phys. Rev. Lett. 108, 257207 (2012).
- (4) A.B. Ustinov, A.V. Drozdovskii, B.A. Kalinikos, Appl. Phys. Lett. 96, 142513 (2010).
- (5) J. Ding, M. Kostylev, A.O. Adeyeye, Appl. Phys. Lett. 100, 073114 (2012).
- (6) Z.K. Wang, V.L. Zhang, H.S. Lim, S.C. Ng, M.H. Kuok, S. Jain, A.O. Adeyeye, Appl. Phys. Lett. 94, 083112 (2009).
- (7) V.V. Kruglyak, R.J. Hicken, J. Magn. Magn. Mater. 306, 191 (2006).
- (8) K.S. Lee, D.S. Han, S.K. Kim, Phys. Rev. Lett. 102, 127202 (2009).
- (9) A.V. Chumak, P. Pirro, A.A. Serga, M.P. Kostylev, R.L. Stamps, H. Schultheiss, K. Vogt, S.J. Hermsdoerfer, B. Laegel, P.A. Beck, B. Hillebrands, Appl. Phys. Lett. 95, 262508 (2009).
- (10) F. Ciubotaru, A.V. Chumak, N.Yu Grigoryeva, A.A. Serga, B. Hillebrands, J. Phys. D: Appl. Phys. 45, 255002 (2012).
- (11) A.V. Chumak, T. Neumann, A.A. Serga, B. Hillebrands, M.P. Kostylev, J. Phys. D: Appl. Phys. 42, 205005 (2009).
- (12) A.V. Chumak, V.S. Tiberkevich, A.D. Karenowska, A.A. Serga, J.F. Gregg, A.N. Slavin, B. Hillebrands, Nat. Commun. 94, 141 (2010).
- (13) A.V. Chumak, A.A. Serga, B. Hillebrands, M.P. Kostylev, Appl. Phys. Lett. 93, 022508 (2008).
- (14) A.V. Chumak, A.A. Serga, S. Wolff, B. Hillebrands, M.P. Kostylev, Appl. Phys. Lett. 94, 172511 (2009).
- (15) M. Krawczyk, H. Puszkarski, Phys. Rev. B 77, 054437 (2008).
- (16) G. Gubbiotti, S. Tacchi, G. Carlotti, N. Singh, S. Goolaup, A.O. Adeyeye, M. Kostylev, Appl. Phys. Lett. 90, 092503 (2007).
- (17) M. Kostylev, P. Schrader, R.L. Stamps, G. Gubbiotti, G. Carlotti, A.O. Adeyeye, S. Goolaup, N. Singh, Appl. Phys. Lett. 92, 132504 (2008).
- (18) B. Obry, P. Pirro, T. Brächer, A.V. Chumak, J. Osten, F. Ciubotaru, A.A. Serga, J. Fassbender, B. Hillebrands, Appl. Phys. Lett. 102, 202403 (2013).
- (19) The simulations were performed using the OOMMF open code: M.J. Donahue, D.G. Porter, Report NISTIR 6376, NIST, Gaithersburg, MD, USA (1999)
- (20) M. Dvornik, A.N. Kuchko, V.V. Kruglyak, J. Appl. Phys. 109, 07D350 (2011).
- (21) V.E. Demidov, M.P. Kostylev, K. Rott, P. Krzysteczko, G. Reiss, S.O. Demokritov, Appl. Phys. Lett. 95, 112509 (2009).
- (22) O. Büttner, M. Bauer, C. Mathieu, S.O. Demokritov, B. Hillebrands, P.A. Kolodin, M.P. Kostylev, S. Sure, H. Dötsch, V. Grimalsky, Yu. Rapoport, A.N. Slavin, IEEE Trans. Magn. 34(4), 1381 (1998).
- (23) P. Pirro, T. Brächer,K. Vogt, B. Obry, H. Schultheiss, B. Leven, B. Hillebrands, Phys. Stat. Sol. B 248, 2404 (2011).
- (24) V.E. Demidov, S.O. Demokritov, K. Rott, P. Krzysteczko, G. Reiss, Phys. Rev. B 77, 064406 (2008).