SINGLE W AND Z PRODUCTION, ASYMMETRIES, AND V+JETS AT THE TEVATRON
We present the most recent and production, asymmetries, and +jets results from the Tevatron collider at = 1.96 TeV, analyzing data collected by CDF and D0 detectors between 2002-2011. The results include the measurements of the and bosons properties, include boson and asymmetries measurements, and also the and boson plus jets productions. Those measurements provide precision tests on the electroweak theory in Standard Model (SM), parton distribution functions (PDFs) , and high order theoretical predictions.
1 Introduction
The Tevatron has been shutdown at 2011, after that, there are plenty of analyses related to the single and boson have been performed. With precision measurement of / properties and asymmetries, several critical tests have been done for electroweak theory in the SM. The Tevatron is a collider, the and are produced with the , and in the same time, at the LHC, in the productions of single and boson, the contributions from and become larger. Thus, single and measurements at the Tevatron are complementary for LHC. Furthermore, with knowing incoming direction, the forward-backward charge asymmetry at the Tevatron is more sensitive compared with the LHC.
There are many of jets measurements in the past year, with CDF/D0 full data-set, the statistics uncertainties has been highly suppressed. All of those measurements provides a precision test on the perturbative quantum chromodynamic (QCD) formalism, also the quark PDFs.
In this note, we will first review two single related analyses, which are weak mixing angle measurement and measurements . After that, there will be short review on the Tevatron jets measurements.
2 Single and productions
2.1 Weak mixing angle
Weak mixing angle is one of fundamental parameters in SM. It is a key parameter related to the electroweak couples, for both charge current () and neutrino current (). The weak mixing angle is a running parameters in a wide region of central of energy, there are many measurements have been done before, like atomic parity violation , Milloer scattering , and NuTeV . In the peak region, the most precision measurements are from LEP quark asymmetries, and SLD Left-Right hand asymmetries () . The results from those two measurements are deviated by three standard deviations in different directions. Recently at the hadronic collider, CDF , D0 , and CMS have been performed this measurement, which show reasonable agreement with world average value. Due to the limitations from the parton distribution functions (PDFs) and quark fragments, the dominated systematic uncertainty comes from PDFs, which can be possibly suppressed by the update of PDFs sets.
In the SM, with boosted effects from the QCD radiation, the Collin-Soper (CS) frame is employed to reduce the impact from the boson . And in the CS frame, the general expression for the angular distribution is described by the polar () and azimuthal () angles of the decay-electrons, the boson differential cross section can be wrote as:
| (1) | |||||
where, the and are extracted from distribution, and and are extracted from distribution, while to are expected to be zero. The term is related to the forward and backward charge asymmetry distribution. There are two sources contribute to the asymmetry, one is the photon vector and axial interference, this asymmetric component is proportional , another one is the boson amplitude self interference, which has a coupling factor that is a product of from the electron and quark vertices, related to the . At the Born level, this product is
where and represent the electron and quark, is the charge of a light quark (, , or ).
With 2.1 fb-1 data, CDF uses the same selection cuts and tuned Monte Carlo (MC) as angular coefficients . A new method has been developed to measure weak mixing angle. Two inputs used to extract , a measured value of and templates with different input. The measured value, denoted as , is a cross section weighted average in the dielectron mass region between 66 - 116 GeV/. The templates sets are calculated with same dielectron kinematic region, which can provide the relationship between input and . The QCD calculation of include a LEP-like implementation of electroweak radiative corrections.
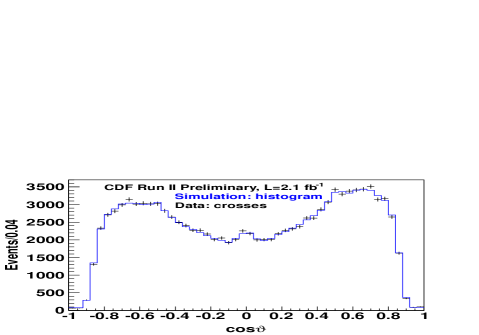
The is derived from the previous measurement of electron decay angular distribution coefficients. The coefficients are measured in bins of the dielectron pair , it is a data driven measurement, by comparing the observed distribution against the simulated templates with different input value. The coefficients are adjusted in bins of the pair . The simulation of Drell-Yan pair production uses the PYTHIA generator, combined with CDF detector simulation programs. With CTEQ5L nucleon parton distribution functions (PDFs), and PHOTOS to provide a good model of QED final state radiation, the simulation provide a proper MC sample, which can well describe the data.
As shown in Figure 1, the distribution for combined central-central (CC) and central-plus (CP) topology dielectron. For the separated CC and CP topology distribution, the ’s between the simulation and the data are 49.0/50 and 46.9/46. The data values are measured in five bins: 0-10, 10-20, 20-35, 35-55 and 55 GeV/. Since both and can change the distribution, a simultaneously fitting of both and is performed. The physics model distribution is varied using an event reweighting method. The event weight is defined as:
where and denote to the variations of those two parameters, at the same time, and are represent to the base physics model angular coefficients. The measured values of is incorporated into the physics model for the calculation. The calculation gives
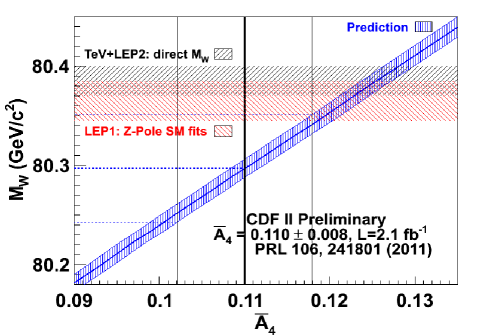
where the first uncertainty is the statistical uncertainty and the second the systematic uncertainty. The standard model predictions of of various input values of (or ) calculated by RESBOS are shown in Figure 1. The indirect measurement of :
where the uncertainty includes both measurement and prediction uncertainties. The other -mass measurements shown in Figure 1 are from combinations of Tevatron and LEP/SLD measurements :
where the direct is the combination of LEP2 and Tevatron mass measurements, and pole is an indirect measurement from electroweak SM fits to LEP1/SLD -pole measurements with the top mass measurements. With , the extracted is
which is consistent with the Tevatron value from D0 .
2.2 Transverse momentum cross section measurement
Initial state QCD radiation from the colliding parton can change the kinematic of the Drell-Yan process system, give boson a transverse momentum, thus the precision measurement of boson can provide a stringent test on the higher order QCD perturbative calculation.
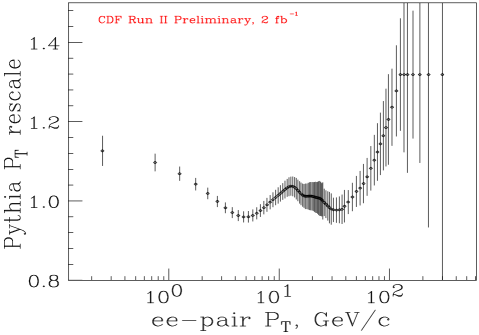
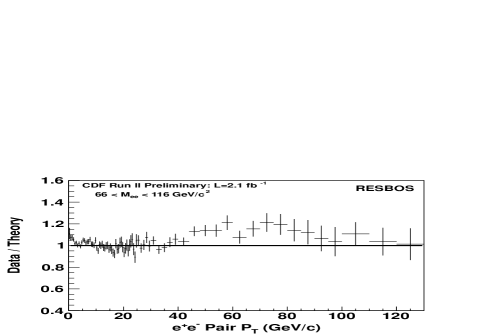
With 2.1 fb-1 of integrated luminosity data, CDF performed a precision measurement of transverse momentum cross section of pairs in the boson mass region of 66-116 GeV/. In order to get agreement between data distribution and simulated distribution, the generator level distribution is adjusted, bin-by-bin. The method uses the data-to-simulation ratio of the number of reconstructed events in bins as an iterative adjustment estimator for the generator level bins. Figure 2 is the generator level correction function that makes the data-to-simulation ratio uniform.
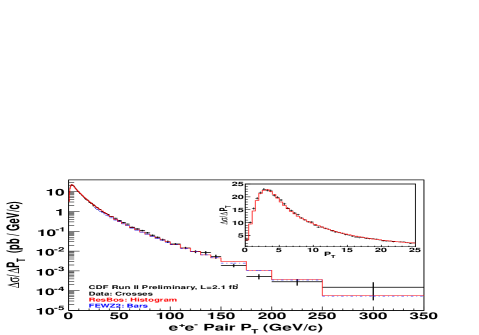
In Figure 3, the measured cross section is compared with two quantum chromodynamic calculations. One is FEWZ2 , a fixed-order perturbative calculation at , and the other is RESBOS, which combines perturbative predictions at high transverse momentum with the gluon resummation formalism at low transverse momentum. Comparisons of the measurement with calculations show reasonable agreement. The ratio of the measured cross section to the RESBOS prediction in the low region is shown in Figure 3.
3 + Jets measurements
, plus jets have been studied in both CDF and D0. Those processes are very important backgrounds for new physics search, and provide stringent test on the perturbative QCD calculation, and the theoretical predictions are suffered from large uncertainties. For some special channel, the quark PDFs can be constraint, like .
3.1 +Jets measurement
Using a 3.7 fb-1 dataset collected by the D0 detector, D0 measured inclusive production . Differential cross section are presented as a function of the jet rapidity (), lepton transverse momentum () and pseudo-rapidity (), the scalar sum of the transverse energies of the and all jets (), leading dijet and mass, dijet rapidity, opening angle, azimuthal angular. And compared the measured cross section with plenty of MC predictions.
3.2 measurement
A measurement of production cross section with up to two jets has been published by CDF collaboration, the measured cross section reported is pb (), with 3 standard deviation from the predictions. With 6.1 fb-1 data, D0 measured an inclusive cross section of pb for 1.7. The results are in agreement with prediction from next-to-leading order QCD calculation using MCFM , and also with predictions from the SHERPA and MADGRAPH MC event generators.
3.3 measurement
The associated production of the boson with a single charm quark in proton-antiproton collisions is described at the lowest order in the standard model (SM) by quark-gluon fusion (), where denotes a , , or quark. At the Tevatron, the larger quark PDF in the proton is compensated by the small quark-mixing matrix element , only about 20% of the total production is comes from , the majority contribution is comes from strange quark-gluon fusion. Thus, the production cross section is sensitive to the gluon and quark PDFs.
CDF collaboration report the first observation of the production , using data corresponding to 4.3 fb-1. Charm quark candidates are selected through the identification of an electron or muon from charm-hadron semileptonic decay within a hadronic jet, and a signal is observed with a significance of 5.7 standard deviations. The production cross section is measured to be pb, in agreement with theoretical expectations. The quark-mixing matrix element is also derived, along with a lower limit of 0.71 at 95% confidence level, asumming that the production throught to quark coupling is dominant.
3.4 jets measurement
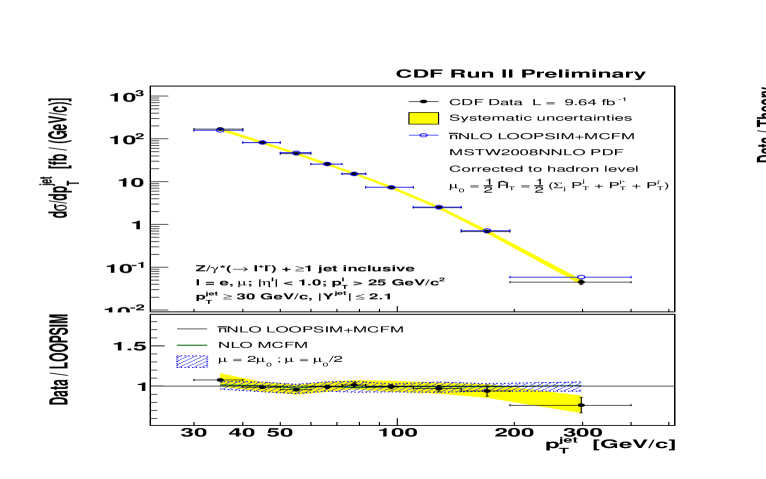
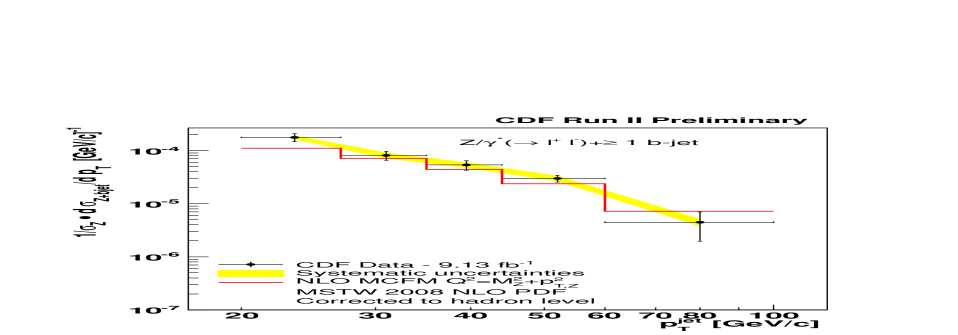
Based on 6.0 fb-1 data collected with CDF detector, CDF collaboration reported a inclusive boson plus jets production , the cross sections are measured as a function of and jet multiplicity for jet in the region 2.1, results are compared with NLO perturbative QCD predictions. One example of measured data compared with different theoretical predictions is shown in Figure 4 for jet events.
3.5 measurements
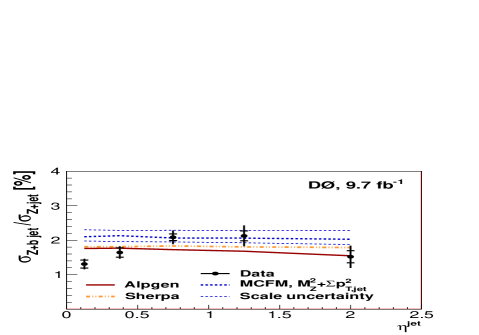
Studies of boson production in association with jets from quarks, or jets, provide important tests on the QCD predictions. And is also a major background for variety of physics processes. Both CDF and D0 measured the cross section with RunII full data-set. The results are compared to the NLO predictions with various MC events generators. As shown in Figure 5, the measured cross sections are compared with different MC predictions for different various.
4 Summary
CDF and D0 collaborations present plenty of precision measurements of the single and properties, jets. Those precision measurements provide stringent tests on the electroweak theory in the SM, high order perturbative QCD calculation, and quark PDFs. And with Tevatron full dataset, there will be more precision measurements coming soon, most of them will become to the legacy measurement at the Tevatron.
References
References
- [1] CDF II Detector Technical Design Report No. Fermilab-Pub-96/390-E; D. Acosta et al. (CDF Collaboration), Phys. Rev. D 71, 052003 (2005).
- [2] V.M. Abazov, et al., (D0 Collaboration), Nucl. Instrum. Methods Phys. Res. A 565 (2006) 463.
- [3] J. Pumplin et al., J. High Energy Phys. 07, 012 (2002); D. Stump et al., J. High Energy Phys. 10, 046 (2003).
- [4] T. Aaltonen, et al., (CDF Collaboration), public note 10952.
- [5] T. Aaltonen, et al., (CDF Collaboration), Phys. Rev. D. 86, 052010 (2012).
- [6] S. C. Bennett and C. E. Wieman, Phys. Rev. Lett. 82, 2484 (1999).
- [7] P. L. Anthony et al. (SLAC E158 Collaboration), Phys. Rev. Lett. 95, 081601 (2005).
- [8] G. P. Zeller et al. (NuTeV Collaboration), Phys. Rev. Lett. 88, 091802 (2002) [Erratum-ibid. 90, 239902(2003)].
- [9] G. Abbiendi et al. (LEP Collaborations ALEPH, DEL-PHI, L3 and OPAL; SLD Collaboration, LEP Elec-troweak Working Group, SLD Electroweak and Heavy Flavor Groups), Phys. Rep. 427, 257 (2006).
- [10] D. Acosta, et al. (CDF Collaboration), Phys. Rev. D 71, 052002 (2005).
- [11] V. M. Abazov, et al. (D0 Collaboration), Phys. Rev. Lett. 101, 191801 (2008).
- [12] V. M. Abazov, et al. (D0 Collaboration), Phys. Rev. D 84, 012007 (2011).
- [13] S. Chatrchyan, et al. (CMS Collaboration), Phys. Rev. D 84, 112002 (2011)
- [14] J. C. Collins and D. E. Soper, Phys. Rev. D 16, 2219 (1977).
- [15] E. Mirkes, Nucl. Phys. B 387, 3 (1992); E. Mirkes and J. Ohnemus, Phys. Rev. D 50, 5692 (1994).
- [16] T. Aaltonen, et al. (CDF Collaboration), Phys. Rev. Lett. 106, 241801 (2011).
- [17] T. Sjostrand, P. Eden, L. Lonnblad, G. Miu, S. Mrenna, and E. Norrbin, Comput. Phys. Commun. 135, 238 (2001).
- [18] E. Barberio and Z. Was, Computer Phys. Comm. 79, 291 (1994); E. Barberio, B. van Eijk, and Z. Was, ibid. 66, 115 (1991)
- [19] G. A. Ladinsky and C.-P. Yuan, Phys. Rev. D 50, 4239 (1994); C. Balazs and C.-P. Yuan, ibid. 56, 5558 (1997); F. Landry, R. Brock, P. M. Nadolsky, and C.-P. Yuan, ibid. 67, 073016 (2003); A. Konychev and P. Nadolsky, Phys. Lett. B 633, 710 (2006).
- [20] J. Beringer et al. (Particle Data Group), Phys. Rev. D 86, 010001 (2012).
- [21] S. D. Drell and T.-M. Yan, Phys. Rev. Lett. 25, 316 (1970).
- [22] K. Melnikov and F. Petriello, Phys. Rev. D 74, 114017 (2006).
- [23] V. M. Abazov, et al. (D0 Collaboration), arXiv:1302.6508 [hep-ex]
- [24] T. Aaltonen, et al. (CDF Collaboration), Phys. Rev. Lett. 104, 131801 (2010).
- [25] V. M. Abazov, et al. (D0 Collaboration), Physics Letters B 718 (2013)
- [26] J. M. Campbell and R. K. Ellis, Phys. Rev. D 60, 113006 (1999); ibid. 62, 114012 (2000); ibid. 65, 113007 (2002).
- [27] T. Gleisberg et al., J. High Energy Phys. 02, 007 (2009).
- [28] J. Alwall, et al., J. High Energy Phys. 1106, 128, 2011.
- [29] T. Aaltonen, et al. (CDF Collaboration), Phys. Rev. Lett. 110, 071801 (2013).
- [30] T. Aaltonen, et al., (CDF Collaboration), public note 10216.
- [31] T. Aaltonen, et al., (CDF Collaboration), public note 10594.
- [32] V. M. Abazov, et al. (D0 Collaboration), arXiv:1301.2233 [hep-ex]