Water vapor in nearby infrared galaxies as probed by Herschel⋆
Abstract
We report the first systematic study of the submillimeter water vapor rotational emission lines in infrared (IR) galaxies based on the Fourier Transform Spectrometer (FTS) data of Herschel SPIRE. Among the 176 galaxies with publicly available FTS data, 45 have at least one H2O emission line detected. The H2O line luminosities range from to while the total IR luminosities () have a similar spread (). In addition, emission lines of H2O+ and HO are also detected. H2O is found, for most galaxies, to be the strongest molecular emitter after CO in FTS spectra. The luminosity of the five most important H2O lines is near-linearly correlated with , no matter whether strong active galactic nucleus signature is present or not. However, the luminosity of H2O() and H2O() appears to increase slightly faster than linear with . Although the slope turns out to be slightly steeper when ULIRGs are included, the correlation is still closely linear. We find that / decreases with increasing /, but see no dependence on /, possibly indicating that very warm dust contributes little to the excitation of the submillimeter H2O lines. The average spectral line energy distribution (SLED) of the entire sample is consistent with individual SLEDs and the IR pumping plus collisional excitation model, showing that the strongest lines are H2O() and H2O().
Subject headings:
galaxies: ISM — galaxies: starburst — infrared: ISM — ISM: molecules(Online-only material: color figures)
1. Introduction
H2O can be one of the most abundant oxygen molecular carriers besides CO in the warm interstellar gas (but it is mostly locked in icy interstellar dust grains in cold regions of the Galaxy, e.g., Melnick & Bergin, 2005; van Dishoeck et al., 2011). Nevertheless, the study of the rotational H2O line is always far more challenging than CO at low redshift. The main difficulty is from the contamination of the H2O in the Earth atmosphere. However, some pioneering research with the Infrared Space Observatory (covering m) (Kessler et al., 1996) of both star-forming regions within our Galaxy, like Orion (Harwit et al., 1998), and nearby galaxies, like Arp220 (González-Alfonso et al., 2004), NGC253 and NGC1068 (Goicoechea et al., 2005), and Mrk231 (González-Alfonso et al., 2008), revealed that H2O lines likely trace the local infrared radiation field (IRF) directly, thus provide a unique diagnostic probing the physical and chemical processes unlike other gas tracers like CO. The Herschel Space Observatory (Pilbratt et al., 2010) with great improvement of sensitivity, angular resolution and band coverage offers an unprecedented opportunity to study the submillimeter regime of galaxies without atmospheric contamination, thus provides unique chances to observe the H2O lines within the SPIRE band (m, Griffin et al., 2010).
Herschel has revealed a wealth of submillimeter H2O lines in, e.g., Mrk231 (van der Werf et al., 2010; González-Alfonso et al., 2010, G-A10 hereafter), Arp220 (Rangwala et al., 2011; González-Alfonso et al., 2012, 2013), NGC4418 (González-Alfonso et al., 2012), NGC1068 (Spinoglio et al., 2012), NGC6240 (Meijerink et al., 2013) and M82 (Kamenetzky et al., 2012), from energy level / K up to / K. Moreover, some detections from ground in high- ultra-luminous IR galaxies (ULIRGs) were also reported (e.g. Omont et al., 2011; van der Werf et al., 2011; Combes et al., 2012; Omont et al., 2013; Riechers et al., 2013). H2O line strength is found to be comparable with neighboring high- CO lines ( to ) in these studies.
By modeling the H2O excitation and dust continuum in Mrk231, G-A10 interpreted that collisional excitation from a cool extended region (610 pc, 41 K) is responsible for part of the low-lying line excitation, while IR pumping through far-IR photons by compact warm dense gas (120 pc, 95 K) excites high-lying lines and part of low-lying lines. The high abundance of H2O can be explained as a consequence of shocks/cosmic rays and X-ray dominated regions (XDR) chemistry (Meijerink et al., 2005), and/or an “undepleted chemistry” (G-A10). Therefore, H2O excitation is naturally linked to the local IRF, probing, e.g., the size and strength of the IR power source; tracing a different regime of gas than that of CO. Hence it is important to have a systematic study of the H2O lines in galaxies, for better understanding the gas excitation and physical processes within.
2. The Sample and Data Reduction
We used the Herschel Science Archive (HSA), containing both the SPIRE//Fourier Transform Spectrometer (FTS; Naylor et al., 2010) spectra at 450–1550GHz, and the PACS (Poglitsch et al., 2010) images at 70, 100 and m. Our sample consists of 45 sources with at least one rotational H2O transition detected among 176 nearby galaxies available. The data are from 10 projects including HerCULES (PI: P. van der Werf) with an H2O detection rate % and GOALS (PI: N. Lu., a full list can be found here: http://sfig.pmo.ac.cn/~yangcht/h2oSample.txt). The typical SPIRE/FTS integration time is about several hours.
The data were reduced with HIPE v9 (Ott, 2010). Basic steps of spectral data reduction contain background removal using off-axis detector subtraction and flux calibration with Neptune and Uranus, when available. Deglitch, flat field, calibration through HIPE, and brightness drift subtraction with Scanamorphos (Roussel, 2012) have been used to reduce PACS images. All the H2O emission line detections are above the level. The instrumental sinc function has been adopted for the line fit using customized HIPE scripts, since the intrinsic line width is smaller than the instrumental resolution in most cases. However, the flux could be underestimated by 20% for few sources with very broad linewidth like Arp220, it is still insignificant when we consider the line fitting error (), the main source of the errors. Then we use the formula in Solomon et al. (1992) to convert line intensity () to , taking the luminosity distance in Sanders et al. (2003) (, , and ; Mould et al., 2000).
After convolving Spitzer/MIPS m, PACS 70, 100, and m images to match with the SPIRE beams (Swinyard et al., 2010) following Aniano et al. (2011), we determine whether the source is extended or not based on its radial profile as compared with that of the corresponding Gaussian point-spread functions (PSFs). We use the total IR luminosities (8–1000 m) from Sanders et al. (2003) as the for point sources. For extended galaxies, in-beam is calculated to ensure that and are spatially matched. First, we take the weighting coefficients of Galametz et al. (2013) to combine MIPS 24, PACS 70, 100 and 160 m images into composite maps. Then the in-beam flux ratio between in-aperture and that of the entire source is derived with aperture photometries (FWHM of the Gaussian PSFs). It should be noticed that the practically measured area by SPIRE/FTS is not limited in the FWHM beam, we need an additional correction factor to account for this (D. Liu et al., in preparation). Applying this factor, we can then obtain the corrected in-beam fraction of the for extended sources. matched with the SPIRE beam can thus be obtained by applying this factor and the in-beam fraction to the global in Sanders et al. (2003). The full dataset containing and will be described in D. Liu et al. (in preparation). Since we take the global flux density ratios of 25 – m (/) and 60 – 100 m (/) as the IR colors (flux densities from Sanders et al., 2003) in later analysis, we exclude the extended sources in these cases in order to keep the IR colors free from any contamination in spatial variations.
H2O lines are also detected in the mapping mode data of M82, NGC1068 and NGC253. However, we have dropped M82 mapping mode data because the very weak detection is only in the central detector and we already have a robust detection in the single pointing mode. For NGC253, we add all the spectral data to obtain a global spectrum. For NGC1068, we have at least one H2O line detection in seven detectors. These sources are obviously extended and excluded in the IR color analysis.
| H2O Line | (GHz) | |||||
|---|---|---|---|---|---|---|
| 1, | 1113.343 | |||||
| 2, | 987.927 | |||||
| 3, | 752.033 | |||||
| 4, | 1228.789 | |||||
| 5, | 1097.365 | |||||
| 6, | 1162.912 | |||||
| 7, | 1207.639 | |||||
| 8, | 1410.618 |
| Notes. a: The resulting parameters of , and contain large uncertainties due to the small sample size. and are the slope and intercept from fitting, while and are from the Bayesian method. |
3. Results and Discussion
In our sample we find that H2O is the strongest molecular emitter after high- CO ( to ) in the SPIRE band. In some cases (13%), e.g., ESO320-G030, the strength of H2O() is even stronger. Besides the H2O emission lines, H2O() is detected in absorption in three sources, including Arp220 as reported by Rangwala et al. (2011). H2O+ absorption lines were also detected in a few sources (D. Liu et al. in preparation). In addition, emission lines of H2O+ and HO are detected (Section 3.3). Those ionic molecules are the intermediate species for the main route of gas-phase H2O formation.
3.1. Relation between and IR Luminosities
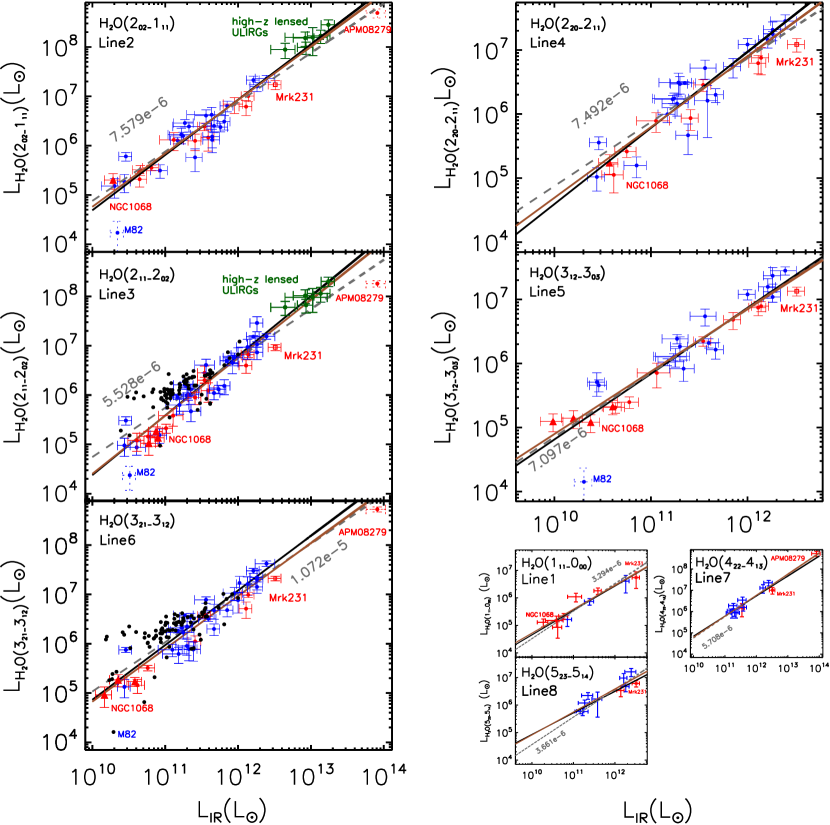
The correlation between for different transitions and was analyzed by two different methods: a Bayesian approach, LINMIX_ERR (Kelly, 2007), and the nonLinear fitting routine, MPFIT (Markwardt, 2009). In Figure 1 we plot the luminosities of H2O(), H2O(), H2O(), H2O(), H2O(), H2O(), H2O() and H2O() (lines 1 to 8 hereafter) against the corresponding . In addition to our sample, we also include five high- ULIRGs (Omont et al., 2013, see online Table 4) and HLSJ0918+5144 (Combes et al., 2012) in our fit for line 2 and 3 (Figure 1). The QSO APM08279+5255 at (van der Werf et al., 2011) is also added for comparison.
The two fitting methods yield similar results in log–log space over four orders of magnitude of the luminosity range. The fit can be described as
| (1) |
The derived parameters are listed in Table 1. All values of are close to 1, i.e., a linear relation, though the given by the Bayesian approach are closer to linear. However, the of lines 3 and 4 are a bit higher than that of other lines. This is weakly significant when we condsider the errors. The of lines 2 and 3 are consistent with Omont et al. (2013). As the slopes are close to linear, we perform an additional linear fit by fixing , and use fitting to determine the constant ratios between and . These ratios vary from for H2O() to for H2O() (see the gray dashed lines and text in Figure 1 and Table 1). Because the detections of lines 1, 7 and 8 are not statistically significant, more data are needed to solidify the fits. In Figure 1, we find most of the H2O() and H2O() upper limits for the non-detections are consistent with the correlation. All the (U)LIRGs have a strong H2O emission compatible with the correlation pointing out to a rather large H2O abundance as known in shocked regions (e.g. G-A10; Harwit et al., 1998). Unlike the case in the Orion Bar, the proto-typical photo-dissociation region (PDR), where CO lines are a factor stronger than the H2O lines, the high ratio of most sources in our sample makes it unlikely that those strong H2O emission originate in classical PDRs (e.g., G-A10). The high ratio in M82 (; Weiß et al., 2010) indicates that it is dominated by classical PDRs, and thus has much weaker H2O lines. As in Weiß et al. (2010), the H2O lines in M82 are found to be very weak, nearly an order of magnitude below the correlation. It would be important to analyze the weak H2O emission in other galaxies like M82, but it is outside the scope of this work. Therefore, we excluded M82 from our fit. Additionally, when we fit the correlations for and without high- ULIRGs, we get slightly lower slopes. This means that high- ULIRGs at the high end have slightly higher /.
The linear correlation could be the result of the very intense far-IR radiation via IR pumping. After the absorption of far-IR photons, the upper level H2O molecules cascade toward the lines we observed in an approximately constant fraction. Thus the H2O luminosity should be linearly correlated with the IR emission. Though detailed excitation modeling is needed, this linear correlation already shows the importance of IR pumping.
| Ratio | |||||
|---|---|---|---|---|---|
| 2/IR, /IR | 6.410-6 | 9.210-6 | |||
| 3/IR, /IR | 3.810-6 | 5.810-6 | |||
| 4/IR, /IR | 5.010-6 | 9.210-6 | |||
| 5/IR, /IR | 5.110-6 | 9.410-6 | |||
| 6/IR, /IR | 6.710-6 | 10.810-6 | |||
| 2/3, / | |||||
| 2/4, / | |||||
| 2/5, / | |||||
| 2/6, / | |||||
| 3/4, / | |||||
| 3/5, / | |||||
| 3/6, / | |||||
| 4/5, / | |||||
| 4/6, / | |||||
| 5/6, / |
| Notes. , and are the correlation coefficients between //], /// and , , respectively (see text). and are the error weighted mean values of // and /// for strong-AGN and star-forming dominated galaxies (see text), respectively. |
Using the NASA/IPAC Extragalactic Database (NED), we have separated our sample into two groups: optically identified strong-active galactic nucleus (AGN) dominated (Seyfert types 1 and 2) and star-forming-dominated galaxies possibly with mild AGNs (classes HII, composite and LINER of Kewley et al. (2006), hereafter ”HII+mild-AGN”), as red and blue points in Figure 1, respectively. There is no obvious difference between these two groups and they both exhibit similar correlations. This implies that both strong-AGN and HII+mild-AGN sources behave similarly in H2O emission, and a strong AGN may have little impact on the H2O excitation. Although the number of statistics is small, the detection rate of HII+mild-AGN (%) is lower than strong AGN (%) for H2O(). The remaining H2O lines have comparable detection rates of both kinds, and line 2 and 3 have the highest detection rate of about 30%. The absence of and apparent significant AGN contribution indicates that an AGN may not be the main power source of the H2O excitation. The origin of such abundant H2O reservoir might thus favor an undepleted chemistry or shocks/cosmic rays rather than XDR chemistry (G-A10).
We then analyzed the correlation between / and the IR colors, along with the (Figure 2 and Table 2). We dismiss lines 1, 7 and 8 here for their insignificant statistics. Hardly has any correlation been found between / and / (Table 2). We find, however, that / ratios decrease with the increasing /, with significant correlation coefficients (). A similar correlation has also been found in lines 7 and 8 though with low statistics. This correlation may be explained by a smaller contribution to the submillimeter H2O line excitation from very warm dust radiation (dust temperature ) than from warm dust (). We also find that line 6 has the largest , possibly indicating that this transition is more sensitive to Td than others. There is no significant correlation between / and except for line 3 () as shown in the second column of Figure 2 and in Table 2. This seems to be consistent with the slightly super-linear relation found for with (Figure 1). The non-variation of / with for most lines confirms the validity of the near-linear relations in Figure 1.
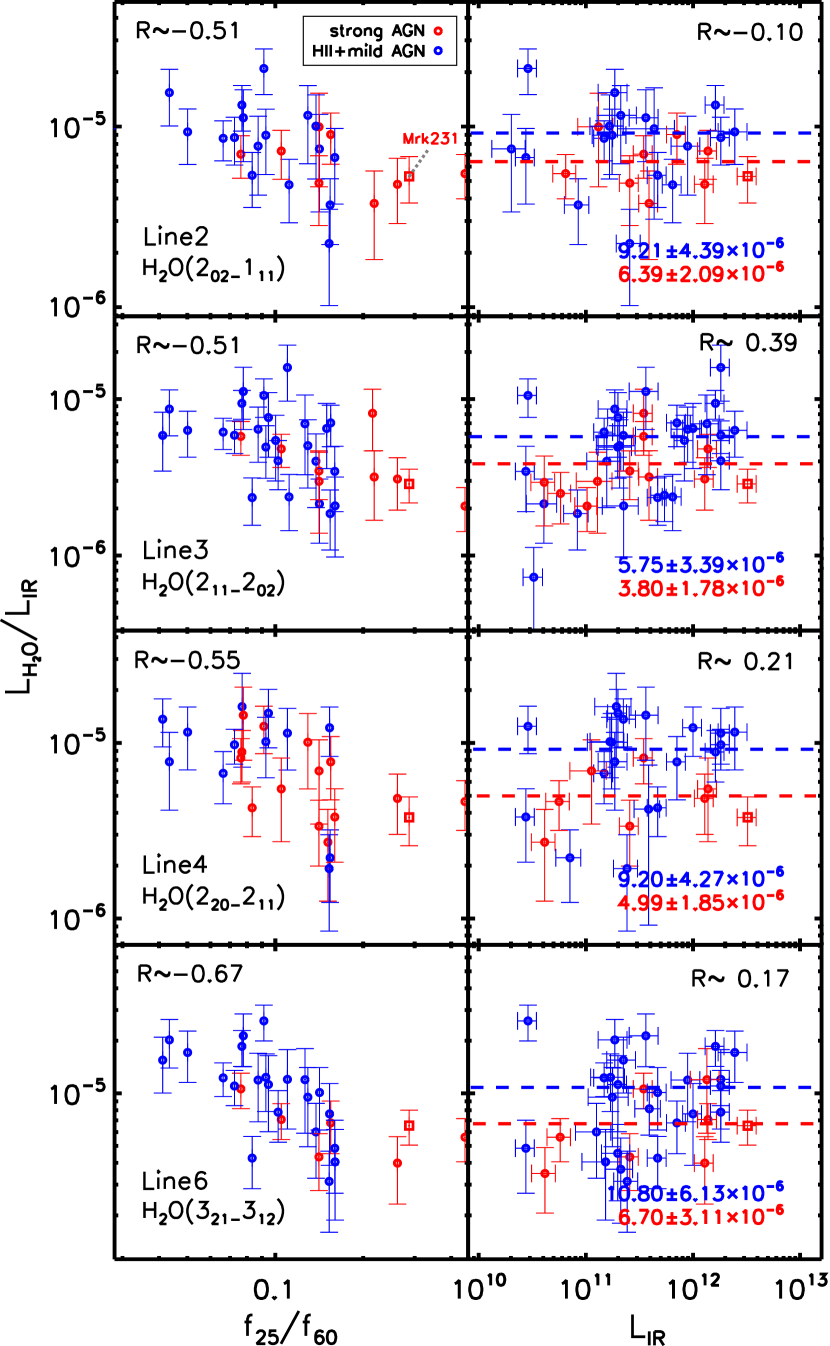
Again, we here separate the sources into strong-AGN and HII+mild-AGN as in Figure 1. It appears that strong AGNs, on average, have higher / compared with the others. This is a well-known property of AGN sources that have more very warm dust than starburst sources (e.g., Younger et al., 2009). However, both strong-AGN and HII+mild-AGN species show a similar trend for the variation of / with /. Their different IR colors might cause the average value of / in strong AGNs to be slightly lower, about 40%, than in HII+mild-AGN sources for all lines (Figure 2 and Table 2), but the difference is hardly significant.
3.2. H2O Line Ratios and the Average Spectral Line Energy Distribution (SLED)
Line ratios between different transitions could help us understand the excitation of H2O and the physical condition of the warm dense gas. Thus we compare the H2O line ratios with IR colors and luminosities. As discussed in Section 2, different transitions have various beam sizes. In order to compare different H2O transitions, we have to remove this beam size dependence. We simply do this by dividing by since they are linearly correlated. Thus /// (a/b111a,b represent different H2O lines at different frequencies with different FTS beamsizes. hereafter) could represent the true luminosity ratio between two H2O lines, a and b. Table 2 lists the results. In Figure 2, / has the steepest dependence on / compared with other lines. Thus the ratio between / of any other line and / should have a correlation with /. Indeed, as we can see in the table, where the for line ratios 2/6, 3/6 and 5/6 versus / is 0.5. Also the line ratio 2/3 decreases with increasing / (). Although there are some close to 0.5 for the correlation between / and , these trends may not be real for they are within the error. The low line ratio 2/6 in Table 2 might indicate that IR pumping is important since collisional excitation alone can not explain the high intensities of the high-lying lines compared with low-lying lines (e.g., G-A10).
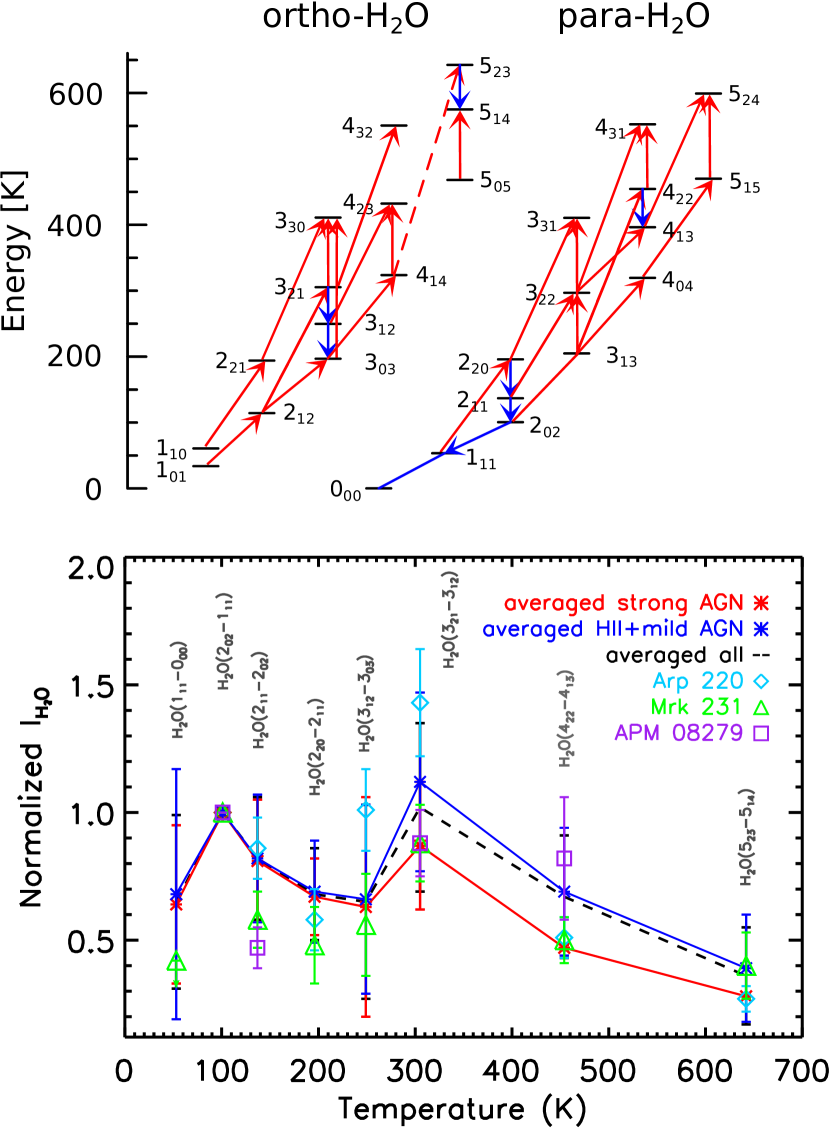
In order to have a general view of the H2O excitation, we calculate the error-weighted average line intensity ratios with respect to H2O(). In Figure 3, the upper panel shows the H2O energy level diagram. The lower panel of Figure 3 shows an average H2O SLED together with SLEDs taken from previous case studies (G-A10; van der Werf et al., 2011; Rangwala et al., 2011). The individual studies agree well with our averaged SLED. All SLEDs show two peaks at H2O() and H2O(), and the latter is slightly stronger. The explanation for the strong high-lying peak could be that the IR spectral energy distribution (SED) peaks are close to m which could result in higher IR pumping efficiency considering the possibility of IR pumping at m (Figure 3, upper panel) which is the main power source of H2O() and H2O() (G-A10). However, we should be cautious in this interpretation because the H2O line intensities depend not only on the excitation conditions, but also on the intrinsic line strengths of the H2O molecule. Detailed excitation modeling is therefore needed. The high-lying lines to H2O() ratios in HII+mild-AGNs appear a bit stronger than strong-AGNs (Figure 3 and Table 2). In Section 3.1, we find that the high-lying lines have steeper anti-correlation on /, thus strong AGNs, with higher /, are expected to show lower high-lying lines to H2O() ratios.
3.3. Emission Lines of H2O-related Ionic and Isotope Molecules
Besides H2O, the related ionic and 18O isotope molecular emission lines are also found. H2O+ forms via ionization of H and H2, after the combination of H2, it forms H3O+, and the recombination with electrons leads to OH and H2O (Hollenbach et al., 2012). Among 45 H2O-detected sources, 5 of them have H2O+(,) (1115.204 GHz), another 5 have H2O+(,) (1139.561 GHz), 12 of them have H2O+(,) (746.194 GHz), 7 sources have H2O+(,) (742.033 GHz) and 3 have HO() (1136.704 GHz) detected. Both strong-AGN- and HII+mild-AGN-dominated galaxies are among these detections. We find their luminosities to be tightly correlated with those of the related H2O transitions. Taking H2O+(,) that has the largest number of detections for an example, the luminosities of H2O+(,) and H2O() perfectly fit a linear correlation. H2O+() lines are about 4.5 times weaker than H2O(), and 2.5 times weaker than H2O(), while the strength of H2O+() is almost the same as that of H2O(). These preliminary results are important for further observations of those ionic diagnostic lines in high- galaxies, although the number of the sources () is not sufficient to draw any concrete conclusion at this stage.
4. Conclusions
H2O is found to be the second strongest molecular emitter in our sample of 45 nearby IR galaxies after high- CO lines within the SPIRE/FTS band. Near-linear correlations have been found between various H2O rotational transitions and corresponding , whereas H2O() and H2O() may have slightly steeper slopes. The ratios of / vary with /, while nearly no any trend with / and has been found, indicating that very warm dust contributes little to the H2O excitation. The near constant / ratios reveal an intrinsic linear correlation, no matter whether a strong AGN is present or not. We find no significant difference in the correlation between strong-AGN and star-forming-dominated galaxies, although strong AGNs might have slightly smaller average ratios /. And in less than one third of both kinds of galaxies, related ionic H2O+ emission lines have been detected, while their strength tightly correlates with that of the corresponding H2O lines. HO isotope line emission is also detected in three sources. It seems that the IR pumping at m, the IR SED peak, is most important in excitation of high-lying H2O lines in these IR galaxies. Nevertheless, detailed modeling is needed, e.g. large velocity gradient or XDR models, in order to derive some physical parameters of the H2O excitation and to provide a quantitative diagnostic tool of the IR radiation field and warm dense gas in galaxies other than CO lines.
References
- Aniano et al. (2011) Aniano, G., Draine, B. T., Gordon, K. D., & Sandstorm, K., 2011, PASP, 123, 1218
- Combes et al. (2012) Combes, F., Rex, M., Rawle, T. D., et al. 2012, A&A, 538, L4
- Galametz et al. (2013) Galametz, M., Kennicutt, R. C.,Calzetti, D., et al. 2013, MNRAS, 431, 1956
- Goicoechea et al. (2005) Goicoechea, J. R., Martín-Pintado, J., Cernicharo, J., 2005, ApJ, 619, 291
- González-Alfonso et al. (2004) González-Alfonso, E., Smith, H. A., Fischer, J., Cernicharo, J., 2004, ApJ, 613, 247
- González-Alfonso et al. (2008) González-Alfonso, E., Smith, H. A., Ashby, M. L. N., et al. 2008, ApJ, 675, 303
- González-Alfonso et al. (2010) González-Alfonso, E., et al. 2010 A&A 518, L43
- González-Alfonso et al. (2012) González-Alfonso, E., Fischer, J., Graciá-Carpio, J., et al. 2012, A&A, 541, A4
- González-Alfonso et al. (2013) González-Alfonso, E., Fischer, J., Bruderer, S., et al. 2013, A&A, 550, A25
- Griffin et al. (2010) Griffin, M. J., Abergel, A., Abreu, A., et al. 2010, A&A, 518, L3
- Harwit et al. (1998) Harwit, M., Neufeld, D. A., Melnick, G. J. & Kaufman, M. J. 1998, ApJ, 497, L105
- Hollenbach et al. (2012) Hollenbach, D., Kaufman, M. J., Neufeld, D., et al. 2012, ApJ, 754, 105
- Kamenetzky et al. (2012) Kamenetzky, J., Glenn, J., Rangwala, N., et al. 2012, ApJ, 753, 70
- Kessler et al. (1996) Kessler, M. F., Steinz, J. A., Anderegg, M. E., et al. 1996, A&A, 315, L27
- Kelly (2007) Kelly, B. C., 2007, ApJ, 665, 1489
- Kewley et al. (2006) Kewley, L. J., Groves, B., Kauffmann, G., Heckman, T. 2006, MNRAS, 372, 961
- Markwardt (2009) Markwardt, C. B., 2009, ASPC, 411, 251
- Meijerink et al. (2005) Meijerink, R., Spaans, M., 2005, A&A, 436, 397
- Meijerink et al. (2013) Meijerink, R., Kristensen, L. E., et al. 2013, ApJ, 762, L16
- Melnick & Bergin (2005) Melnick, G. J. and Bergin, E. A., 2005, Advances in Space Research, 36, 1027
- Mould et al. (2000) Mould, J. R., Huchra, J. P., Freedman, W. L., et al. 2000, ApJ, 529, 786
- Naylor et al. (2010) Naylor, D. A., Baluteau, J.-P, et al. 2010, in Society of Photo-Optical Instrumentation Engineers (SPIE) Conference Series, Vol. 7731, Society of Photo-Optical Instrumentation Engineers (SPIE) Conference Series
- Omont et al. (2011) Omont, A., Neri, R., Cox, P., et al. 2011, A&A, 530, L3
- Omont et al. (2013) Omont, A., Yang, C., Cox, P., et al. 2013, A&A, 551, A115
- Ott (2010) Ott, S. 2010, ASP Conference Series, 434, 139
- Pilbratt et al. (2010) Pilbratt, G.L., Riedinger, J.R., Passvogel, T. et al. 2010, A&A, 518, L1
- Poglitsch et al. (2010) Poglitsch, A., Waelkens, C., Geis, N. et al. 2010, A&A, 518, L2
- Rangwala et al. (2011) Rangwala, N., Maloney, P. R., Glenn, J., et al. 2011, ApJ, 743, 94
- Riechers et al. (2013) Riechers, D. A, Bradford, C. M., et al. 2013, Nature, 496, 329
- Roussel (2012) Roussel, H., 2012, arXiv:1205.2576
- Sanders et al. (2003) Sanders, D. B., Mazzarella, J. M., et al. 2003, AJ, 126, 1067
- Solomon et al. (1992) Solomon, P.M., Downes, D., & Radford, S., 1992, ApJ, 398, L29
- Spinoglio et al. (2012) Spinoglio, L., Pereira-Santaella, M., et al. 2012 ApJ, 758, 108
- Swinyard et al. (2010) Swinyard, B. M., Ade, P., Baluteau, J.-P., et al. 1010, A&A, 518, L4
- van der Werf et al. (2011) van der Werf, P. P., Berciano Alba, A., Spaans, M., et al. 2011, ApJ, 741, L38
- van der Werf et al. (2010) van der Werf, P. P., Isaak, K. G., Meijerink, R., et al. 2010, A&A, 518, L42
- van Dishoeck et al. (2011) van Dishoeck, E. F., Kristensen, L. E., Benz, A. O., et al. 2011, PASP, 123, 138
- Weiß et al. (2010) Weiß, A., Requena-Torres, M. A., Güsten, R., 2010, A&A, 521, L1
- Younger et al. (2009) Younger, J. D., Hayward, C. C., Narayanan, D., et al. 2009, MNRAS, 396, L66