Importance of Q-values in astrophysical -process
Abstract
The importance of measuring Q-values in rapid proton capture process has been investigated. The microscopic optical model, derived using a nucleon nucleon interaction and densities from relativistic mean field calculations, has been utilized to calculate the reaction rates. It has been observed that the Q-values involved in the reactions at waiting points at and 64 are very important in determining the final abundance of the process. Some other Q-values also play a crucial role in the final abundance of nuclei near the end point of the process.
1 Introduction
The astrophysical rapid proton () process involves proton rich nuclei at or beyond the proton drip line. Measuring nuclear masses in these nuclei is a very difficult problem. Even when measurements are available, they have very large errors in many instances. In many other nuclei, one has to depend on the theoretical estimates obtained from various mass formulas. In the present work, we intend to investigate the effect of the mass uncertainty on the final abundance of -process. We study the possible effect of the Q-value of a particular proton capture reaction, or equivalently, the proton separation energy , on the final abundances at different masses.
The importance of the nuclear mass in -process lies mainly in the balance between the forward ) reaction and its inverse. Particularly, at the so called waiting points, i.e. nuclei with even , these two processes compete with each other. A small positive or a negative usually ensures that the inverse process dominates. In such a scenario, the -process may get stalled and wait for -decay of the waiting point nucleus. Of course, it is well known that at certain temperature range, depending on the Q-value of the reaction, two proton capture can bridge the waiting point enabling the -process to continue without any hindrance. The role of nuclear mass in bridging the waiting points has been discussed in various works [See for example Illiadis[1], Schatz[2], or Refs.[3, 4] and references therein].
2 Method of Calculation
Apart from proton capture, a nucleus can also undergo decay by emitting beta particles while, for higher mass isotopes, -decay is another probable channel. In this work, the measured half life values for -decay have been taken from the compilation by Audi et al.[7] except in the case of 65As, which is taken from the experimental measurements by López et al.[8] In absence of experimental data, half life values have been taken from the calculation by Möller et al.[9] both for - and -decay. This results in a set of coupled differential equations which have been simultaneously solved to obtain the nuclear abundances as a function of time.
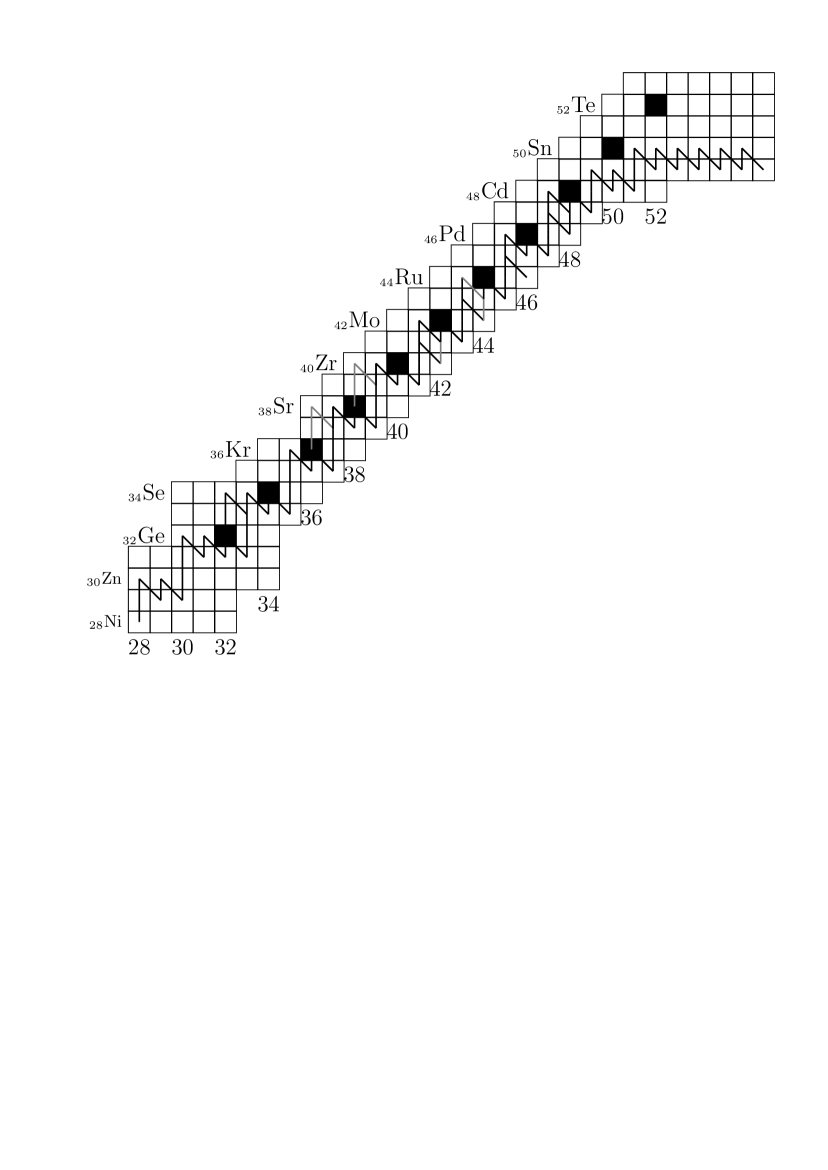
In the present work, we concentrate on the reactions whose Q-values have either not been determined experimentally or, have very large errors. We look at all the reactions that lie on the possible path of the -process starting from 56Ni. There are numerous works that have calculated the above path. In Fig. 1, we present such a path from at 1.5 GK Ref.[3]. The dark and the light lines indicate major (flux more than 10%) and minor (flux between 1 to 10%) paths, respectively. The black boxes indicate waiting points. For this path, we assume that the process has a duration of 100 seconds. The density is assumed to be 106 gram/cm3 and the proton fraction is assumed to be 0.7. This corresponds to a scenario denoted as Model I in Lahiri et al.[6] as well as here. Though, this model is not very realistic, it helps us to understand the flow of the abundance. We will introduce a more realistic scenario at a later stage.
The rates for the astrophysical processes have been calculated in the microscopic optical model using densities from relativistic mean field (RMF) calculations and density dependent M3Y (DDM3Y) potential[10, 11]. Briefly, one starts with a density dependent M3Y interaction and folds it with the nucleon density in the target to obtain a nucleon-nucleus potential. The interaction is given by
| (1) |
where is incident energy and , the nuclear density. The interaction is given by
| (2) |
where is the zero range pseudo potential,
| (3) |
and the density dependent factor,
| (4) |
For the interaction, we have made use of the default parameters, which had been obtained from nuclear matter calculations[12], without any modification.
In order to fit the experimental data, the folded DDM3Y potential is multiplied by factors 0.7 and 0.1 to obtain the real and imaginary parts of the optical potential, respectively. We emphasize that better fits for individual reactions are possible by varying different parameters. But, as we are dealing with a mass region where the experimental mass values are hardly available, this approach is clearly inadequate. Therefore, we have refrained from fitting individual reactions and throughout the rest of the work, we use these two factors to obtain the potential. These constants, along with the prescriptions for level density and E1 strength, have been estimated by fitting the available S-factors for low energy proton reactions in mass 60-100 region[4, 13].
We have calculated the Q-values (say, ) for proton capture reactions using experimental masses from the compilation by Audi et al.[14] or, in their absence, the new phenomenological formula[15] and looked at the variation over the range , where has been chosen as either the measurement error or as equal to the rms error of the formula, i.e. 376 keV, when experimental values are not available. The latter range is large enough to include almost all possible theoretical or systematic predictions (for example predictions from Refs.[9, 16]). In the cases where the mass values have been experimentally measured with reasonable accuracy, the effects of the uncertainties of the measurements on the flow of the process are insignificant. In comparison, if the mass value is either available from theory, phenomenology or systematics, or has a large error, the large possible variation of mass may significantly alter the flow and the end point of the process. We seek to identify the points on the -process path where the uncertainties of the Q-values of the reaction may have significant effects on the final abundance.
3 Results

As an example of the variation of the final abundance, in Fig. 2, we show the change in abundance as a function of the Q-value of the reaction 61Ga(Ge. The experimental value for this reaction has not been measured. We plot the abundance of those mass values whose final abundances are at least 1% of the initial seed. In Fig. 3, we plot the corresponding data for the 65As(Se reaction. Here the experimental values, as indicated in Schury et al.[17] have an error of 200 keV. However, we note that in the same reference, the Q-value for proton capture reaction in 64Ge has been measured to be -255 (104) keV. A recent measurement[18] has measured a slightly different value, i.e. -90 (85) keV, which we also assume in our calculation. Another reference[19] found this Q-value to be 0.401(530) keV. Though we have not assumed this value, we note that it, being positive, alters the flow considerably. The effect of this value, as well as the large error, on the proton separation energy in 66Se also strongly affects the flow.

We further note that at the waiting points, the variation of the final product for changes in the Q-value of the and the reactions can be made nearly identical by simply shifting the origin. For example, in Fig. 4 we plot the major abundances against variation of the Q-value of the reaction 64Ge(). It is clear that the major abundances in Fig. 3 and Fig. 4 follow the same pattern after a shift in the origin. The fact can easily be explained as the probability of crossing the waiting point depends on the Q-values of both the 64Ge() and 65As() reactions. Thus, an increase in either of them inhibits the photodisintegration in a similar way. Hence, we have studied the dependence on only one of the relevant Q-values.

In both the reactions, we have assumed a profile of the X-ray burster as given in Model I. At all other waiting points, the reaction Q-values have smaller effects on the final abundance.
A few important points can be derived from the Figs. 2 and 3. One can see that in , and to some smaller extent and 76, i.e. the waiting points of the process, the abundance tends to fall away about some median value. However, does not behave at all like a waiting point. As indicated in Fig. 4 of Ref.[4], this is due to the fact that at 1.5 GK, the two proton capture process has a very large cross-section for this nucleus. In and 92, we observe a somewhat similar behaviour, though the falling off at higher values is very slow.
The population at the waiting points are not affected to a large extent by processes that do not directly include the nuclei. Thus, for example, the population at changes typically by factor of less than 1.5 over the range of Q-values chosen for the capture reactions at 61Ga and 65As but changes to a greater extent when the proton separation energies of 77Y or 78Zr are varied. Again the waiting point at is an exception. Beyond , the values at the waiting points do not have any significant effect on the final abundance. As is evident from Fig. 1, the waiting points beyond , except to a small extend at and 76, are not bridged effectively by the -process. Hence, these values are almost irrelevant to the final abundance. For proton capture by 68Se, and to a slightly less extent in 76Sr, the variation in mass affects the final abundance to a very small extent. This points to the fact that these waiting points are not bridged to any significant extent by proton capture reactions at the conditions assumed by us and -decay dominates irrespective of the value. On the other hand, Q-values for targets such as 86Tc, 89Ru, 90Rh and 93Pd affect the process, indicating that the -process path shifts to these more stable nuclei beyond .
We also find that the change in abundance at the waiting points, for changes in the Q-value of a particular reaction, tend to be closer to each other. At masses that do not contain a waiting point, the variation is larger and again seem to form a cluster of values near to each other. This is due to the enhancement of a particular pathway. All the nuclei formed in that pathway tend to vary in a similar fashion. For example, the ratio of the final abundances of and 97, when plotted against the Q-value of the reaction 86Tc(), remains almost a constant. This indicates that that there is effectively a single path leading from 86Tc to these masses.
To explain the variation in abundance as seen in Figs. 2 and 3 further, we note that the flux through the waiting points are usually significantly larger than at nearby masses. If a change in the value results in transfer of even a small amount of this flux to the beta decay channel, the flux at corresponding nuclei in non-waiting point masses tends to increase by a significant fraction. Once the flux at such a nucleus increases, it reinforces the subsidiary paths. Hence, the nuclei that are produced, not through the main path but through the subsidiary paths, tend to show a similar pattern as a function of a particular value. If there is any feeding to the -decay channel from a waiting point further up the mass scale, the nuclei in a subsidiary path that are fed by that channel may have still higher abundances. This feature can be seen in the case of proton capture reactions in 61Ga and 65As. When the value at a particular waiting point is very small, the -process gets stalled and the abundance gets trapped at the waiting point. If the value is larger, the waiting point is bridged and flow reaches higher masses. In cases where the waiting point is bridged very effectively, it is possible, like in mass 60 or 64, for the abundance at the waiting point to fall to insignificant values. The abundance at the next waiting points then starts to fall off as the flow to these nuclei stops. The abundances of nuclei produced by the secondary paths, in such circumstances, starts to level off, i.e. their rate of increase as a function of the Q-value of the reaction under study decreases.
If the temperature is taken to be lower, then we have a different scenario. The the abundance gets trapped at a lower mass value, typically . This ensures that the abundances at all the subsequent waiting points becomes constant. The -process cannot proceed very far. In fact, beyond , no mass reaches an abundance of more than 1% of the initial flux.
Finally, in a more realistic situation, where the temperature, density and proton fraction changes with time, we have investigated the effect of the uncertainties in different values. We have selected the time variation of the above quantities following Illiadis[1]. In it, nuclear burning starts with temperature and density values of = 0.4 GK and gm/cm3. After 4 seconds, the system reaches a maximum temperature of 1.36 GK and a minimum density of gm/cm3. After 100 seconds, the temperature drops to 0.7 GK and the density increases to gm/cm3. The proton fraction decreases to 0.16 at 100 seconds. This corresponds to Model IV of Ref.[6] where one can also see the final abundances for the values predicted by Ref.[15] for various temperature density profiles.
In this particular work, we are interested in the change in final abundances due to variation in values. In Fig. 5, we study the change in abundances for variation of the Q-value in 65As() reaction. The solid (dashed) line provides the ratio of the final abundances between the values for and . We find that the baselines vary widely, particularly after . This can be explained from the fact that, in a realistic model, as the nucleosynthesis progresses, both the temperature and the proton fraction decreases. Hence, the rate of rp-process nucleosynthesis slows down towards the end. In case the value at 65As becomes large, the two proton capture cross section becomes large and the waiting point at does not hinder the process appreciably. Hence it is possible for nucleosynthesis to reach much earlier and the abundances in region increase substantially while those in the lower mass region decreases. The opposite scenario occurs when the value at 65As becomes small. That is the reason for he large variation of the baseline. In contrast, Model I shows sharp changes at certain mass numbers with a slow variation of the baseline. However, this appears unphysical as the behaviuour is due to the fact that at 1.5 GK, the change in the effective lifetime of 64Ge due to change in value is larger compared to the values at lower temperatures. This can be observed from Figure 5 of Lahiri et al.[4]. In Model IV the temperature, when -process reaches the waiting point at 64Ge, is much lower and the change in lifetime due to change in value is much less.

To look at the existing experimental mass measurement, we find that the following masses, which have either not been measured at all or measured with insufficient accuracy, are likely to play an important role in determining the final abundances. At the waiting points, masses of 62Ge, 65As and 66Se are important. Experimental values for the last two are available[18], but as already noted, there is some uncertainty since another measurement[19] suggests a different value for the value in 65As. Fig. 4 points out that the end point will be quiet different in case the latter value is adopted. Besides these, masses of 86Tc, 87,89Ru, 90Rh, 91,93Pd and 94Ag are important for the pathways involving more stable nuclei.
4 Summary
To summarize, the uncertainties in the -process abundance due to the errors in Q-values in proton capture reactions have been studied in the microscopic optical model. We have used the DDM3Y nucleon nucleon interaction and densities from RMF to construct the optical potential. Of the waiting points, we have found that the Q-values involved in the reactions at masses and 64 are very important in determining the final abundance of the process. Measurements of Q-values of proton capture reactions involving 86Tc, 89Ru,90Rh and 93Pd are also important in determining the abundance near the end point of the process.
Acknowledgment
This work has been carried out with financial assistance of the UGC sponsored DRS Programme and the computer facilities of the DST-FIST program of the Department of Physics of the University of Calcutta. GG acknowledges the facilities provided under the ICTP Associateship Programme by ECT*, Trento, where a part of the work was carried out. CL acknowledges the grant of a fellowship awarded by the UGC.
References
- [1] C. Illiadis, Nuclear Physics of the Stars (Wiley-VCH Verlag GmbH, Weinheim, 2007).
- [2] H. Schatz, Int. J. Mass Spec. 251, 293 (2006).
- [3] C. Lahiri and G. Gangopadhyay, Int. J. Mod. Phys. E 20, 2417 (2011).
- [4] C. Lahiri and G. Gangopadhyay, Eur. Phys. J. A 47, 87 (2011).
- [5] H. Schatz et al. Phys. Rev. Lett. 86, 3471 (2001).
- [6] C. Lahiri and G. Gangopadhyay, Int. J. Mod. Phys. E 21, 1250074 (2012).
- [7] G. Audi, O. Bersillon, J. Blachot and A. H. Wapstra, Nucl. Phys. A 729, 3 (2003).
- [8] M. J. López Jiménez et al, Phys. Rev. C 66, 025803 (2002) .
- [9] P. Möller, J. R. Nix, and K. L. Kratz, At. Data. Nucl. Data. Tables 66, 131 (1997).
- [10] G. Bertsch, J. Borysowicz, H. McManus and W.G. Love, Nucl. Phys. A 284, 399 (1977).
- [11] A. M. Kobos, B. A. Brown, R. Lindsay and G. R. Satchler, Nucl. Phys. A 425, 205, (1984).
- [12] D.N. Basu, J. Phys. G: Nucl. Part. Phys. 30, B7 (2004).
- [13] C. Lahiri and G. Gangopadhyay, Phys. Rev. C 84, 057601 (2011).
- [14] Private Communication April 2011 by Georges Audi and Wang Meng.
- [15] G. Gangopadhyay, Int. J. Mod. Phys. E 20, 179 (2011).
- [16] J. Duflo and A.P. Zuker, Phys. Rev. C 52, R23 (1995).
- [17] P. Schury et al., Phys. Rev. C 75, 055801 (2007).
- [18] X L Tu et al., Phys. Rev. Lett. 106, 112501 (2011).
- [19] H. S. Xu et al., Chinese Sci. Bull. 54 4749 (2009).